- Department of Statistics, Faculty of Science, King Abdulaziz University, Jeddah, Saudi Arabia
A new least square method (LSM) for time series analysis under indeterminacy is proposed in this work. The proposed LSM under indeterminacy is known as the neutrosophic least square method (NLSM). The NLSM is proposed to forecast wind speed when data are in the interval. The trended line under indeterminacy is introduced and applied using wind speed data. The time series plots under neutrosophic statistics are given. A comparative study shows that the proposed NLSM is more efficient and informative to apply for the forecasting of wind speed.
Introduction
In time series analysis, the least square method (LSM) is applied to study the relationship between the observed variable and the time factor variable. In such a model, the observed variable is taken as the dependent variable, and the time factor variable generated from the time span is taken as an independent variable. The LSM has been widely applied to the best fit of the data in hand. The LSM is applied in estimating future values based on the current data information. Among the other methods of time series analysis, the LSM method is free from personal bias as the mathematical model is applied to get the trend values. In addition, the LSM can be applied effectively in forecasting the values because of its mathematical function. Khalil and Moraes (1995) applied the LSM for methane time series data. Harris et al. (2003) and Ismail and Shabri (2014) applied the LSM for meteorology and lynx datasets, respectively. Yang et al. (2014) introduced genetic programming based on the LSM. More applications of series methods can be seen; see the work of Jebb and Tay (2017) for organizational research, Chatfield and Xing (2019) and McDowall et al. (2019) for time series analysis, and Feyrer (2019) and Kosiorowski et al. (2019) for geography.
The forecasting and estimation in energy areas are carried out using statistical models. For example, the time series model can be applied to estimate and forecast the wind speed for the next days or months. The statistical models have the ability to give a reasonable forecast based on the current or past data. Kavak Akpinar and Akpinar (2005) discussed the applications of statistics on the data obtained from the wind energy system. A statistical distribution was fitted on the wind speed data by Brano et al. (2011). Liu et al. (2016) discussed the forecasting using the LSM. The applications of several statistical distributions on wind speed data were given by Ali et al. (2018), Bidaoui et al. (2019), Alrashidi et al. (2020), and ul Haq et al., 2020. The applications of statistical techniques in the area of energy can be seen in the work of Ozay and Celiktas (2016), Katinas et al. (2018), Qing (2018), Wang et al. (2018), Akgül and Şenoğlu, 2019, Mahmood et al. (2020), and Zaman et al. (2020).
The existing LSM for time series analysis is applied for the forecasting of the wind speed by assuming certainty in the parameters and observations of the data. In practice, the wind speed data are recorded in intervals. Therefore, the existing LSM cannot be applied for the forecasting and estimation of wind speed. The statistical techniques under the fuzzy logic can be applied for the forecasting of the wind speed in this case. Song and Chissom (1993) and Sezer et al. (2020) introduced time series when observations were not exact. The fuzzy-based analysis for various applications was introduced by Przemysław Grzegorzewski (2000), Montenegro et al. (2001), Przemysław Grzegorzewski (2009), von Storch and Zwiers (2013), and Grzegorzewski and Śpiewak, 2019.
Smarandache (1998) introduced the neutrosophic logic as an extension of the fuzzy logic. Smarandache (2015) proved the efficiency of the neutrosophic logic over the fuzzy logic and interval-based analysis. Later on, several people worked on the neutrosophic logic and applied it in various real-life problems; see, for example, the work of Broumi et al. (2017), Abdel-Basset et al. (2019), Smarandache (2019), and Nabeeh et al. (2019). Smarandache (2014) worked on the neutrosophic statistics (NS) and discussed the application and difference between NS and classical statistics (CS). According to Smarandache (2014), “Neutrosophic Statistics refers to a set of data such that the data or a part of it are indeterminate to some degree and to methods used to analyze the data. In classical statistics, all data are determined; this is the distinction between neutrosophic statistics and classical statistics.” Neutrosophic statistics deals with analyzing the data having neutrosophic numbers. Classical statistics is a special case of neutrosophic statistics. The neutrosophic statistics reduces to classical statistics when only determinate numbers are in the data. Chen et al., 2017a and Chen et al., 2017b introduced a different method than Smarandache (2014) to analyze the neutrosophic data. Aslam (2020a) and Aslam (2020c) worked on the statistical tests under NS.
Aslam (2020b) introduced the semi-average method for time series analysis under neutrosophic statistics and applied it for wind forecasting. From the literature study, it can be noted that the existing LSM for time series analysis based on CS is unable to give information about the measure of indeterminacy. According to the best of knowledge, no work is available on the designing of the LSM for time under neutrosophic statistics. In this article, we will focus on presenting the neutrosophic least square method (NLSM) for time series analysis. The application of the proposed NLSM will be given using wind speed data. It is expected that the proposed NLSM can be used effectively to fit the model for wind speed data and forecasting the wind speed for the future.
Least Square Method Under Indeterminacy
As mentioned earlier, the least square method (LSM) has been widely used in practice to find the trend in time series. The existing LSM under CS is worked on the basis of the relationship of the observed value and time factor variables. The existing LSM is applied when observations in both variables are determined and exact. However, as mentioned before, in a complex process or when the data are in intervals, the existing LSM cannot be applied to find the trend values. Let
The neutrosophic linear regression under indeterminacy can be expressed as
where
where
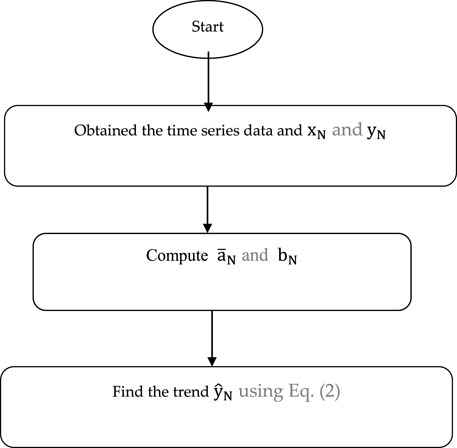
The frame diagram of the proposed method is shown in Figure 1.
Application Using Wind Speed Data
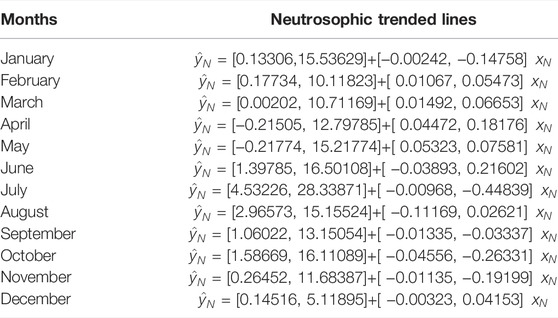
The application of the proposed time series method is given with the help of the wind speed data. The wind speed (mph) of the year 2019 is selected from the Metrology Department of Pakistan. Aslam (2020b) also used the wind speed data for forecasting purpose. The wind speed (mph) data are recorded in intervals, and experts are interested to forecast the wind speed (mph). As the wind speed (mph) data are in the interval, the use of the existing LSM may mislead the experts in forecasting the wind speed. As mentioned before, the methodology under the neutrosophic logic is better than the fuzzy logic and CS. Therefore, energy experts can apply the proposed LSM under NS. Using the proposed method, values of
From Table 1, it can be seen that the intercept of trend lines for the month of April and May is negative. The values of
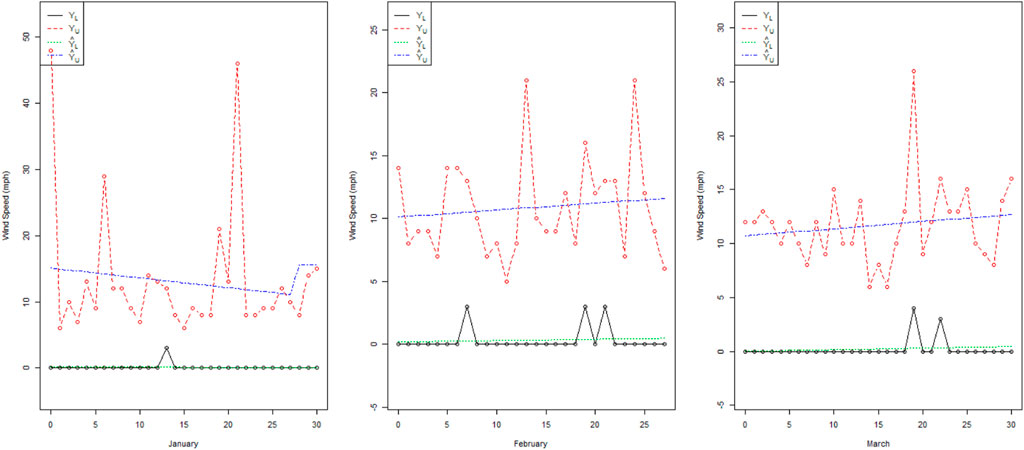
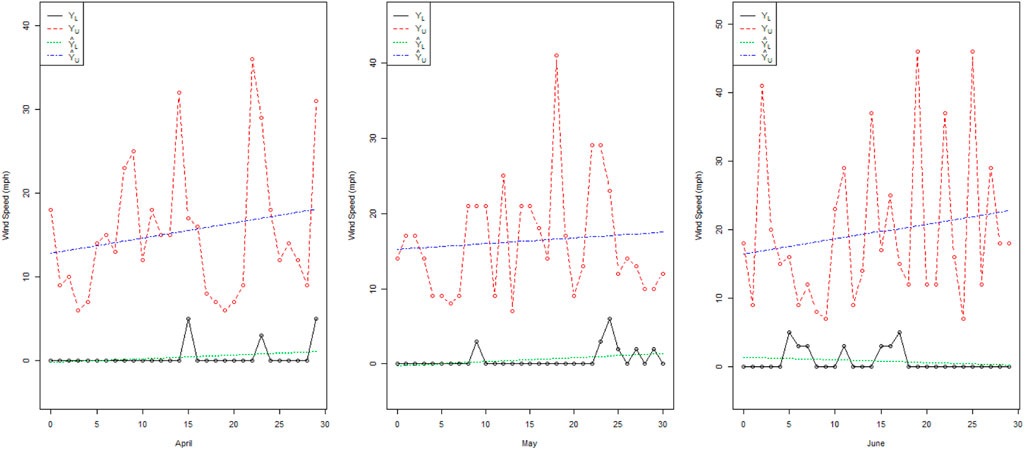
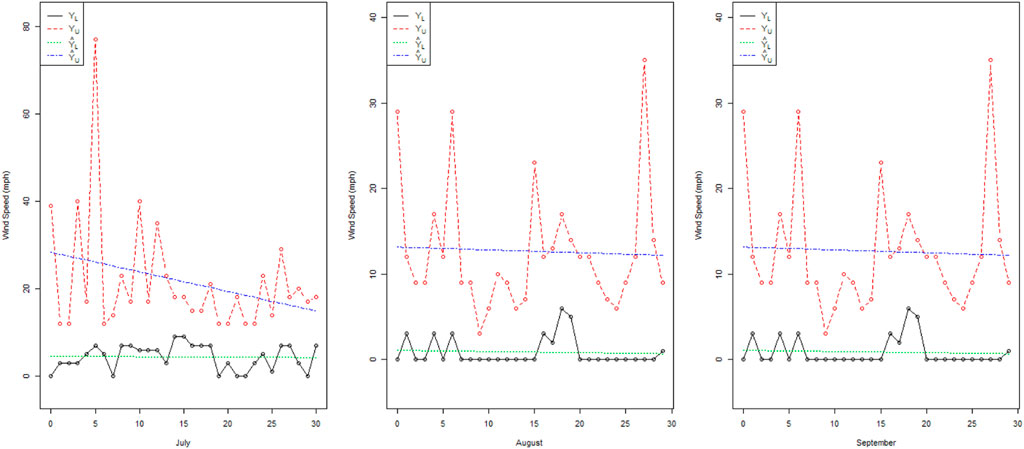
From Figure 2, we note that there is high indeterminacy between the trended values of February and March. The actual values of wind speed (mph) for the month of March have less fluctuation than those for January and February. Figure 3 shows that in June, there are many variations in the wind speed as compared to April and May. From Figure 4, it can be noted that the wind speed in July has fewer variations as compared to the wind speed in August and October. From Figure 5, it can be seen that the wind speed in November has fewer variations as compared to that in October and December. From Figures 2–5, it can be seen that the trended values are in intervals rather than the exact trend values in the existing LSM. Therefore, the proposed NLSM is quite adequate, effective, and reasonable to apply for the forecasting of wind speed. In addition, it is concluded that the presence of high indeterminacy may affect wind speed forecasting.
Comparative Studies Based on Wind Speed Data
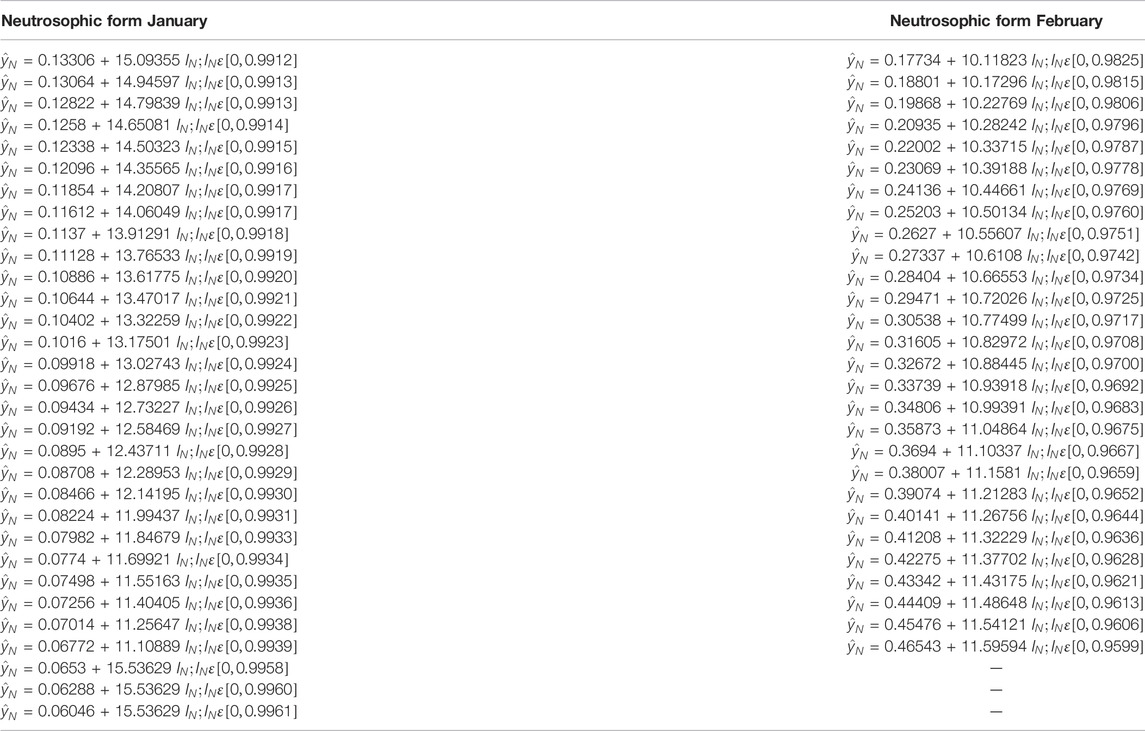
As noted in the previous section, the trended values are in intervals, and indeterminacy is also presented. Therefore, the information about the measure of indeterminacy will be very helpful in forecasting decision making. In this section, we will present the trended values in the neutrosophic form and evaluate the measure of indeterminacy. To save space, the neutrosophic forms along with the measure of indeterminacy are presented only for January and February. The neutrosophic forms of other months can be obtained using the Excel sheet available with the author upon request. From Table 2, it can be noted that the measure of indeterminacy is greater than 0.95 for each day of the 2 months. The first values (determined) of neutrosophic forms denote the results of the wind speed forecasting for the existing LSM under CS. The second values show the values of indeterminate parts. For example, in neutrosophic form
Concluding Remarks
A new least square method (LSM) for time series analysis under indeterminacy was proposed in this manuscript. The proposed LSM under indeterminacy was known as the neutrosophic least square method (NLSM). The NLSM was proposed to forecast the wind speed when the data were in the interval. The trended line under indeterminacy is introduced and fitted using wind speed data. The time series plots under neutrosophic statistics were given. The analysis of wind speed (mph) data showed that the trended values of the wind speed are in intervals rather than the exact numbers. The comparative study showed that the proposed NLSM is quite effective and informative than the existing LSM under classical statistics. Therefore, the proposed NLSM is flexible and more informative than the existing LSM under CS. However, the proposed method has some limitations; it can be used only when the data follow the normal distribution and have imprecise observations. By applying the proposed NLSM, the energy experts can forecast the wind speed under an indeterminate environment. Other time series methods can be developed to analyze the interval data as future research. In addition, the proposed method using Pythagorean fuzzy uncertain environments can be studied as future research; see the work of Wang and Garg (2021).
Data Availability Statement
The original contributions presented in the study are included in the article/Supplementary Material, further inquiries can be directed to the corresponding author.
Author Contributions
MuA and MoA wrote the article.
Conflict of Interest
The authors declare that the research was conducted in the absence of any commercial or financial relationships that could be construed as a potential conflict of interest.
Publisher’s Note
All claims expressed in this article are solely those of the authors and do not necessarily represent those of their affiliated organizations, or those of the publisher, the editors, and the reviewers. Any product that may be evaluated in this article, or claim that may be made by its manufacturer, is not guaranteed or endorsed by the publisher.
Acknowledgments
The authors are deeply thankful to the editor and reviewers for their valuable suggestions to improve the quality and presentation of the article. This work was supported by the Deanship of Scientific Research (DSR) at King Abdulaziz University. The authors, therefore, thank the DSR for their financial and technical support.
References
Abdel-Basset, M., Nabeeh, N. A., El-Ghareeb, H. A., and Aboelfetouh, A. (2019). Utilising Neutrosophic Theory to Solve Transition Difficulties of IoT-Based Enterprises. Enterprise Inf. Syst., 1–21. doi:10.1080/17517575.2019.1633690
Akgül, F. G., and Şenoğlu, B. (2019). Comparison of Wind Speed Distributions: A Case Study for Aegean Coast of Turkey. Energy Sources, Part A: Recovery, Utilization, and Environmental Effects, 1–18. doi:10.1080/15567036.2019.1663309
Ali, S., Lee, S.-M., and Jang, C.-M. (2018). Statistical Analysis of Wind Characteristics Using Weibull and Rayleigh Distributions in Deokjeok-Do Island - Incheon, South Korea. Renew. Energ. 123, 652–663. doi:10.1016/j.renene.2018.02.087
Alrashidi, M., Rahman, S., and Pipattanasomporn, M. (2020). Metaheuristic Optimization Algorithms to Estimate Statistical Distribution Parameters for Characterizing Wind Speeds. Renew. Energ. 149, 664–681. doi:10.1016/j.renene.2019.12.048
Aslam, M. (2020b). Forecasting of the Wind Speed under Uncertainty. Sci. Rep. 10 (1), 20300–20307. doi:10.1038/s41598-020-77280-y
Aslam, M. (2020a). Design of the Bartlett and Hartley Tests for Homogeneity of Variances under Indeterminacy Environment. J. Taibah Univ. Sci. 14 (1), 6–10. doi:10.1080/16583655.2019.1700675
Aslam, M. (2020c). On Detecting Outliers in Complex Data Using Dixon's Test under Neutrosophic Statistics. J. King Saud Univ. - Sci. 32 (3), 2005–2008. doi:10.1016/j.jksus.2020.02.003
Bidaoui, H., Abbassi, I. E., Bouardi, A. E., and Darcherif, A. (2019). Wind Speed Data Analysis Using Weibull and Rayleigh Distribution Functions, Case Study: Five Cities Northern Morocco. Proced. Manufacturing 32, 786–793. doi:10.1016/j.promfg.2019.02.286
Broumi, S., Bakali, A., Talea, M., Smarandache, F., and Selvachandran, G. (2017). Computing Operational Matrices in Neutrosophic Environments: A Matlab Toolbox. Neutrosophic Sets Syst. 18. https://digitalrepository.unm.edu/nss_journal/vol18/iss1/7/.
Chatfield, C., and Xing, H. (2019). The Analysis of Time Series: An Introduction with R. Chapman and Hall/CRC: CRC Press. 414 Pages 85 B/W Illustrations.
Chen, J., Ye, J., and Du, S. (2017a). Scale Effect and Anisotropy Analyzed for Neutrosophic Numbers of Rock Joint Roughness Coefficient Based on Neutrosophic Statistics. Symmetry 9 (10), 208. doi:10.3390/sym9100208
Chen, J., Ye, J., Du, S., and Yong, R. (2017b). Expressions of Rock Joint Roughness Coefficient Using Neutrosophic Interval Statistical Numbers. Symmetry 9 (7), 123. doi:10.3390/sym9070123
Feyrer, J. (2019). Trade and Income-Exploiting Time Series in Geography. Am. Econ. J. Appl. Econ. 11 (4), 1–35. doi:10.1257/app.20170616
Grzegorzewski, P. (2009). K-Sample Median Test for Vague Data. Int. J. Intell. Syst. 24 (5), 529–539. doi:10.1002/int.20345
Grzegorzewski, P., and Śpiewak, M. (2019). The Sign Test and the Signed‐rank Test for Interval‐valued Data. Int. J. Intell. Syst. 34 (9), 2122–2150. doi:10.1002/int.22134
Grzegorzewski, P. (2000). Testing Statistical Hypotheses with Vague Data. fuzzy sets Syst. 112 (3), 501–510. doi:10.1016/s0165-0114(98)00061-x
Harris, P. M., Davis, J. A., Cox, M. G., and Shemar, S. L. (2003). Least-squares Analysis of Time Series Data and its Application to Two-Way Satellite Time and Frequency Transfer Measurements. Metrologia 40 (3), S342–S347. doi:10.1088/0026-1394/40/3/314
Ismail, S., and Shabri, A. (2014). Time Series Forecasting Using Least Square Support Vector Machine for canadian lynx Data. Jurnal Teknologi 70 (5). doi:10.11113/jt.v70.3510
Jebb, A. T., and Tay, L. (2017). Introduction to Time Series Analysis for Organizational Research. Organizational Res. Methods 20 (1), 61–94. doi:10.1177/1094428116668035
Katinas, V., Gecevicius, G., and Marciukaitis, M. (2018). An Investigation of Wind Power Density Distribution at Location with Low and High Wind Speeds Using Statistical Model. Appl. Energ. 218, 442–451. doi:10.1016/j.apenergy.2018.02.163
Kavak Akpinar, E., and Akpinar, S. (2005). A Statistical Analysis of Wind Speed Data Used in Installation of Wind Energy Conversion Systems. Energ. Convers. Manag. 46 (4), 515–532. doi:10.1016/j.enconman.2004.05.002
Khalil, M. A. K., and Moraes, F. P. (1995). Linear Least Squares Method for Time Series Analysis with an Application to a Methane Time Series. J. Air Waste Manag. Assoc. 45 (1), 62–63. doi:10.1080/10473289.1995.10467343
Kosiorowski, D., Rydlewski, J. P., and Snarska, M. (2019). Detecting a Structural Change in Functional Time Series Using Local Wilcoxon Statistic. Stat. Pap. 60 (5), 1677–1698. doi:10.1007/s00362-017-0891-y
Liu, J., Ren, G., Wan, J., Guo, Y., and Yu, D. (2016). Variogram Time-Series Analysis of Wind Speed. Renew. Energ. 99, 483–491. doi:10.1016/j.renene.2016.07.013
Lo Brano, V., Orioli, A., Ciulla, G., and Culotta, S. (2011). Quality of Wind Speed Fitting Distributions for the Urban Area of Palermo, Italy. Renew. Energ. 36 (3), 1026–1039. doi:10.1016/j.renene.2010.09.009
Mahmood, F. H., Resen, A. K., and Khamees, A. B. (2020). Wind Characteristic Analysis Based on Weibull Distribution of Al-Salman Site, Iraq. Energ. Rep. 6, 79–87. doi:10.1016/j.egyr.2019.10.021
McDowall, D., McCleary, R., and Bartos, B. J. (2019). Interrupted Time Series Analysis. Oxford University Press.
Montenegro, M., Casals, M. a. R., Lubiano, M. a. A., and Gil, M. a. A. (2001). Two-sample Hypothesis Tests of Means of a Fuzzy Random Variable. Inf. Sci. 133 (1-2), 89–100. doi:10.1016/s0020-0255(01)00078-0
Nabeeh, N. A., Smarandache, F., Abdel-Basset, M., El-Ghareeb, H. A., and Aboelfetouh, A. (2019). An Integrated Neutrosophic-Topsis Approach and its Application to Personnel Selection: A New Trend in Brain Processing and Analysis. IEEE Access 7, 29734–29744. doi:10.1109/access.2019.2899841
Ozay, C., and Celiktas, M. S. (2016). Statistical Analysis of Wind Speed Using Two-Parameter Weibull Distribution in Alaçatı Region. Energ. Convers. Manag. 121, 49–54. doi:10.1016/j.enconman.2016.05.026
Qing, X. (2018). Statistical Analysis of Wind Energy Characteristics in Santiago Island, Cape Verde. Renew. Energ. 115, 448–461. doi:10.1016/j.renene.2017.08.077
Sezer, O. B., Gudelek, M. U., and Ozbayoglu, A. M. (2020). Financial Time Series Forecasting with Deep Learning : A Systematic Literature Review: 2005-2019. Appl. Soft Comput. 90, 106181. doi:10.1016/j.asoc.2020.106181
Smarandache, F. (2014). Introduction To Neutrosophic Statistics: Infinite Study. doi:10.13140/2.1.2780.1289
Smarandache, F. (2015). Neutrosophic Precalculus And Neutrosophic Calculus: Neutrosophic Applications: Infinite Study. doi:10.6084/M9.FIGSHARE.1574170
Smarandache, F. (2019). Neutrosophic Set Is a Generalization of Intuitionistic Fuzzy Set, Inconsistent Intuitionistic Fuzzy Set (Picture Fuzzy Set, Ternary Fuzzy Set), Pythagorean Fuzzy Set, Spherical Fuzzy Set, and Q-Rung Orthopair Fuzzy Set, while Neutrosophication Is a Generalization of Regret Theory, Grey System Theory, and Three-Ways Decision (Revisited). J. New Theor. (29), 1–31.
Smarandache, F. (1998). Neutrosophy. Neutrosophic Probability, Set, and Logic. Ann Arbor, Michigan, USA: ProQuest Information & Learning, 118–123.
Song, Q., and Chissom, B. S. (1993). Fuzzy Time Series and its Models. fuzzy sets Syst. 54 (3), 269–277. doi:10.1016/0165-0114(93)90372-o
ul Haq, M. A., Rao, G. S., Albassam, M., and Aslam, M. (2020). Marshall-olkin Power Lomax Distribution for Modeling of Wind Speed Data. Energ. Rep. 6, 1118–1123. doi:10.1016/j.egyr.2020.04.033
von Storch, H., and Zwiers, F. (2013). Testing Ensembles of Climate Change Scenarios for “Statistical Significance”. Climatic Change 117 (1-2), 1–9. doi:10.1007/s10584-012-0551-0
Wang, L., and Garg, H. (2021). Algorithm for Multiple Attribute Decision-Making with Interactive Archimedean Norm Operations under Pythagorean Fuzzy Uncertainty. Int. J. Comput. Intell. Syst. 14 (1), 503–527. doi:10.2991/ijcis.d.201215.002
Wang, S., Zhang, Y., Waring, M., and Lo, L. J. (2018). Statistical Analysis of Wind Data Using Weibull Distribution for Natural Ventilation Estimation. Sci. Techn. Built Environ. 24 (9), 922–932. doi:10.1080/23744731.2018.1432936
Yang, F., Li, M., Huang, A., and Li, J. (2014). Forecasting Time Series with Genetic Programming Based on Least Square Method. J. Syst. Sci. Complex 27 (1), 117–129. doi:10.1007/s11424-014-3295-2
Keywords: wind speed, least square method, indeterminacy, forecasting, trend, neutrosophy
Citation: Aslam M and Albassam M (2022) Forecasting of Wind Speed Using an Interval-Based Least Square Method. Front. Energy Res. 10:896217. doi: 10.3389/fenrg.2022.896217
Received: 14 March 2022; Accepted: 29 March 2022;
Published: 29 April 2022.
Edited by:
Mohamed Mohamed, Umm al-Qura University, Saudi ArabiaReviewed by:
Said Broumi, University of Hassan II Casablanca, MoroccoFlorentin Smarandache, University of New Mexico, United States
Yanhui Guo, University of Illinois at Springfield, United States
Copyright © 2022 Aslam and Albassam. This is an open-access article distributed under the terms of the Creative Commons Attribution License (CC BY). The use, distribution or reproduction in other forums is permitted, provided the original author(s) and the copyright owner(s) are credited and that the original publication in this journal is cited, in accordance with accepted academic practice. No use, distribution or reproduction is permitted which does not comply with these terms.
*Correspondence: Muhammad Aslam, YXNsYW1fcmF2aWFuQGhvdG1haWwuY29t
 Muhammad Aslam
 Mohammed Albassam