
95% of researchers rate our articles as excellent or good
Learn more about the work of our research integrity team to safeguard the quality of each article we publish.
Find out more
ORIGINAL RESEARCH article
Front. Energy Res. , 08 June 2022
Sec. Bioenergy and Biofuels
Volume 10 - 2022 | https://doi.org/10.3389/fenrg.2022.894875
This article is part of the Research Topic Integrated Waste Biorefineries: Achieving Sustainable Development Goals View all 11 articles
 Hafiz Muhammad Uzair Ayub1†
 Muhammad Rafiq2†
 Muhammad Abdul Qyyum3
 Ghazala Rafiq2
 Gyu Sang Choi2*
 Moonyong Lee1*
Alternative renewable fuels like biomass have the potential to be considered for electricity generation by replacing the utilization of fossil fuels and reducing the greenhouse gas emissions into the environment. An integrated biomass gasification power plant is the best suitable option to generate electricity from different biomass feedstocks. Several modeling and simulation techniques have been utilized for the integrated biomass gasification power generation process. These models are utilized to predict the power output from the different gasifier types, designs, and feedstocks. In this study, An Artificial neural network (ANN) model is developed to estimate the process parameters of the Integrated biomass gasification power plant. This ANN model predicts the gasification temperature (T) and air to fuel ratio (AFR) for the gasification process integrated with the power plant at the atmospheric pressure. There is a total of ten input parameters such as moisture content of biomass (M), volatile matter (VM), fixed carbon (FC), ash content (A), element composition of carbon (C), oxygen (O), hydrogen (H), nitrogen (N), sulfur (S) and required power (KW) are used to predict the two key gasification process parameters T and AFR. The data generated from thermodynamic equilibrium model simulations are employed in the developed ANN model for the different 86 biomass feedstocks. The proposed ANN model was optimized for the Mean Squared Error (MSE) loss function and evaluated using MSE and R score metrics. It is observed that the best predicted for a hidden layer size was of 60 neurons. The best test score was achieved as an MSE score of 1,497 and test R 0.9976. This study can be implemented for any kind of biomass feedstock for the power generation system.
In recent decades, the global energy demand and consumption have increased due to the rapid increase in population and industrial developments, which have also raised environmental issues worldwide (Hanchate et al., 2021). Fossil fuels provide about 80% of the world’s overall total energy needs that cause significant environmental and health problems (Iea, 2011). Various energy sources, including renewable and non-renewable, are being taken into consideration to help meet the world’s energy demand and environmental issues (Anwar et al., 2021; Kanwal et al., 2021). Combustion of primary conventional fossil fuel-based energy sources is the leading cause of pollutant emissions into the environment. Renewable energy options have the great potential to overcome emission problems of carbon-based energy systems to produce environmentally friendly clean fuels (Mofijur et al., 2013b; Sansaniwal et al., 2017). Biomass is considered one of the most suitable alternative energy resources of green energy that has the great potential to generate renewable energy in the form of electricity, bio-oil (biodiesel), biohydrogen, and biogas (Mofijur et al., 2013a; AlNouss et al., 2020; Ayub et al., 2022). Thermochemical and biochemical technologies are being adopted mainly to produce biofuels from biomass conversion (Wahlen et al., 2020; Tawfik et al., 2021). The former technologies are more efficient as compared to the biochemical technologies due to the fast reaction time and high energy efficiency (Sansaniwal et al., 2017). The biomass gasification process is one of the most suitable thermochemical conversion methods to produce the energy from the various biomass feedstocks for the different integrated energy systems (Ayub et al., 2021).
Biomass gasification is recognized as a sustainable conversion method since it produces clean syngas for effective heat and power generation and utilization while emitting comparatively less amount of pollutants (Mofijur et al., 2013a; Nguyen et al., 2020). The syngas formed from biomass gasification mainly consists of hydrogen (H2), carbon monoxide (CO), carbon dioxide (CO2), water (H2O) vapors, methane (CH4), and nitrogen (N2) (Ayub et al., 2020a). During the gasification process, some minor products such as tar, solid char, nitrogen, and Sulphur compounds such as NOx and SOx can be seen alongside the primary components of syngas (Karmann et al., 2019). The high composition of H2, low content of N2, the minimal amount of impurities and contaminants, and high heating value (HHV) of the syngas can all be used to determine their suitability for use in thermal combustion systems for power production (Gambarotta et al., 2018).
The biomass gasification process is divided into four steps due to the apparent complexity of the chemical processes involved: biomass drying, pyrolysis, oxidation, and reduction (Mohapatra and Phale, 2021). The biomass feedstock is heated in the first step at a very low-temperature range (100°–150°C) to remove the moisture contents. At the second step, this feedstock is heated at high temperatures (150°–700°C), the pyrolysis phase, and turned into volatile and solid carbon-rich components, commonly called char or unconverted byproducts. At this point, a high viscosity black liquid called tar is formed that contains heavy components of organic and inorganic materials. Finally, the gasifier undergoes oxidation and reduction reactions, converting solid char, heavy organic, and volatile components into syngas at extremely high temperatures (800°–1,100°C) (Ayub et al., 2020b). The biomass gasification process and stages involved are schematized in Figure 1.
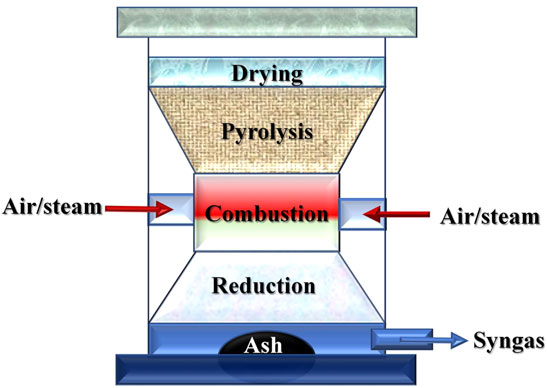
FIGURE 1. A schematic of downdraft gasifier.
Many researchers have presented studies for the efficiency improvement of the biomass gasification process. The biomass properties, reactor design, and operational conditions are the key factors that determine gasifier efficiency, product gas composition, and overall system effectiveness in the gasification process. Moisture content (MC), volatile matter (VM), ash (A), fixed carbon (FC), and elemental composition of organic and inorganic components are all the key components that influence feedstock characteristics (Ferreira et al., 2019). Inside the gasifier, exceedingly complex thermochemical processes have also been observed. As a result, experimentation could provide practical information about the optimum process parameters and appropriate feedstock of selected biomass for the reactor, but they take a lot of time and are more expensive than modeling (Binns and Ayub, 2021). When it comes to numerical modeling, Biomass gasification models are divided into kinetic-based models (Inayat et al., 2012), computational fluid dynamic (CFD) models (Liu, 2014), thermodynamic equilibrium models (Zainal et al., 2001), and artificial neural network (ANN) models (Li et al., 2019). There is also a research dimension making progress in resolving CFD model to predict via machine learning using physics informed neural networks (Rafiq et al., 2022a; Rafiq et al., 2022b), that has the potential to make CFD predictions tasks faster from days to just seconds.
Kinetic models have been formulated on the basis of the reaction kinetics taking place within the reactors. Consequently, formulating more realistic models requires a detailed understanding of gasification processes and phase conversion transfer mechanisms. These models have the ability to estimate syngas gas composition, the temperature of the reactor, and gasification efficiency (Dang et al., 2021). CFD models are more complicated as compared to the kinetic and thermodynamic modeling approaches because they require a very long computing time and comprehensive knowledge about the reactions involved. Comprehensive numerical evaluations of feedstock components, mechanism of fluid flow, mass and energy transport, chemical expressions, particle structure and dimensions, and a set of parametric correlations and equations were accomplished employing CFD models. Various previous studies concentrated on equilibrium models, artificial neural networks, and other empirical or semi-empirical models that allow for quick computation, parametric analysis, and optimization of the gasification process to avoid the complexity and errors accompanying kinetic and CFD models (Kumar and Paul, 2019). Thermodynamic equilibrium models are categorized into stoichiometric and non-stoichiometric equilibrium models (Zainal et al., 2001). These models are based on the equilibrium constants of the gasification reactions involved, or the composition of syngas is calculated based on the Gibbs free energy minimization method. These models are simpler and provide faster computation than the kinetic and CFD models (Ayub et al., 2021). ANN models are developed based on the mathematical principles that correlate the input and output streams to predict the required output. An ANN model impersonates the functioning of the human brain to process the data quickly and effectively based on a system of neural networks provided to the model some human attributes. The application of ANN models for the biomass gasification process or integrated power generation system is very limited. Generally, input data set of ultimate and proximate analysis or process parameters are required to predict the outcomes. Hence, these models are more appropriate as compared to complex reaction-based problems. These models can be applied to the different types of reactor configurations (Li et al., 2018). Yucel et al. (2019) employed the ANN networks to estimate the gasification product gas composition from the biomass gasification process data. Li et al. (2018) presented a study based on the ANN model for the biomass gasification processes considering the heating rate and reactor length to predict the hydrogen composition. However, ANN models are not very attractive options for biomass gasification processes or integrated power generation systems due to the limitation of experimental data. Safarian et al.(2020a) developed the ANN model for power generation, and the data is generated from the integrated thermodynamic equilibrium model. They predicted the net power output from various biomass feedstocks under the equilibrium conditions.
In this study, an ANN model is developed and implemented for an integrated thermodynamic equilibrium power generation system to predict the required power’s critical influencing gasification process parameters that have not been predicted before through ANN. This study aims to estimate the process conditions like gasification temperature (T) and air to fuel ratio (AFR) through ANN model development by using 86 different biomass samples for the larger dataset of 1,032 observations. Moreover, this developed ANN model was tested and validated against the original data set, which has shown the effective utilization of the ANN model for the integrated biomass gasification power generation system to predict the critical process parameters. The model is optimized using the Mean Squared Error (MSE) loss function and evaluated our proposed model using two evaluation metrics, i.e., MSE and R score, using a hidden layer with 60 neurons. This model can be used for any kind of biomass feedstocks for the integrated power generation system.
This article is organized in the following sections. The proposed method is detailed in Section 2, whereas results and discussion are covered in Section 3. In the final section of the article, the conclusion of the study has been presented.
Artificial Neural Network (ANN) (McCulloch and Pitts, 1943) is proposed to estimate the parameters of the biomass gasification system. The proposed model consists of an input layer, a hidden layer, and an output layer. The following sections cover the details of each component in detail.
The ANN model is developed based on the thermodynamic equilibrium model simulated with ASPEN Plus integrated power generation systems. There are 1,032 data points of 86 different biomass feedstocks utilized in the ASPEN Plus model to estimate the power generation for the specific operating conditions (Safarian et al., 2020a; Safarian et al., 2020b). In this study, an ANN model for the downdraft biomass gasification process integrated with a power generation system is developed to estimate operating conditions-gasification temperature (T) and air to fuel ratio (AFR)- for the required power output. This ANN model is developed and implemented in MATLAB utilizing Neural Network Toolbox, as shown in Figure 2.
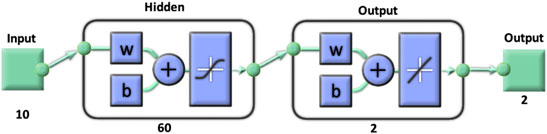
FIGURE 2. Matlab ANN setup and configuration.
Figure 3 presents the structure of the developed ANN model to predict operating conditions such as gasification temperature (T) and air to fuel ratio (AFR). All the ANN schemes have only one input layer containing ten input variables: moisture content (M), volatile matter (VM), fixed carbon (FC), Ash content (A), the elemental composition of carbon (C), oxygen (O), hydrogen (H), nitrogen (N), sulfur (S) and power (KW) produced and one hidden layer and one output layer containing process parameters or operating conditions that are gasification temperature (T) and air to fuel ratio (AFR).
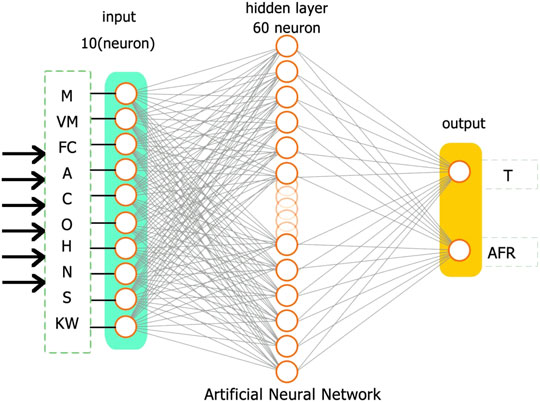
FIGURE 3. ANN model architecture to estimate the process parameters for the integrated downdraft biomass gasification process with a power generation system.
We employ one hidden layer employed empirically, considering the size and complexity of the dataset. We conducted various experiments with hidden layer sizes and reported the observations explained in the results section. The best selection of model consisted of the hidden layer size of 60 neurons. Therefore, we have considered a single hidden layer with varying nodes from 10 to 120. The model early stopped at various epochs for various hidden layer sizes to keep from overfitting. We recorded epochs and obtained Mean Squared Error (MSE). The layer configuration is listed in Table 1.
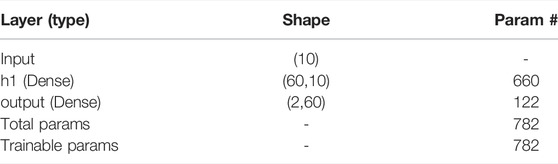
TABLE 1. Proposed model layer configuration.
Machine Learning classifiers usually support only one target variable. Regression models have a real value target, while classification models have a binary or multivalued target. The multiple regression model is one in which multiple independent variables are used to predict a dependent variable. Multi-target regression (Reyes and Ventura, 2019) is the term used when there are multiple dependent variables. If the target variables are categorical, then it is called multi-label or multi-target classification, and if the target variables are numeric, then multi-target (or multi-output) regression is the name commonly used.
The Rectified Linear Unit (ReLU) (Agarap, 2018) is an activation function for tensor output and makes the model training process nonlinear. In the convolution process, output tensors may contain positive and negative values, so before forwarding the output to the next layer, an activation function is applied. Positive values of ReLU remain unchanged, while negative values are converted to 0 values. The procedure is called rectification. From a range of negative and positive values, a non-saturating function
For a specific neuron at x and y positions, X (x, y) is the input to ReLU, and Y (x, y) is the output of ReLU activation.
Our network is fed by the ten best input parameters, including M, VM, FC, A, C, O, H, N, S, and KW, while T and AFR are output parameters. First, the data are normalized by limiting the values to 0 and 1. Following normalization, 80% of the data were allocated for training, 10% for validation, and 10% for testing and evaluation. . For training data selection, we used the hold-out (Sammut and Webb, 2011) strategy.
A maximum of 500 training epochs were used to train the model. The training system was configured to stop when there is no further improvement to using an early stopping (Prechelt, 1998) technique with early-stopping patience of ten epochs. Levenberg-Marquardt optimizer (Moré, 1978) with a learning rate of 0.001 was used. Performance was optimized based on the choice of learning rate. Then, we optimized MSE as a loss function during training, which is a metric for regression prediction systems. A complete list of simulation parameters is listed in Table 2.
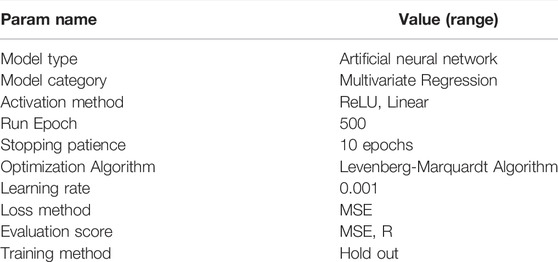
TABLE 2. Simulation parameters.
The dataset consists of 1,032 experiments recorded for 86 feedstock available from (Safarian et al., 2020a). We conduct exploratory data analysis of the values from the experiments for more insights about the data. Table 3 lists down the dataset statistics for each input component: M, VM, FC, A, C, O, H, N, and S, as well as precondition adjustment parameters: T and AFR.
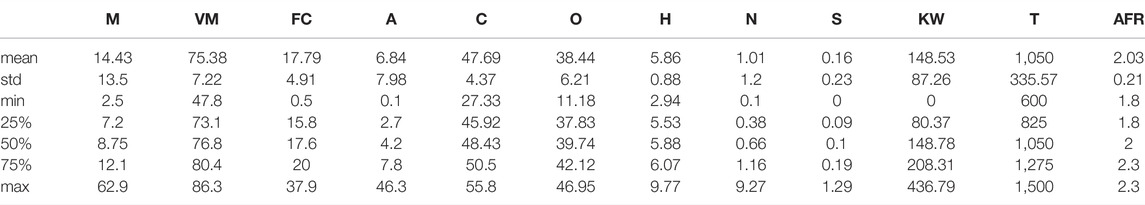
TABLE 3. Dataset statistics.
Figure 4 depicts the inter-parameter correlation density. The parameter correlation matrix shows the correlation between each pair of parameters. The parameter correlation is measured before the task execution. A strong correlation exhibits a high degree of dependency of input parameters on each other. To best understand the relation between parameters, we compute the inter-parameter correlation heatmap as presented in Figure 5.
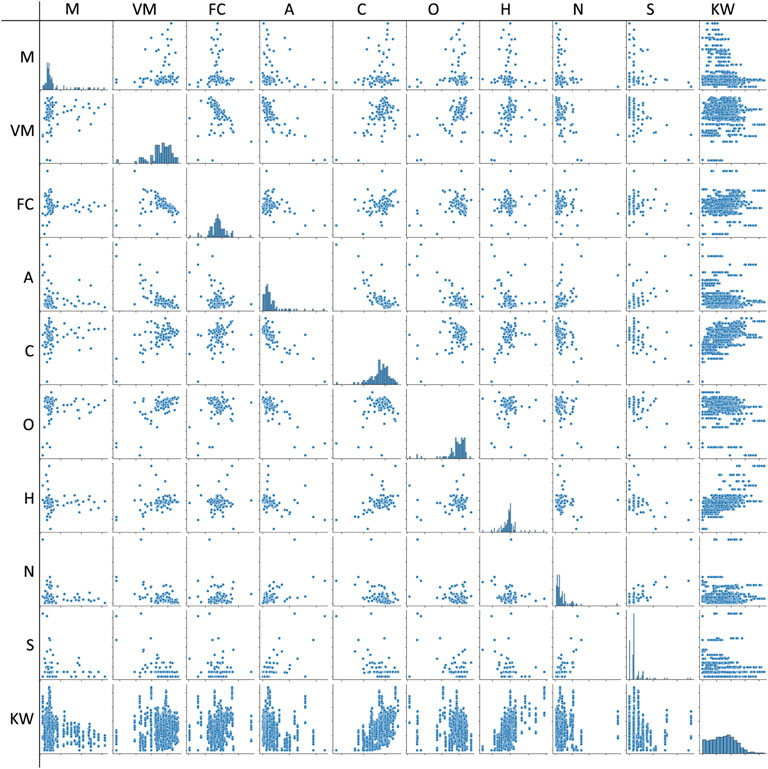
FIGURE 4. Dataset inter-parameters correlation.
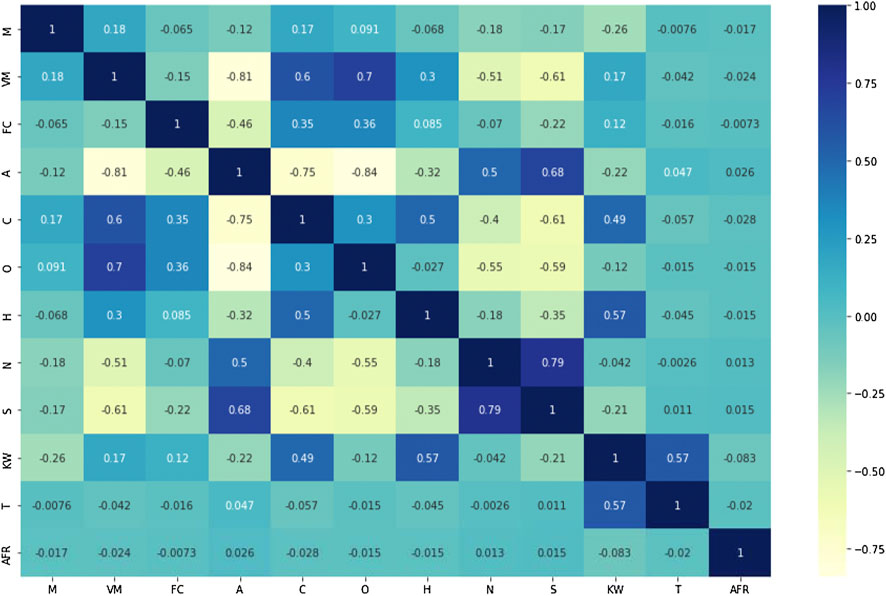
FIGURE 5. Parameter correlation heatmap.
A Mean Squared Error (MSE) (Sammut and Webb, 2011) and R score (Ribas et al., 2013) were used to evaluate the proposed model. The evaluation metrics are expressed in the following equations.
The values of
A model performance evaluation is presented in Table 4. As the model is optimized to minimize MSE loss, we compute train and test set metrics to show overfitting and bias. The applied dataset showed excellent performance. The scatter plot in Figure 7 compares predicted values with actual test values. Testing, validation, and training plots showed a significantly stable output with minor outlier predictions, whereas most of the data were predicted correctly and followed the optimal line.
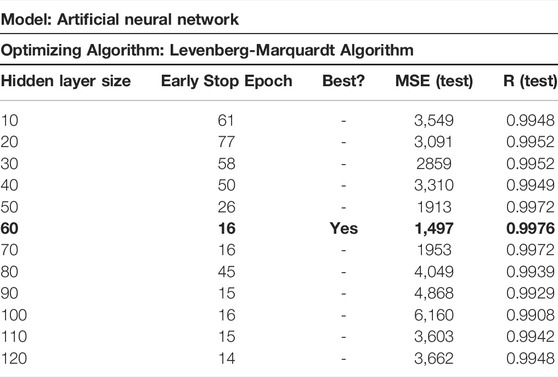
TABLE 4. MSE loss at various neurons at the hidden layer. Bold values represent the best configuration for the model.
Table 4 shows the test MSE and R score for various hidden layer sizes. We observe that the given observation is best predicted for a hidden layer size of 60 neurons. The best score achieved reads as a test MSE score of 1,497 and test R 0.9976. Therefore, we recommend a network size of 60 neurons at the hidden layer. Figure 6 graphically plots the loss behavior for different neurons at the hidden layer.
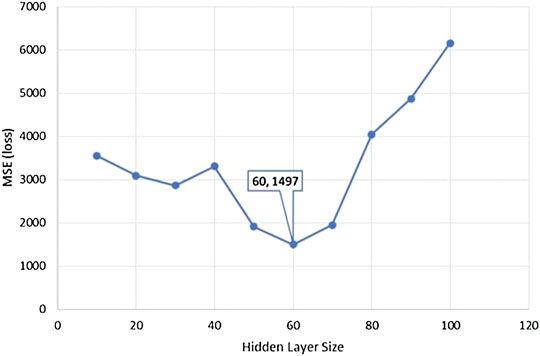
FIGURE 6. Loss plot at various number of neurons at the hidden layer.
We trained the model using a dataset split of 80% training, 10% validation, and 10% test set. We collected loss plots for each of the splits, as shown in Figure 7. Here (A) represents the training split, (B) depicts the validation split scatter plot, and (C) shows the test split performance. All of the split plots were generated at an optimal layer size of 60 neurons with dataset splits described earlier in this section.

FIGURE 7. Scatter plot for (A) training (B) validation, and (C) test dataset distributions.
The proposed model training, validation, and test performances are depicted in Figure 8. Where (A) plots the MSE loss over running epochs, it is evident that the model performed a smooth training without any overfitting and underfitting. Similarly, (B) depicts the error histogram with 20 bins, where sample instances are the highest concentration peak at zero with a small error spread.
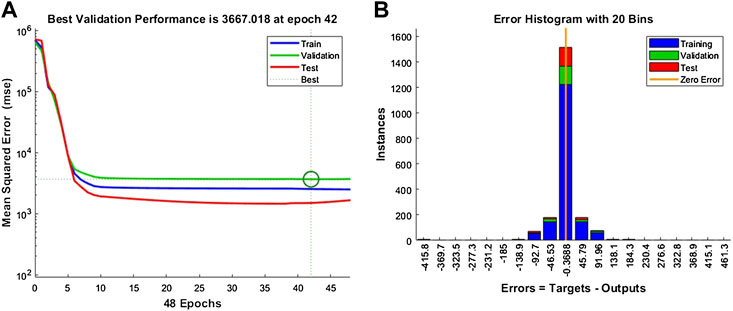
FIGURE 8. (A) Training history and (B) error histogram.
The performance of the developed model is measured using standard performance metrics, i.e., MSE and R score. It is evident that the proposed model fits the presented data and estimates the process parameters. We record the bias and weights of the best-performing model in Supplementary Table S1 with a bi-color heatmap for the quick perception of the model states.
The dataset employed is obtained by using the ASPEN Plus process simulator which is widely used for near-perfect process parameters and production environment simulations. Data reliability is highly dependent on experiments conducted to generate data and the process design and conditions. Since the dataset is peer-reviewed in a recent research article (Safarian et al., 2020a; Safarian et al., 2020b) therefore, we consider it safe to believe the reliability. We use actual data for training and validation, and we have tested our predictions on a subset of actual data separated using the holdout model evaluation method.
The ANN models are historically known to perform best when sufficient data is present, whereas physical sciences lack experimental data due to the nature of experiments and the efforts required in collecting the data. Inspired by evolving influence and successful track record of artificial intelligence and machine learning in physical sciences, we have introduced the proposed model. We expect this approach to be more progressive and succeed by employing larger datasets and trying new approaches. Our proposed has significant benefits over the conventional physical science experimental approach to predict process parameters without trivial experiments for new materials. This approach makes it more useful in further study of biomass gasification for power generation and a good start for the production environment to try starting parametric conditions of temperature and air to fuel ratio. The recommended parameters from the model can save setup time and materials and reduce overheads in initializing an integrated gasification process for power generation.
An ANN model is developed for the integrated biomass gasification power plant in this study. Gasification temperature (T) and air to fuel ratio are the two key process parameters that influence the efficiency of the gasification process and the power output. Therefore, an ANN model is proposed to predict these process parameters to increase the efficiency of the integrated biomass gasification power generation system. For this purpose, 1,032 simulated data points for the 86 biomass feedstocks are used to develop, train, test, and validate the developed ANN Model. In this model, 80% of the data were allocated for training, 10% for validation, and 10% for testing and evaluation. It is observed that the given observation is best predicted for a hidden layer size of 60 neurons. The best test score was achieved as an MSE score of 1,497 and test R 0.9976. Therefore, we recommend a network size of 60 neurons at the hidden layer. We further suggest to employ the proposed approach for pre assessment of process parameters to quick start the biomass gasification production process. The model intend to increase the productivity and save the fuel and time to smoothen out the biomass gasification production.
Publicly available datasets were analyzed in this study. This data can be found here: https://www.sciencedirect.com/science/article/pii/S2352340920312701.
HA: Data collection, conceptualization, methodology, investigation, writing—original draft, software. MR: Data collection, conceptualization, methodology, investigation, writing—original draft, software. MQ: Formal analysis, writing—review and editing, GR: Writing—review and editing. GC: Supervision, writing—review and editing. ML: Supervision, writing—review and editing.
This work was supported by the 2021 Yeungnam University Research Grant, and by Priority Research Centers Program through the National Research Foundation of Korea (NRF) funded by the Ministry of Education (2014R1A6A1031189), and in part by the Basic Science Research Program through the National Research Foundation of Korea (NRF) funded by the Ministry of Education under Grant NRF-2019R1A2C1006159 and Grant NRF-2021R1A6A1A03039493.
The authors declare that the research was conducted in the absence of any commercial or financial relationships that could be construed as a potential conflict of interest.
All claims expressed in this article are solely those of the authors and do not necessarily represent those of their affiliated organizations, or those of the publisher, the editors and the reviewers. Any product that may be evaluated in this article, or claim that may be made by its manufacturer, is not guaranteed or endorsed by the publisher.
The Supplementary Material for this article can be found online at: https://www.frontiersin.org/articles/10.3389/fenrg.2022.894875/full#supplementary-material
Supplementary Table S1 | The bias and weights recorded for best performing model.
Agarap, A. F. (2018). Deep Learning Using Rectified Linear Units (Relu). arXiv preprint arXiv:1803.08375.
AlNouss, A., McKay, G., and Al-Ansari, T. (2020). A Comparison of Steam and Oxygen Fed Biomass Gasification through a Techno-Economic-Environmental Study. Energy Convers. Manag. 208, 112612. doi:10.1016/j.enconman.2020.112612
Anwar, A., Siddique, M., Eyup Dogan, D., and Sharif, A. (2021). The Moderating Role of Renewable and Non-renewable Energy in Environment-Income Nexus for ASEAN Countries: Evidence from Method of Moments Quantile Regression. Renew. Energy 164, 956–967. doi:10.1016/j.renene.2020.09.128
Ayub, H. M., Park, S. J., and Binns, M. (2020a). Biomass to Syngas: Modified Non-stoichiometric Thermodynamic Models for the Downdraft Biomass Gasification. Energies 13 (21), 5668. doi:10.3390/en13215668
Ayub, H. M., Park, S. J., and Binns, M. (2020b). Biomass to Syngas: Modified Stoichiometric Thermodynamic Models for Downdraft Biomass Gasification. Energies 13 (20), 5383. doi:10.3390/en13205383
Ayub, H. M. U., Qyyum, M. A., Qadeer, K., Binns, M., Tawfik, A., and Lee, M. (2021). Robustness Enhancement of Biomass Steam Gasification Thermodynamic Models for Biohydrogen Production: Introducing New Correction Factors. J. Clean. Prod. 321, 128954. doi:10.1016/j.jclepro.2021.128954
Ayub, H. M. U., Ahmed, A., Lam, S. S., Lee, J., Show, P. L., and Park, Y.-K. (2022). Sustainable Valorization of Algae Biomass via Thermochemical Processing Route: An Overview. Bioresour. Technol. 344, 126399. doi:10.1016/j.biortech.2021.126399
Binns, M., and Ayub, H. M. (2021). Model Reduction Applied to Empirical Models for Biomass Gasification in Downdraft Gasifiers. Sustainability 13 (21), 12191. doi:10.3390/su132112191
Dang, Q., Zhang, X., Zhou, Y., and Jia, X. (2021). Prediction and Optimization of Syngas Production from a Kinetic-Based Biomass Gasification Process Model. Fuel Process. Technol. 212, 106604. doi:10.1016/j.fuproc.2020.106604
Ferreira, S., Monteiro, E., Brito, P., and Vilarinho, C. (2019). A Holistic Review on Biomass Gasification Modified Equilibrium Models. Energies 12 (1), 160. doi:10.3390/en12010160
Gambarotta, A., Morini, M., and Zubani, A. (2018). A Non-stoichiometric Equilibrium Model for the Simulation of the Biomass Gasification Process. Appl. Energy 227, 119–127. doi:10.1016/j.apenergy.2017.07.135
Hanchate, N., Ramani, S., Mathpati, C. S., and Dalvi, V. H. (2021). Biomass Gasification Using Dual Fluidized Bed Gasification Systems: A Review. J. Clean. Prod. 280, 123148. doi:10.1016/j.jclepro.2020.123148
Inayat, A., Ahmad, M. M., Mutalib, M. I. A., and Yusup, S. (2012). Process Modeling for Parametric Study on Oil Palm Empty Fruit Bunch Steam Gasification for Hydrogen Production. Fuel Process. Technol. 93 (1), 26–34. doi:10.1016/j.fuproc.2011.08.014
Kanwal, F., Ahmed, A., Jamil, F., Rafiq, S., Ayub, H. M. U., Ghauri, M., et al. (2021). Co-Combustion of Blends of Coal and Underutilised Biomass Residues for Environmental Friendly Electrical Energy Production. Sustainability 13 (9). doi:10.3390/su13094881
Karmann, S., Panke, S., and Zinn, M. (2019). Fed-Batch Cultivations of Rhodospirillum Rubrum under Multiple Nutrient-Limited Growth Conditions on Syngas as a Novel Option to Produce Poly(3-Hydroxybutyrate) (PHB). Front. Bioeng. Biotechnol. 7, 59. doi:10.3389/fbioe.2019.00059
Kumar, U., and Paul, M. C. (2019). CFD Modelling of Biomass Gasification with a Volatile Break-Up Approach. Chem. Eng. Sci.. 195, 413–422. doi:10.1016/j.ces.2018.09.038
Li, Y., Yan, L., Yang, B., Gao, W., and Farahani, M. R. (2018). Simulation of Biomass Gasification in a Fluidized Bed by Artificial Neural Network (ANN). Energy Sources, Part A Recovery, Util. Environ. Eff. 40 (5), 544–548. doi:10.1080/15567036.2016.1270372
Li, Y., Yang, B., Yan, L., and Gao, W. (2019). Neural Network Modeling of Biomass Gasification for Hydrogen Production. Energy Sources, Part A Recovery, Util. Environ. Eff. 41 (11), 1336–1343. doi:10.1080/15567036.2018.1548512
McCulloch, W. S., and Pitts, W. (1943). A Logical Calculus of the Ideas Immanent in Nervous Activity. Bull. Math. Biophysics 5 (4), 115–133. doi:10.1007/bf02478259
Mofijur, M., Atabani, A. E., Masjuki, H. H., Kalam, M. A., and Masum, B. M. (2013a). A Study on the Effects of Promising Edible and Non-edible Biodiesel Feedstocks on Engine Performance and Emissions Production: A Comparative Evaluation. Renew. Sustain. Energy Rev. 23, 391–404. doi:10.1016/j.rser.2013.03.009
Mofijur, M., Masjuki, H. H., Kalam, M. A., and Atabani, A. E. (2013b). Evaluation of Biodiesel Blending, Engine Performance and Emissions Characteristics of Jatropha Curcas Methyl Ester: Malaysian Perspective. Energy 55, 879–887. doi:10.1016/j.energy.2013.02.059
Mohapatra, B., and Phale, P. S. (2021). Microbial Degradation of Naphthalene and Substituted Naphthalenes: Metabolic Diversity and Genomic Insight for Bioremediation. Front. Bioeng. Biotechnol. 9, 144. doi:10.3389/fbioe.2021.602445
Moré, J. J. (1978). The Levenberg-Marquardt Algorithm: Implementation and Theory. Numerical Analysis, Berlin, Heidelberg: Springer, 105–116. doi:10.1007/bfb0067700
Nguyen, Q. A., Smith, W. A., Wahlen, B. D., and Wendt, L. M. (2020). Total and Sustainable Utilization of Biomass Resources: a Perspective. Front. Bioeng. Biotechnol. 8, 546. doi:10.3389/fbioe.2020.00546
Prechelt, L. (1998). Early Stopping - but when? Neural Networks: Tricks of the trade. Springer, 55–69. doi:10.1007/3-540-49430-8_3
Rafiq, M., Rafiq, G., and Choi, G. S. (2022a). DSFA-PINN: Deep Spectral Feature Aggregation Physics Informed Neural Network. IEEE Access 10, 22247-22259. doi:10.1109/access.2022.3153056
Rafiq, M., Rafiq, G., Jung, H.-Y., and Choi, G. S. (2022b). SSNO: Spatio-Spectral Neural Operator for Functional Space Learning of Partial Differential Equations. IEEE Access 10, 15084-15095. doi:10.1109/access.2022.3148401
Reyes, O., and Ventura, S. (2019). Performing Multi-Target Regression via a Parameter Sharing-Based Deep Network. Int. J. Neur. Syst. 29 (09), 1950014. doi:10.1142/s012906571950014x
Ribas, S., Ribeiro-Neto, B., and Ziviani, N. (2013) R-score: Reputation-Based Scoring of Research Groups. arXiv preprint arXiv:1308.5286.
Safarian, S., Ebrahimi Saryazdi, S. M., Unnthorsson, R., and Richter, C. (2020a). Artificial Neural Network Integrated with Thermodynamic Equilibrium Modeling of Downdraft Biomass Gasification-Power Production Plant. Energy 213, 118800. doi:10.1016/j.energy.2020.118800
Safarian, S., Saryazdi, S. M. E., Unnthorsson, R., and Richter, C. (2020b). Dataset of Biomass Characteristics and Net Output Power from Downdraft Biomass Gasifier Integrated Power Production Unit. Data brief 33, 106390. doi:10.1016/j.dib.2020.106390
Sammut, C., and Webb, G. I. (2011). Encyclopedia of Machine learning. Berlin: Springer Science Business Media.
Sansaniwal, S. K., Pal, K., Rosen, M. A., and Tyagi, S. K. (2017). Recent Advances in the Development of Biomass Gasification Technology: A Comprehensive Review. Renew. Sustain. Energy Rev. 72, 363–384. doi:10.1016/j.rser.2017.01.038
Tawfik, A., Moanis, R., Qyyum, M. A., Kumari, S., Bux, F., Uzair Ayub, H. M., et al. (2021). Sustainable Fermentation Approach for Biogenic Hydrogen Productivity from Delignified Sugarcane Bagasse. Int. J. Hydrogen Energy. doi:10.1016/j.ijhydene.2021.09.200
Wahlen, B. D., Wendt, L. M., Murphy, A., Thompson, V. S., Hartley, D. S., Dempster, T., et al. (2020). Preservation of Microalgae, Lignocellulosic Biomass Blends by Ensiling to Enable Consistent Year-Round Feedstock Supply for Thermochemical Conversion to Biofuels. Front. Bioeng. Biotechnol. 8, 316. doi:10.3389/fbioe.2020.00316
Yucel, O., Aydin, E. S., and Sadikoglu, H. (2019). Comparison of the Different Artificial Neural Networks in Prediction of Biomass Gasification Products. Int. J. Energy Res. 43 (11), 5992–6003. doi:10.1002/er.4682
Keywords: biomass gasification, power generation, artificial neural network, parameter prediction, logistic regression
Citation: Ayub HMU, Rafiq M, Qyyum MA, Rafiq G, Choi GS and Lee M (2022) Prediction of Process Parameters for the Integrated Biomass Gasification Power Plant Using Artificial Neural Network. Front. Energy Res. 10:894875. doi: 10.3389/fenrg.2022.894875
Received: 12 March 2022; Accepted: 10 May 2022;
Published: 08 June 2022.
Edited by:
Md Mofijur Rahman, University of Technology Sydney, AustraliaReviewed by:
Bheru Lal Salvi, Maharana Pratap University of Agriculture and Technology, IndiaCopyright © 2022 Ayub, Rafiq, Qyyum, Rafiq, Choi and Lee. This is an open-access article distributed under the terms of the Creative Commons Attribution License (CC BY). The use, distribution or reproduction in other forums is permitted, provided the original author(s) and the copyright owner(s) are credited and that the original publication in this journal is cited, in accordance with accepted academic practice. No use, distribution or reproduction is permitted which does not comply with these terms.
*Correspondence: Gyu Sang Choi, Y2FzdGNob2lAeW51LmFjLmty; Moonyong Lee, bXlubGVlQHl1LmFjLmty
†These authors have contributed equally to this work and share the first authorship
Disclaimer: All claims expressed in this article are solely those of the authors and do not necessarily represent those of their affiliated organizations, or those of the publisher, the editors and the reviewers. Any product that may be evaluated in this article or claim that may be made by its manufacturer is not guaranteed or endorsed by the publisher.
Research integrity at Frontiers
Learn more about the work of our research integrity team to safeguard the quality of each article we publish.