- 1College of Water Resources and Civil Engineering, China Agricultural University, Beijing, China
- 2Beijing Engineering Research Centre of Safety and Energy Saving Technology for Water Supply System, Beijing, China
A partially averaged Navier–Stokes method with a new expression of fk based on the rotation-corrected energy spectrum is proposed. It is coupled with the shear-stress transport turbulence model to simulate two typical rotating flows: rotating channel flow and flow in a centrifugal pump impeller. The results of two traditional energy spectrum-based fk expressions (ES1 and ES2) and DNS/experimental results are used for comparison. The results show that the fk distribution predicted based on the rotation-corrected energy spectrum is more reasonable. In the region with enhanced turbulence, more turbulence scales exist, such as the pressure side in the rotating channel flow, where the fk value is low and more turbulence scales are resolved. While in the region with suppressed turbulence, fewer turbulence scales exist, such as the suction side, where the fk value is relatively high. The model with a new fk expression can produce better results since it can give a more reasonable fk distribution. At the same time, the new model is more efficient since it shows better calculation performance with the same mesh scale and low cost with comparable calculation performance.
Introduction
Rotating machinery, such as pumps and turbines, is widely used in engineering practice (Thangam et al., 1999), and their internal flow has large curvature and high rotation speed characteristics. These flow characteristics that play an important role in the performance need to be investigated in-depth (Huang X. et al., 2019), and the relationship between the external characteristics of the centrifugal pump and the internal flow state needs further study (Lin et al., 2022). For internal flow investigation, the computational fluid dynamics (CFD) method plays an efficient and reliable role in the simulation of complex flows (Zhang et al., 2020). In CFD, the Navier–Stokes equation is a mathematical expression that can adequately describe the motion of fluids. The direct numerical simulation (DNS) method concerns the direct application of this equation; thus, it can solve all turbulent flow fields. Nevertheless, according to Kolmogorov’s theory (Pope, 2000), when the DNS method is used, the length scale
Girimaji et al. (2003) proposed the PANS method, which is based on the ratio of the modeled to resolved turbulent kinetic energy, through which the conversion from DNS to RANS can be achieved. In the PANS method, the control parameters for bridging DNS and RANS are fk and fε (Girimaji, 2006; Girimaji et al., 2006) which are the modeled-to-total ratio of the turbulent kinetic energy and its dissipation, respectively. At high Reynolds number flows, there is little dissipation in the resolved scales; thus, it is reasonable that fε is set to unity (Girimaji et al., 2006; Lakshmipathy and Girimaji, 2010). When fk equals unity, the PANS model degrades to a RANS model, while when fk equals 0, it indicates a DNS simulation. For flows with a high Reynolds number, a reasonable fk distribution is a key factor for the PANS method. Based on different theories, several scholars have proposed different expressions of fk. For example, Abdol-Hamid and Girimaji (2004) introduced an original two-stage procedure to calculate fk, while Song and Park (2009) and Foroutan and Yavuzkurt (2014) deduced two different fk formulations based on different energy spectra. Hu et al. (2014) proposed a modified fk expression for unsteady cavitating flows, where fk varies as a function of water density and mixture density. In a simulation of the flow around a Clark-Y hydrofoil, their modified model can accurately predict the cavity evolution, vortex shedding frequency, and lift force fluctuation. More recently, Wang et al. (2020) proposed a novel Omega-driven dynamic model, where control parameter fk is automatically adjusted by the rigid vorticity ratio, and the results on three typical flows demonstrated that their model can improve the prediction accuracy.
At present, there is no general expression of parameter fk, and it is based on specific flow characteristics. According to the definition of fk, its expression based on the energy spectrum is more reasonable, and studies have indicated that the expression of the energy spectrum in a rotating flow differs from that in an ordinary (non-rotating) flow. Zeman (1994) investigated the spectral energy transfer in rotating homogeneous turbulence and found that the wavenumber
Since there is no fk expression based on the rotation-corrected energy spectrum yet for the efficient simulation of the complex flow with rotation effect in the rotating machinery, in this paper, a new fk expression based on the rotation-corrected energy spectrum is deduced and coupled with the PANS model. The PANS model with the new fk expression is verified in the rotating channel flow. Then it is applied to flow simulation of a centrifugal pump impeller with complex flows of rotating stall and flow separation for further validation.
Governing Equations
The PANS model
In the following analysis, the SST PANS model (Luo et al., 2014; Ranjan and Dewan, 2015; Pereira et al., 2015; Ranjan and Dewan, 2016; Pereira et al., 2018; Qian et al., 2020) is used. The transport equations of the SST PANS model are as follows:
where u is the partially averaged velocity; partial averaging corresponds to filtering a portion of the fluctuating scales (Girimaji, 2006), and throughout the study, the words filtering and averaging will be used synonymously. ku is the unresolved turbulent kinetic energy, ωu is the unresolved specific dissipation rate, fω is the modeled-to-total ratio of the specific turbulence dissipation and
In addition, F1u and F2u are two blending functions for the SST PANS model, which are defined as follows:
where y denotes the distance to the next surface.
fk Expressions Based on the Energy Spectrum
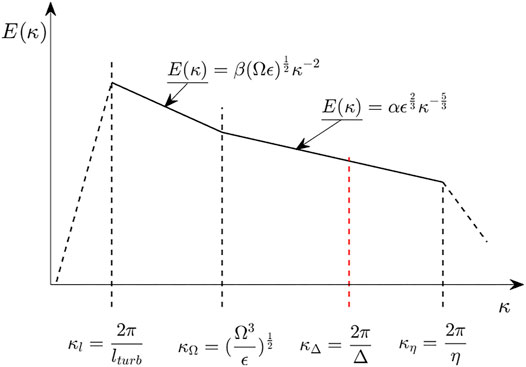
According to the Kolmogorov hypothesis (Pope, 2000), the energy spectrum without rotation is
Eq. 8 is named PANS-ES1. It is similar to that proposed by Song and Park (2009), and lturb, η, and Δ denote the turbulent length scale for RANS, Kolmogorov length scale (length scale for DNS), and grid size, respectively. The corresponding coupled model with SST k-ω PANS is called SST k-ω PANS-ES1 hereafter.
where kT is the total turbulent kinetic energy, which is equal to kr + ku. In addition, kr is the resolved turbulent kinetic energy,
Different from Song et al., Foroutan and Yavuzkurt (2014) adopted a von Kármán-like spectrum (Schiestel and Dejoan, 2005) and derived another fk formulation, (Eq. 10), which here is referred to as PANS-ES2, and the corresponding coupled model with SST k-ω PANS is called SST k-ω PANS-ES2 hereafter.
For the rotation-corrected energy spectrum, the energy spectrum between κl and κη is divided into two parts by the Zeman number
From the definition of fk,
For the small turbulent length scale (large wavenumber, κΔ∼κη), the turbulent kinetic energy cannot be resolved directly; thus, if
and if
Based on the study proposed by Thangam et al. (1999), it was assumed that
It should be noted that when
Verification and Application
Verification in Rotating Channel Flow
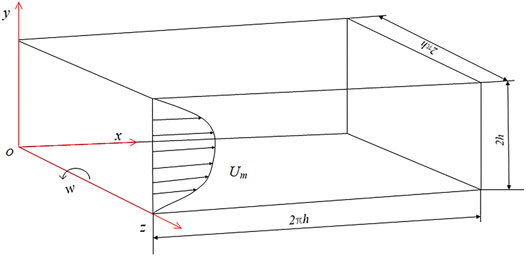
In rotating channel flows, the channel rotates in the spanwise direction with a constant angular velocity and is significantly affected by rotating flow characteristics, such as typical asymmetric distribution, streaks near the pressure side, and Taylor–Götler (TG) vortices (Grundestam et al., 2008), which is suitable for verifying the new fk expression based on the rotation-corrected energy spectrum. In the present study, rotating channel flows with a Reynolds number of 7,000 and rotation numbers of 0.3 and 0.6 are simulated. The Reynolds number is defined as
Subsequently, the SST k-ω PANS-ES1, SST k-ω PANS-ES2, and SST k-ω PANS-RCES models are used to simulate the rotating channel flow. The new turbulence models are compiled in OpenFOAM, and the simulation results are compared with the DNS data (Yang et al., 2012). For all PANS simulations, the PISO algorithm is applied to pressure–velocity coupling. A “Gauss linear” scheme with second-order accuracy is chosen for both the gradient term and the divergence term. A second-order implicit backward scheme is used for the time scheme.
The simulation results of the velocity and Reynolds stress analyzed in this study were time-, spanwise-, and streamwise-averaged:
where
Grid Convergence Study
A grid convergence study is performed for rotating channel flow to investigate grid dependence. The details of grid information and a part of the corresponding simulation results are shown in Table 1. The mesh elements vary in the y-direction (Kamble et al., 2019) as shown in Table 1. In the present grid convergence study, two rotation numbers of rotating channel flow are selected. Four meshes coupled with three different fk expressions, 12 cases for each rotation number in total, are simulated. In Table 1, only the results of Ro = 0.6 calculated by SST k-ω PANS-RCES are shown, which are similar to results obtained by the other two fk expressions. The same time step is used in all calculations, and the maximum Courant–Friedrichs–Lewy (CFL) number is all less than unity in the calculation process. For the y+ on the pressure surface (PS) and suction surface (SS) of the four meshes in the table, the y+ of the four meshes is all around unity, and the maximum is no more than 2, especially for the three grids except mesh1, the y+ is all below unity. By comparing the y+ of the PS and the SS (the first layer height of the PS and SS meshes are the same), it can be found that under the same grid, the y+ of the pressure surface is larger than that of the suction surface.
The magnitude and distribution of fk are key parameters that can determine the calculation accuracy of PANS models. Figure 3 plots the time-space-averaged results of the three fk expressions in rotating channel flow. Four different meshes and two different rotation numbers are used in the simulation, and the legend is the same for both figures. For the same fk expressions, the figures show that the magnitude of fk decreases with the increase of grid points. By comparing the fk distributions obtained using the three different expressions, the SST k-ω PANS-RCES result is much smaller than the results of SST k-ω PANS-ES1 and SST k-ω PANS-ES2, and the distribution pattern is also different. For all the three different fk expressions, the fk value is smaller in the region far from the wall than that in the region near the walls. However, the fk profiles near the pressure and suction surface of the SST k-ω PANS-RCES are different from the ones of the other two fk expressions. The fk value based on the rotation-corrected energy spectrum near the walls is generally lower than those of the other two fk expressions under both rotation numbers as shown in Figure 3, which may contribute to the better simulation performance near the walls.
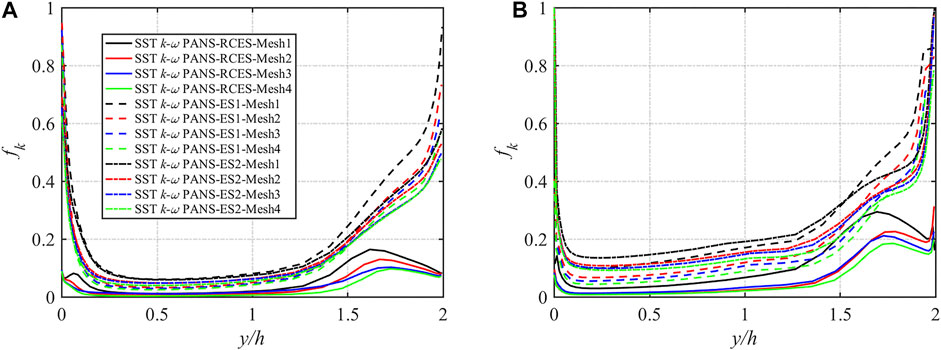
FIGURE 3. fk distribution in rotating channel flow under different meshes: (A) Ro = 0.3 and (B) Ro = 0.6.
Due to the Coriolis effect, the mean streamwise velocity profiles are increasingly asymmetric with an increasing rotation rate, and their slope is equal to the rotation number at the main flow region of the channel (Kristoffersen and Andersson, 1993; Huang et al., 2017). The mean streamwise velocities obtained by the different fk equations coupled with four meshes at Ro = 0.3 and 0.6 are presented in Figure 4, and the legend is the same as in Figure 3. It can be observed that reasonable results are obtained with different fk expressions for all four meshes, and the slope of the mean streamwise velocity profiles is equal to the rotation number. For the same fk expression, with the increase of mesh points, the numerical simulation results gradually approach the DNS results, and it converges when the number of mesh points increases to mesh3 at Ro = 0.3, and it happens at mesh2 when Ro = 0.6. For both two rotation numbers with four meshes, the results obtained by SST k-ω PANS-RCES are better than those obtained by SST k-ω PANS-ES1 and SST k-ω PANS-ES2. Especially, even with fewer meshes (mesh1, black solid lines), the SST k-ω PANS-RCES shows better performance than the other two PANS models with more mesh points (mesh2, red dotted, and dashed lines).
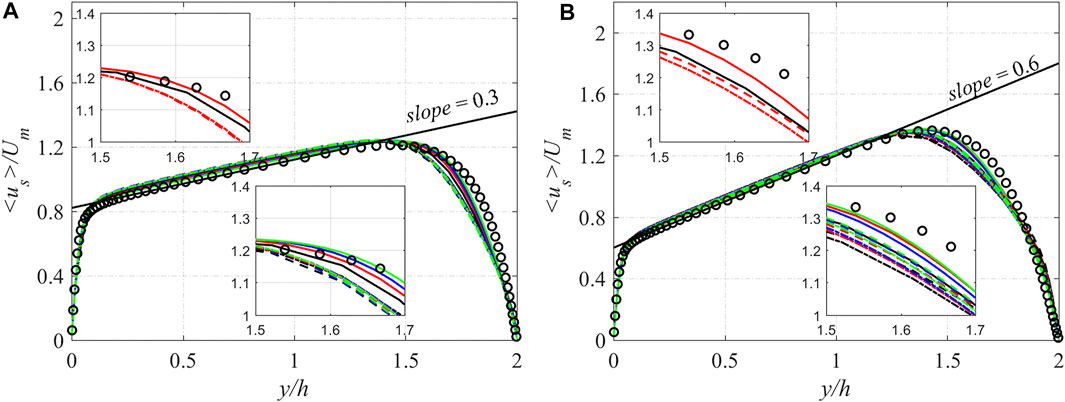
FIGURE 4. Mean streamwise velocity profiles in rotating channel flow: (A) Ro = 0.3 and (B) Ro = 0.6.
Near-Wall Velocity and Turbulence Statistics
The profiles of mean streamwise velocity in the near-wall area at both rotation numbers are shown in Figure 5 and Figure 6. According to the grid convergence study, results of Ro = 0.3 with mesh3 and results of Ro = 0.6 with mesh2 are discussed in this section. When Ro = 0.3, the results of SST k-ω PANS-RCES and SST k-ω PANS-ES1 are close to each other and consistent with DNS results, while the results of SST k-ω PANS-ES2 show some deviations. As for the velocity near the pressure side of Ro = 0.6, the results of the three models are relatively consistent. On the suction side, it can be observed more clearly that the SST k-ω PANS-RCES model has a more obvious advantage in predicting the near-wall velocity distribution under both rotation numbers, which is due to the more reasonable distribution of fk near the suction side shown in Figure 3.
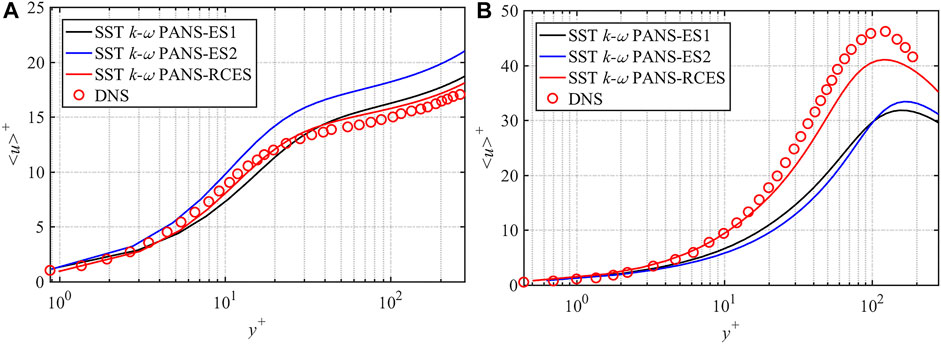
FIGURE 5. Comparison of mean streamwise velocity distribution in the near-wall area at Ro = 0.3: (A) pressure side and (B) suction side.
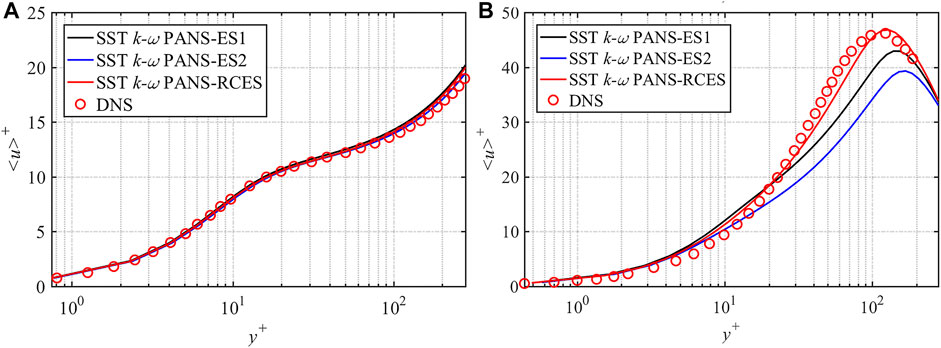
FIGURE 6. Comparison of mean streamwise velocity distribution in the near-wall area at Ro = 0.6: (A) pressure side and (B) suction side.
The profiles of root-mean-square (RMS) velocity and Reynolds shear stress under the two rotation numbers are exhibited in Figures 7, 8, respectively. vrms is the RMS velocity in the normal direction. Since the results of the streamwise and the normal RMS velocity are similar, they are not presented here. The RMS velocity and Reynolds shear stress are normalized by
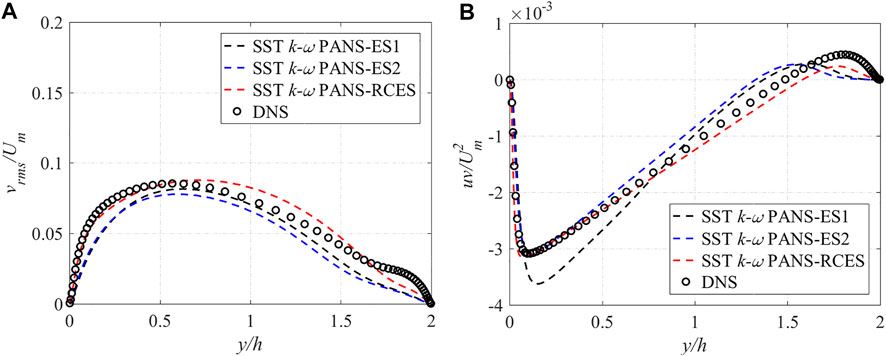
FIGURE 7. Comparison of turbulence statistics at Ro = 0.3 (A) normal RMS velocity (B) Reynolds shear stress.
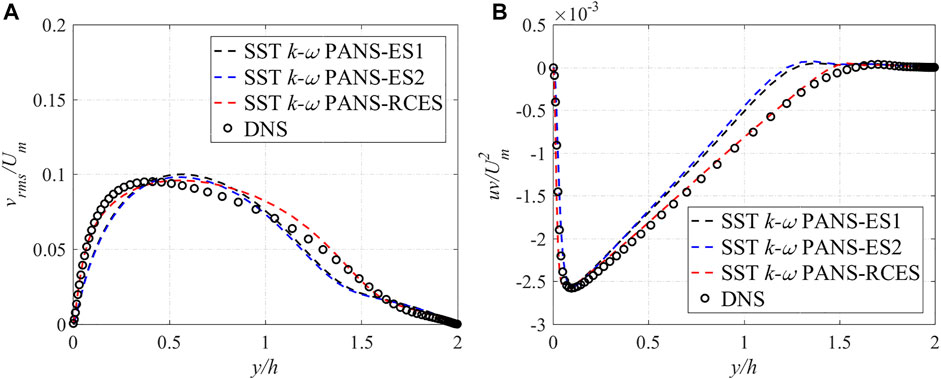
FIGURE 8. Comparison of turbulence statistics at Ro =0.6 (A) normal RMS velocity (B) Reynolds shear stress.
When Ro = 0.6, the vrms results demonstrate that the SST k-ω PANS-RCES model performance is consistent with the DNS results. Especially in near-wall areas, the SST k-ω PANS-RCES model results agree well with the DNS data. As for the Reynolds shear stress, both the SST k-ω PANS-ES1 and SST k-ω PANS-ES2 model results exhibit some deviation at the mainstream region (y/h = 0.5–1.5), while the SST k-ω PANS-RCES model can accurately predict the correct profile in the whole area.
TG Vortices
Johnston et al. (1973) were the first to experimentally observe the TG vortices, and later, in a DNS study, Kristoffersen and Andersson (1993) observed the TG vortices as well. TG vortices are induced by the unstable flow near the pressure surface, and when the Reynolds number increases, their presence generates complex flow structures. Hence, the TG vortex is an important large-scale structure and a prominent physical phenomenon in rotating channel flows. To isolate the TG vortex, the fluctuation velocity is defined as follows:
That is, the fluctuation velocity is the difference between the instantaneous velocity and the time-, streamwise-, and spanwise-averaged velocities. The TG fluctuation is defined as the streamwise average of the fluctuation velocity:
When the rotation number increases, the TG vortex becomes unstable. According to the DNS results of this example (Yang et al., 2010), the TG vortex becomes unstable and difficult to capture at Ro = 0.6; thus, in this section, the TG vortices at Ro = 0.3 with mesh3 are analyzed (Figure 9).
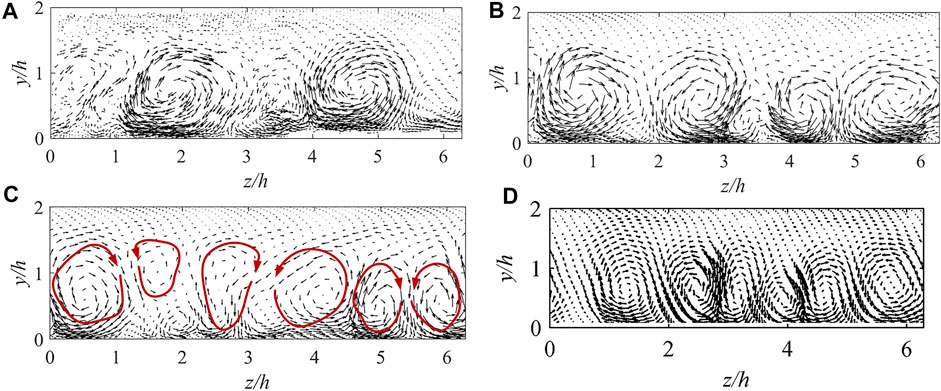
FIGURE 9. Comparison of Taylor–Götler vortices at Ro = 0.3: (A) SST k-ω PANS-ES1, (B) SST k-ω PANS-ES2, (C) SST k-ω PANS-RCES, and (D) DNS.
As can be observed in Figure 9, SST k-ω PANS-ES1 can predict only a pair of apparent vortices (z/h = 2 and z/h = 5), whereas SST k-ω PANS-ES2 predicts two pairs of vortices, and the vortex boundaries are very clear. Nevertheless, they are significantly different from the three pairs of TG vortices predicted by DNS. Only the SST k-ω PANS-RCES can capture all three pairs of vortices as DNS does. The vortex distribution on the right side of the flow channel is more apparent, while that on the left side is more ambiguous. By comparing the results, some discrepancies among the PANS results could be observed. Overall, the SST k-ω PANS-RCES results are better than those of SST k-ω PANS-ES1 and SST k-ω PANS-ES2, which further indicates that the SST k-ω PANS-RCES model based on the rotation-corrected energy spectrum is more suitable for predicting rotating flows.
Simulation Cost
For turbulence models, the balance of the simulation accuracy and cost is always the main target. According to the grid convergence study in Section 3.1.1, SST k-ω PANS-RCES with mesh1 can obtain similar results to the calculation accuracy of SST k-ω PANS-ES1 and SST k-ω PANS-ES2 with mesh2. For a better comparison of simulation cost, the time consumption (Tc) of four cases with two meshes at Ro = 0.6 is shown in Table 2. The statistical time consumption is 5,000 time steps after all calculations are stabilized. The Intel Xeon(R) Gold 5120 CPU with 2.2 GHz and 28 cores is installed in the simulation workstation. From Table 2, for the first three cases, it can be seen that the expression of RCES takes the shortest time to calculate the 5,000 time steps. In other words, for similar calculation accuracy, the newly developed fk expression can save more calculation resources than the other expressions. For the last three cases with the same meshes, the time consumption is almost the same. Combined with the simulation performance, it can be found that the PANS model with the new fk expression balances the simulation accuracy and the simulation cost commendably for rotating channel flow.
Application in a Centrifugal Pump
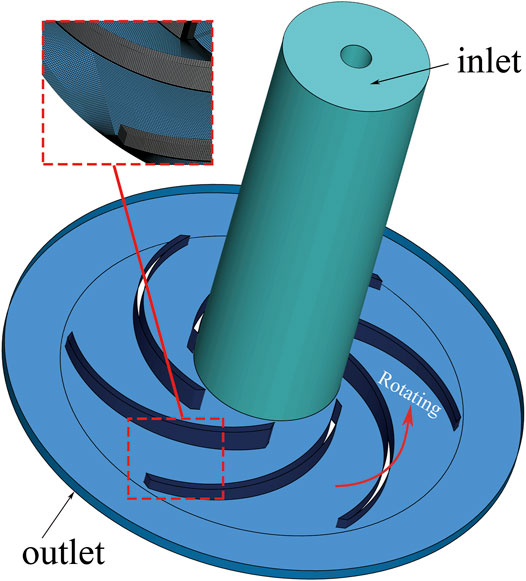
The flow in a centrifugal pump is another typical rotating flow type. The large curvature and multiwall characteristics of the pump structure make the accurate prediction of the internal flow very difficult. In this study, a low specific speed centrifugal pump is used to verify the applicability of the new fk expression based on the rotation-corrected energy spectrum. The pump has a rotating speed of 725 r/min, inlet diameter of D1 = 71 mm, and outlet radius of R2 = 95 mm, and the Reynolds number based on the inlet diameter D1 and the rated fiow rate Q0 was approximately 5.5×10⁴. The calculation domain is illustrated in Figure 10, and the grid points are approximately 2.78 million, which is determined based on previous simulations of this flow case (Byskov et al., 2003; Huang et al., 2015). In addition, the flow rate at the design condition was 3.06 L/s, and at the stall condition, it was 0.76 L/s. The corresponding experimental and simulation results are found in the studies by Pedersen et al. (2003) and Byskov et al. (2003).
Under the design conditions, the streamlines are smooth. Nevertheless, under part-load conditions, a stall happens in the impeller. More specifically, under stall conditions, a stall vortex is generated and blocks the channel. Therefore, the flow becomes more unstable, and the requirements for the turbulence model become higher (Pedersen et al., 2003; Zhou et al., 2014; Tao et al., 2014; Yao et al., 2016; Huang X.-b. et al., 2019). In this study, both the design-load condition, 1.0Q0, and the part-load condition, 0.25Q0, are used to verify the accuracy of the SST k-ω PANS-RCES (abbreviated as PANS hereafter) model. The mass flow rate is used as the inlet boundary condition, a pressure outlet boundary condition is used at the outlet, and a no-slip condition is set at the walls.
The Q = 1.0Q0 flow condition results of the velocity vector distributions in the impeller mid-height at the different radial positions of r/R2 = {0.65, 0.75, 0.90, 1.01} obtained by PANS and laser Doppler velocimetry (LDV) (Pedersen, 2000) are depicted in Figure 11. Under the design-load condition, the velocity vectors in the six flow channels are the same. The main feature is that the velocity at the suction surface (SS) of blades is large at 0.65 R2 and 0.75 R2, and the velocity at the pressure surface (PS) is small. The velocity distribution at 0.90 R2 is more uniform. At 1.01 R2, the velocity of the pressure surface is slightly greater than the velocity of the suction surface. This may be due to the secondary flow of the low specific speed centrifugal pump that causes the jet-wake flow at the exit to occur (Brun and Kurz, 2005; Zhang et al., 2019). The results of PANS and LDV show that PANS can capture the above phenomenon well. A more detailed comparison of the velocity distribution at 0.5 R2 and 0.75 R2 is shown in Figures 12, 13. From the figures, it is more obvious that the results of PANS are consistent with those of LES and PIV results, indicating that the velocity distribution can be well predicted in both near-wall and mainstream regions, and the newly developed fk expression RCES can accurately predict the flow field in the design-load condition.
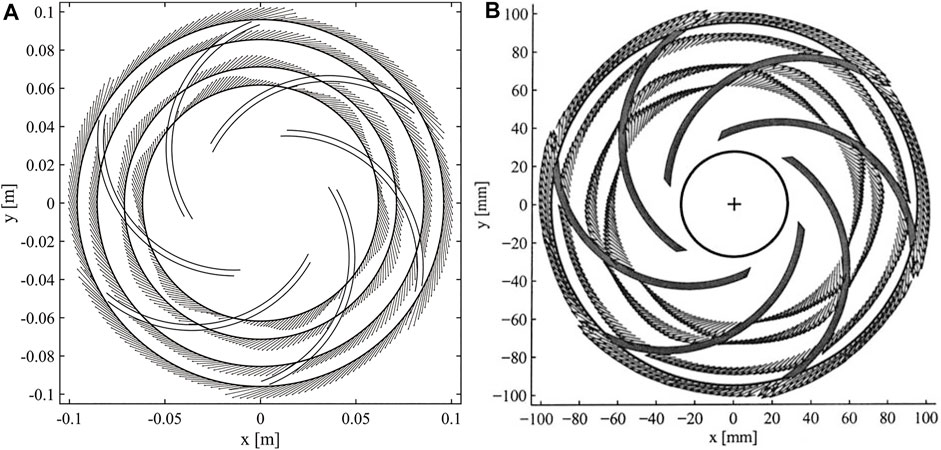
FIGURE 11. Velocity vector distributions at different radial positions under the design-load condition: (A) PANS and (B) LDV.
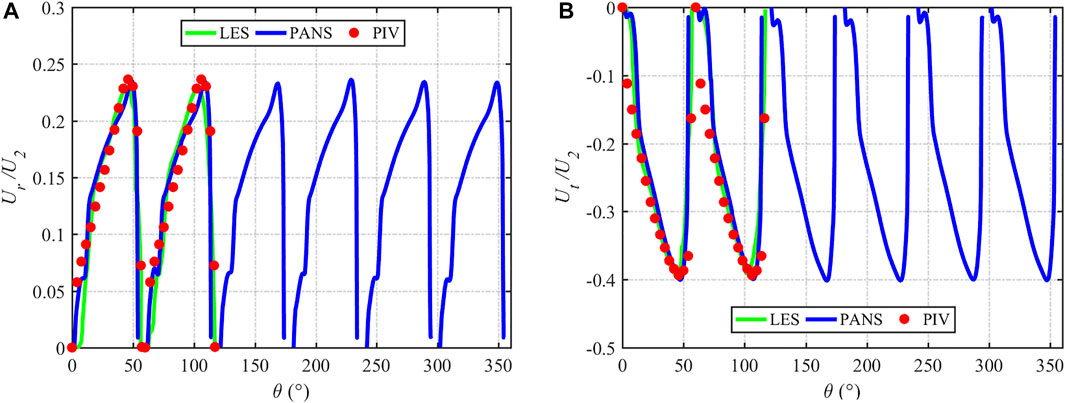
FIGURE 12. Comparison of time-averaged velocity at Q = 1.0Q0 flow condition: (A) 0.5R2 radial velocity and (B) 0.5R2 tangential velocity.
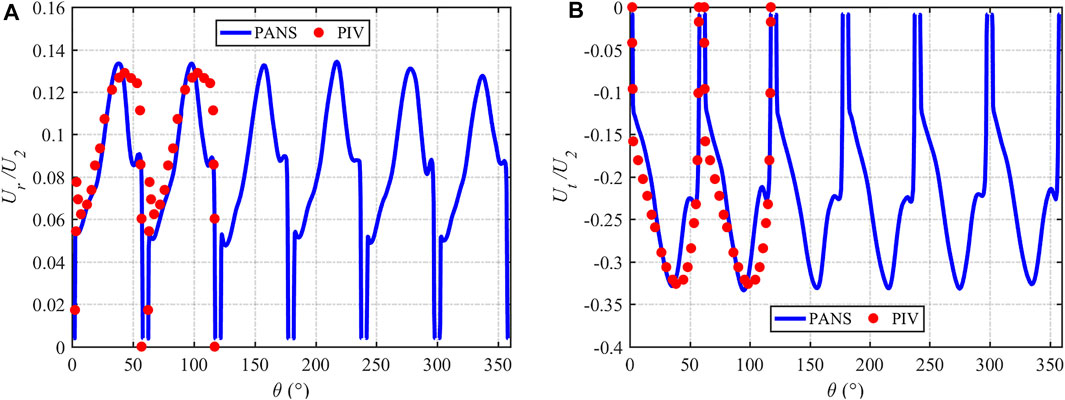
FIGURE 13. Comparison of time-averaged velocity at Q = 1.0Q0 flow condition: (A) 0.75R2 radial velocity and (B) 0.75R2 tangential velocity.
The velocity vector in the impeller mid-height under the part-load condition is shown in Figure 14. Under this working condition, the velocity vector of adjacent flow passages is different, which can be marked as non-stall Passage A and stall Passage B, respectively. It can be seen from Figure 14 that only one vortex appears on the suction surface in the non-stall Passage A. A smaller vortex appears at the inlet of the stall passage, and a larger one appears near the exit of the passage. The results of PANS are consistent with those of LES. Figure 15 shows the velocity vector results of r/R2 = {0.50, 0.65, 0.75, 0.90}. For stall passage, backflow occurs on the suction surface at the inlet, which is an important factor to generate stall vortices. The results of PANS and LES can accurately predict this result. For other flow direction positions, PANS also shows good prediction accuracy.
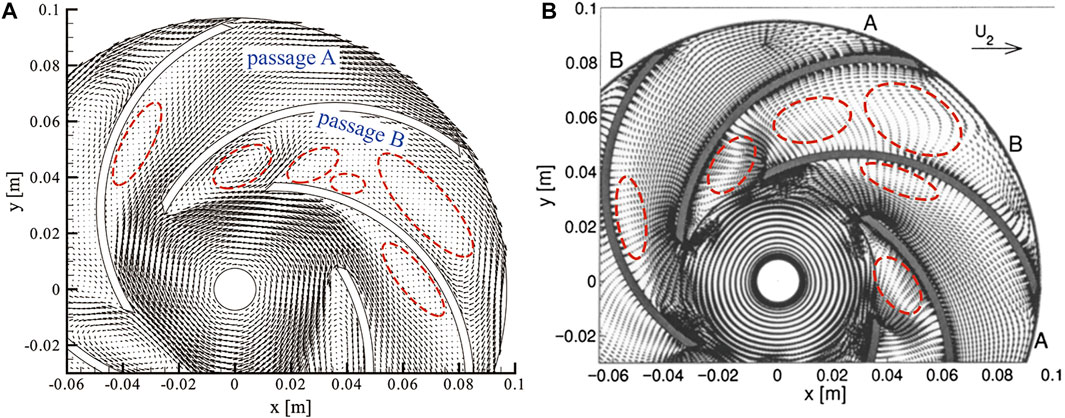
FIGURE 14. Velocity vector distributions in the impeller mid-height under 0.25Q0 flow condition: (A) PANS and (B) LES.

FIGURE 15. Velocity vector distributions in the impeller mid-height at different radial positions: (A) PANS, (B) LES, and (C) LDV.
Conclusion
1) An SST k-ω PANS model with a new expression of fk based on the rotation-corrected energy spectrum is proposed in this study. The new model is verified in the rotating channel flow at two different rotation numbers, and then it is applied to a centrifugal pump impeller for further validation.
2) It was found that the fk distribution of the new model is reasonably distributed in the rotating channel flow. In the near-wall area, the reasonable reduction of fk allows the new model to have better performance in near-wall flow calculation. In the region near the pressure side with turbulence enhanced, the fk value turns out to be small, and it increases toward the suction side since the turbulence is suppressed. The fk distribution shows that it corresponds to the flow characteristics well, and the simulation results, including mean velocity, RMS velocities, and TG vortexes, agree well with the DNS data. From the calculation cost results, it was found that the new model shows a better performance than the other two PANS models with the same mesh points, and it shows comparable performance even with fewer mesh points.
3) The application of the new model in a centrifugal pump impeller shows that it can accurately capture the time-averaged flow fields including stall vortices under part-load conditions and velocity vector distributions under both design-load and part-load conditions. In addition, the new PANS model can predict the tangential and radial velocities well under both flow conditions, showing that the new model is appropriate for the simulation of flows with rotation effects.
Data Availability Statement
The original contributions presented in the study are included in the article/Supplementary Material; further inquiries can be directed to the corresponding author.
Author Contributions
This is a joint work and the authors were in charge of their expertise and capability: BL worked on investigation, analysis, writing, and revision; WY and ZL worked on methodology and revision.
Funding
The authors would like to acknowledge the financial support received from the National Natural Science Foundation of China (grant number 52179093).
Conflict of Interest
The authors declare that the research was conducted in the absence of any commercial or financial relationships that could be construed as a potential conflict of interest.
Publisher’s Note
All claims expressed in this article are solely those of the authors and do not necessarily represent those of their affiliated organizations, or those of the publisher, the editors, and the reviewers. Any product that may be evaluated in this article, or claim that may be made by its manufacturer, is not guaranteed or endorsed by the publisher.
Acknowledgments
The authors would like to acknowledge ZL and Yaojun Li for their valuable advice to this study.
References
Abdol-Hamid, K., and Girimaji, S. S. (2004). A Two-Stage Procedure toward the Efficient Implementation of Pans and Other Hybrid Turbulence Models. Hampton, Virginia: Technical Memorandum NASA Langley Research Center.
Baroud, C. N., Plapp, B. B., She, Z.-S., and Swinney, H. L. (2002). Anomalous Self-Similarity in a Turbulent Rapidly Rotating Fluid. Phys. Rev. Lett. 88 (11), 114501. doi:10.1103/PhysRevLett.88.114501
Brun, K., and Kurz, R. (2005). Analysis of Secondary Flows in Centrifugal Impellers. Int. J. Rotating Machinery 2005, 45–52. doi:10.1155/IJRM.2005.45
Byskov, R. K., Jacobsen, C. B., and Pedersen, N. (2003). Flow in a Centrifugal Pump Impeller at Design and Off-Design Conditions-Part II: Large Eddy Simulations. J. Fluids Eng. 125 (1), 73–83. doi:10.1115/1.1524586
Canuto, V. M., and Dubovikov, M. S. (1997). A Dynamical Model for Turbulence. V. The Effect of Rotation. Phys. Fluids 9 (7), 2132–2140. doi:10.1063/1.869332
Foroutan, H., and Yavuzkurt, S. (2014). A Partially-Averaged Navier-Stokes Model for the Simulation of Turbulent Swirling Flow with Vortex Breakdown. Int. J. Heat Fluid Flow 50, 402–416. doi:10.1016/j.ijheatfluidflow.2014.10.005
Girimaji, S. S., Jeong, E., and Srinivasan, R. (2006). Partially Averaged Navier-Stokes Method for Turbulence: Fixed Point Analysis and Comparison with Unsteady Partially Averaged Navier-Stokes. J. Appl. Mech. 73, 422–429. doi:10.1115/1.2173677
Girimaji, S. S. (2006). Partially-Averaged Navier-Stokes Model for Turbulence: A Reynolds-Averaged Navier-Stokes to Direct Numerical Simulation Bridging Method. J. Appl. Mech. 73 (5), 413–421. doi:10.1115/1.2151207
Girimaji, S. S., Srinivasan, R., and Jeong, E. (2003). “PANS Turbulence Model for Seamless Transition between RANS and LES Fixed-point Analysis and Preliminary Results,” in 4th ASME_JSME Joint Fluids Engineering Conference (Honolulu, Hawaii, USA. doi:10.1115/fedsm2003-45336
Grundestam, O., Wallin, S., and Johansson, A. V. (2008). Direct Numerical Simulations of Rotating Turbulent Channel Flow. J. Fluid Mech. 598 (598), 177–199. doi:10.1017/s0022112007000122
Hu, C., Wang, G., Chen, G., and Huang, B. (2014). A Modified PANS Model for Computations of Unsteady Turbulence Cavitating Flows. Sci. China Phys. Mech. Astron. 57 (10), 1967–1976. doi:10.1007/s11433-014-5538-6
Huang, X.-b., Liu, Z.-q., Li, Y.-j., Yang, W., and Guo, Q. (2019). Study of the Internal Characteristics of the Stall in a Centrifugal Pump with a Cubic Non-linear SGS Model. J. Hydrodyn. 31 (4), 788–799. doi:10.1007/s42241-018-0170-y
Huang, X., Liu, Z., and Yang, W. (2015). Comparative Study of SGS Models for Simulating the Flow in a Centrifugal-Pump Impeller Using Single Passage. Eng. Comput. 32 (7), 2120–2135. doi:10.1108/EC-09-2014-0193
Huang, X., Yang, W., Li, Y., Qiu, B., Guo, Q., and Zhuqing, L. (2019). Review on the Sensitization of Turbulence Models to Rotation/curvature and the Application to Rotating Machinery. Appl. Maths. Comput. 341, 46–69. doi:10.1016/j.amc.2018.08.027
Johnston, J. P., Halleen, R. M., and Lezius, D. K. (1973). Effects of Spanwise Rotation on the Structure of Two-Dimensional Fully Developed Turbulent Channel Flow. J. Fluid Mech. 56, 533–557. doi:10.1017/S0022112073002077
Kamble, C., Girimaji, S. S., and Chen, H.-C. (2020). Partially Averaged Navier-Stokes Formulation of a Two-Layer Turbulence Model. AIAA J. 58 (1), 174–183. doi:10.2514/1.J058742
Kristoffersen, R., and Andersson, H. I. (1993). Direct Simulations of low-Reynolds-number Turbulent Flow in a Rotating Channel. J. Fluid Mech. 256, 163–197. doi:10.1017/s0022112093002757
Lakshmipathy, S., and Girimaji, S. S. (2010). Partially Averaged Navier-Stokes (PANS) Method for Turbulence Simulations: Flow Past a Circular Cylinder. J. Fluids Eng. 132 (12). doi:10.1115/1.4003154
Lin, P., Yang, T., Xu, W., and Zhu, Z. (2022). Influence of Different Offset Angles of Inlet Guide Vanes on Flow Characteristics of Centrifugal Pump. Front. Energ. Res. 10, 818244. doi:10.3389/fenrg.2022.818244
Luo, D., Yan, C., Liu, H., and Zhao, R. (2014). Comparative Assessment of PANS and DES for Simulation of Flow Past a Circular cylinder. J. Wind Eng. Ind. Aerodynamics 134, 65–77. doi:10.1016/j.jweia.2014.08.014
Pedersen, N. (2000). Experimental Investigation of Flow Structures in a Centrifugal Pump Impeller Using Particle Image Velocimetry. USA: Technical University of Denmark. [Ph.D thesis]. dissertation.
Pedersen, N., Larsen, P. S., and Jacobsen, C. B. (2003). Flow in a Centrifugal Pump Impeller at Design and Off-Design Conditions-Part I: Particle Image Velocimetry (PIV) and Laser Doppler Velocimetry (LDV) Measurements. J. Fluids Eng. 125 (1), 61–72. doi:10.1115/1.1524585
Pereira, F. S., Vaz, G., Eça, L., and Girimaji, S. S. (2018). Simulation of the Flow Around a Circular cylinder at Re =3900 with Partially-Averaged Navier-Stokes Equations. Int. J. Heat Fluid Flow 69, 234–246. doi:10.1016/j.ijheatfluidflow.2017.11.001
Pereira, S. F., Vaz, G., and Eca, L. (2015). “An Assessment of Scale-Resolving Simulation Models for the Flow Around a Circular cylinder,” in Turbulence, Heat and Mass Transfer (Sarajevo: Begell House), 8. doi:10.1615/ichmt.2015.thmt-15.540
Qian, Y., Wang, T., Yuan, Y., and Zhang, Y. (202011814). Comparative Study on Wind Turbine Wakes Using a Modified Partially-Averaged Navier-Stokes Method and Large Eddy Simulation. Energy 206, 118147. doi:10.1016/j.energy.2020.118147
Ranjan, P., and Dewan, A. (2016). Effect of Side Ratio on Fluid Flow and Heat Transfer from Rectangular Cylinders Using the PANS Method. Int. J. Heat Fluid Flow 61 (B), 309–322. doi:10.1016/j.ijheatfluidflow.2016.05.004
Ranjan, P., and Dewan, A. (2015). Partially Averaged Navier Stokes Simulation of Turbulent Heat Transfer from a Square cylinder. Int. J. Heat Mass Transfer 89, 251–266. doi:10.1016/j.ijheatmasstransfer.2015.05.029
Rathor, S. K., Sharma, M. K., Ray, S. S., and Chakraborty, S. (2020). Bridging Inertial and Dissipation Range Statistics in Rotating Turbulence. Phys. Fluids 32 (9), 095104. doi:10.1063/5.0016495
Schiestel, R., and Dejoan, A. (2005). Towards a New Partially Integrated Transport Model for Coarse Grid and Unsteady Turbulent Flow Simulations. Theoret. Comput. Fluid Dyn. 18 (6), 443–468. doi:10.1007/s00162-004-0155-z
Song, C.-S., and Park, S.-O. (2009). Numerical Simulation of Flow Past a Square cylinder Using Partially-Averaged Navier-Stokes Model. J. Wind Eng. Ind. Aerodynamics 97, 37–47. doi:10.1016/j.jweia.2008.11.004
Tao, R., Xiao, R., Yang, W., and Wang, F. (2014). A Comparative Assessment of Spalart-Shur Rotation/Curvature Correction in RANS Simulations in a Centrifugal Pump Impeller. Math. Probl. Eng. 2014, 1–9. doi:10.1155/2014/342905
Thangam, S., Wang, X.-H., and Zhou, Y. (1999). Development of a Turbulence Model Based on the Energy Spectrum for Flows Involving Rotation. Phys. Fluids 11 (8), 2225–2234. doi:10.1063/1.870084
Wang, C.-y., Wang, F.-j., Wang, B.-h., Tang, Y., and Zhao, H.-r. (2020). A Novel Omega-driven Dynamic PANS Model. J. Hydrodyn. 32, 710–716. doi:10.1007/s42241-020-0052-y
Xianbei, H., Zhuqing, L., Wei, Y., Yaojun, L., and Zixuan, Y. (2017). A Cubic Nonlinear Subgrid-Scale Model for Large Eddy Simulation. J. Fluids Eng. 139 (4), 41101. doi:10.1115/1.4035217
Yang, Z., Cui, G., Xu, C., Shao, L., and Zhang, Z. (2010). The Effect of the Taylor-Görtler Vortex on Reynolds Stress Transport in the Rotating Turbulent Channel Flow. Sci. China Phys. Mech. Astron. 53 (4), 725–734. doi:10.1007/s11433-010-0168-0
Yang, Z., Cui, G., Xu, C., and Zhang, Z. (2012). Large Eddy Simulation of Rotating Turbulent Channel Flow with a New Dynamic Global-Coefficient Nonlinear Subgrid Stress Model. J. Turbulence 13 (48), N48–N20. doi:10.1080/14685248.2012.726996
Yao, Z.-F., Yang, Z.-J., and Wang, F.-J. (2016). Evaluation of Near-wall Solution Approaches for Large-Eddy Simulations of Flow in a Centrifugal Pump Impeller. Eng. Appl. Comput. Fluid Mech. 10 (1), 452–465. doi:10.1080/19942060.2016.1189362
Zeman, O. (1994). A Note on the Spectra and Decay of Rotating Homogeneous Turbulence. Phys. Fluids 6 (10), 3221–3223. doi:10.1063/1.868053
Zhang, N., Liu, X., Gao, B., and Xia, B. (2019). DDES Analysis of the Unsteady Wake Flow and its Evolution of a Centrifugal Pump. Renew. Energ. 141, 570–582. doi:10.1016/j.renene.2019.04.023
Zhang, X., Xia, G., Cong, T., Peng, M., and Wang, Z. (2020). Uncertainty Analysis on K-ε Turbulence Model in the Prediction of Subcooled Boiling in Vertical Pipes. Front. Energ. Res. 8, 584531. doi:10.3389/fenrg.2020.584531
Zhou, P. J., Wang, F. J., Yang, Z. J., and Mou, J. G. (2014). Investigation of Rotating Stall for a Centrifugal Pump Impeller Using Various SGS Models. J. Hydrodyn. 29 (2), 235–242. doi:10.1016/S1001-6058(16)60733-3
Keywords: PANS, energy spectrum, turbulence model, rotating flow, centrifugal pump
Citation: Liu B, Yang W and Liu Z (2022) A PANS Method Based on Rotation-Corrected Energy Spectrum for Efficient Simulation of Rotating Flow. Front. Energy Res. 10:894258. doi: 10.3389/fenrg.2022.894258
Received: 11 March 2022; Accepted: 21 March 2022;
Published: 19 April 2022.
Edited by:
Kan Kan, College of Energy and Electrical Engineering, ChinaReviewed by:
Tianyi Li, University of Minnesota Twin Cities, United StatesLeilei Ji, Jiangsu University, China
Copyright © 2022 Liu, Yang and Liu. This is an open-access article distributed under the terms of the Creative Commons Attribution License (CC BY). The use, distribution or reproduction in other forums is permitted, provided the original author(s) and the copyright owner(s) are credited and that the original publication in this journal is cited, in accordance with accepted academic practice. No use, distribution or reproduction is permitted which does not comply with these terms.
*Correspondence: Wei Yang, d3lhbmdAY2F1LmVkdS5jbg==
 Benqing Liu
 Wei Yang
 Zhuqing Liu