 Yingjun Zheng1
 Sheng Su
- 1School of Electrical and Information Engineering, Changsha University of Science & Technology, Changsha, China
- 2Changsha Electric Power Corporations, State Grid of China, Changsha, China
Electricity theft of low voltage (LV) users could result not only in the escalation of power loss but also in dangerous electric shock. Since LV users are served by distribution transformers, electricity theft of an LV user will cause line loss escalation of the associated distribution serving zone (DTSZ). Therefore, it seems promising to identify anomaly users of electricity theft with a Granger causality test to find out the user causing an escalation of line loss in DTSZ with time series of users’ usage and line loss. However, meters of LV users in severe environments occasionally suffer from communication failure to upload metering data to the head end of advanced metering infrastructure (AMI), which could distort the daily electricity usage of the associate user. Consequently, it could cause false alarms unavoidably once we detect electricity theft with these distorted data. Since the distribution transformer unit (DTU) collects metering data of LV users within associate DTSZ without distortion, an edge computing–based electricity theft detection approach is proposed in this article. The correlation between line loss of a DTSZ and electricity usage of anomaly users of electricity theft is first analyzed. Thereafter, the Granger causality test is used to identify anomaly users with authentic usage data with edge computing in DTU. Finally, the abnormal data and the data repaired by different missing data filling algorithms are used on the main station to detect electricity theft. Numerical simulation suggests that although missing data completion could recover information in missing data partially, it could result in notable false positive alarms in electricity theft, while the proposed method based on edge computing can completely eliminate the data distortion caused by communication failure.
1 Introduction
Electricity theft of low voltage (LV) users could cause substantial revenue loss to power utilities. Moreover, anomaly wire hooks result in numerous electric shocks to users. Therefore, it is highly preferred to identify anomaly LV users (Wang Y. et al., 2019; Zhang et al., 2019; Partha et al., 2020). Since there are millions of LV residential users with diversified usage patterns, it is rather difficult to identify anomaly ones of electricity theft, and electricity detection of LV users remains a difficulty in industrial applications (Li et al., 2018).
The extensive application of smart meters could provide substantial meter data on electricity usage, which can lay a solid foundation for data-driven electric theft detection. Zheng et al. (2019) detected electricity theft with maximum information coefficient and density peak fast clustering algorithm in combination. Zhuang et al. (2016) and Sun et al. (2018) detected electricity theft with fluctuation of multi-day usage, fluctuation of the SD of usage, and trend of usage with an improved outlier identification algorithm. Since extracted features play a key role in the precision of anomaly detection, a stacked de-correlation auto-encoder is employed (Hu et al., 2019) to extract highly condensed independent features. Thereafter, a support vector machine is used to identify anomaly users (Hu et al., 2019). Since power utilities have limited market crews for onsite inspection, a false positive rate (FPR) is key to evaluating the performance of electricity theft (Jin et al., 2022). To prevent false positives alarm, marketing crews implement onsite inspection of DTSZ with a high loss ratio above 8%. Since there is an underlying correlation between anomaly users of electricity theft and line loss of associated feeder, a Granger causality analysis–based approach is proposed by Jin et al. (2020) to detect users who cause fluctuations in line loss. Since high line loss in a DTSZ is usually caused by electricity theft, once we detect electricity theft in DTSZ with a high loss rate, it could achieve a low false alarm rate (Tang et al., 2020).
It should be pointed out that the meters of LV users communicating via power line communication (PLC) could suffer failure occasionally. Once a smart meter fails to upload its usage data to the head end of AMI, it will upload it in the following days. The head end calculates the daily line loss of a DTSZ according to the daily served electricity and accumulation of all users’ daily usage. Line loss of the DTSZ escalates on the days when the meter fails and declines to even below zero in the following days when meters upload usage data of communication failure and that very day. Existing approaches to electricity detection identify anomaly users with accurate metering data, while false data cause misleading results inevitably.
To overcome the problem of detecting electricity theft with metering data in the head end of AMI, an edge computing–based electricity detection approach is proposed in this article. The rest of the article is organized as follows. Existing approaches to missing data completion are investigated in Section 2. Correlation of anomaly users’ usage and line loss of associate DTSZ in investigated and edge computing–based approach is developed in Section 3. Numerical simulation of real-world metering data is analyzed in Section 4 to demonstrate the superiority of the proposed method to that of data restored with various missing data completion algorithms. Section 5 concludes the article.
2 Electricity Missing Data Completion Method
Metering data could suffer interference and failure in the process of data acquisition, conversion, and communication, and missing data and false data are common for industrial applications of power utilities. Traditionally, power systems are measured with redundancy. Therefore, some missing data or false data can be identified and corrected with state estimation. There are similar missing data and false data in AMI. However, since these data are not closely coupled with each other, they can be corrected and filled with state estimation (Yang Y. et al., 2020). Traditionally, missing data and false data of AMI are filled or corrected with the mean of previous and following data, interpolation mode, closest distance data, regression model, and maximum expectation based algorithm (Sundararajan et al., 2019). However, most of them implement data completion with statistic-based and mechanism-based models and neglect underlying features of a single time series and correlation among various time series. Data completion with these approaches is not as satisfying as expected (Chen et al., 2019; Yang et al., 2019).
Since missing data is rather common in various fields, numerous researchers have researched missing data completion and achieved notable progress in recent years (Siamkaz et al., 2018; Song et al., 2019). Based on the inertial effect of the measured data, Ruan deduced coarse values of pre-attack measurements. Then, based on the deduced coarse values and suggested state bounds, an optimization model is proposed to recover the measurements (Ruan et al., 2022). The matrix filling method used in the Netflix recommendation system is established on the premise that the data matrix has low rank and sparsity. It could reconstruct the original matrix precisely in the case of partial loss of original data. The low-rank matrix completion theory is based on the low rank of the data to recover the missing data. It takes matrix rank minimization as the objective function. The classical mathematical model of data recovery is expressed as follows.
where
where E denotes peak outlier matrix, G denotes Gaussian noise matrix, ρ and δ denote weight coefficients correspondingly, and N denotes auxiliary matrix. The augmented Lagrange function in Eq. 3 can be transformed into an unconstrained optimization problem and solved with the alternating direction method of multipliers (ADMM) according to literature (Yang T. et al., 2020).
Tensor completion is a high dimensional matrix completion. Since the electricity usage of multiple users on different days may have an underlying multi-dimensional internal correlation, tensor completion could be utilized to recover missing or false with high precision (Zhao et al., 2020). The fundamental principle of tensor completion is similar to matrix completion and could be referred to (Zhao et al., 2020).
Unlike matrix completion and tensor completion to recover missing data with low-rank data, generative adversarial networks (GAN) is a data-driven approach which extracts features from large amounts of unlabeled data through GAN’s adversarial game. A discriminant model that can accurately identify the authentic and false/missing data and a generic model that can capture the potential features and spatial and temporal features of the data are obtained. Thereafter, the dual semantic perception constraint is utilized to retrain the model to find the candidate data that has the greatest similarity to the data to be reconstructed with missing values (Wang S. et al., 2019). It should be pointed out that the GAN based approach works on a large number of data, and it is not appropriate for the date completion of limited LV users in a DTSZ. Matrix completion and tensor completion are utilized to recover false/missing data in this article.
3 Detection of Power Theft in Low Voltage Platform Based on Edge Computing
3.1 Correlation Analysis of User Power Quantity and Line Loss in Low Voltage Station Area
Non-technical loss (NTL) in DTSZ is mainly caused by electricity theft, and the NTL caused by anomaly users is usually correlated to its metering data and associated NTL. Therefore, there is an underlying correlation between the metering data of anomaly users and the NTL of DTSZ. The correlation could be identified with Granger causality analysis to find out the anomaly users caused an escalation of loss of DTSZ.
Metering data of a real-world DTSZ is employed to analyze the correlation between metering data and loss of DTSZ. Loss of the DTSZ in 62 consecutive days is shown in Figure 1. There are six industrial and commercial users and 33 low-voltage residential users in the DTSZ. The served daily mean electricity is about 1200 kWh, while the daily mean loss is about 100 kWh in January and February 2020. The loss rate came up to 9.6%, and it is highly suspected that there is an anomaly user of electricity theft. Since electricity theft of industrial and commercial users is contributing much more than average residential users, electricity usage of six industrial and commercial users within the DTSZ from 30 December 2019 to February 2020 is analyzed as follows.
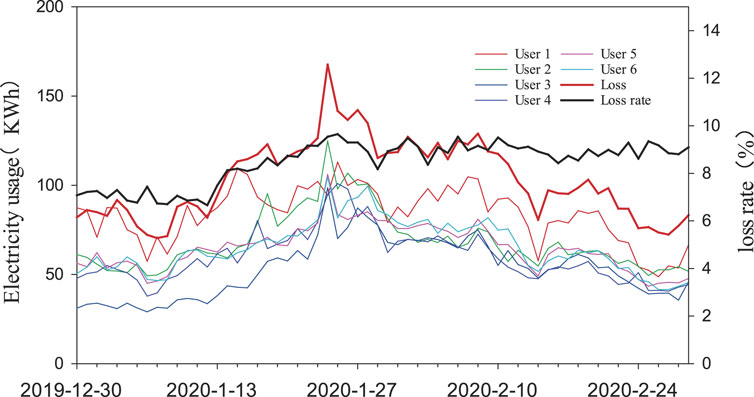
FIGURE 1. Electricity usage of users and loss of DTSZ with a high loss rate.
The red line denotes the daily loss of DTSZ (G), and the black line denotes the daily loss rate of DTSZ. The other six lines denote the electricity consumption of six industrial and commercial users, which are depicted as H1∼H6 in the following section. It can be observed that the loss profile of DTSZ has a similar trend as that of users’ usage. Most of them escalate in the beginning and then decline in the end.
3.2 Data Communication and Anomaly Analysis in LV DTSZ
DTU is generally installed on the secondary side of the distribution cabinet (Liu et al., 2020). It communicates via protocol RS485 or PLC within the DTSZ and communicates with the head end of AMI with wireless communication or optical fiber. DTU collects metering data of the distribution transformer and associates LV users within DTSZ and uploads it to the head end of AMI (Huang et al., 2021; Zhong et al., 2021). Communication architecture within a typical DTSZ is shown in Figure 2.
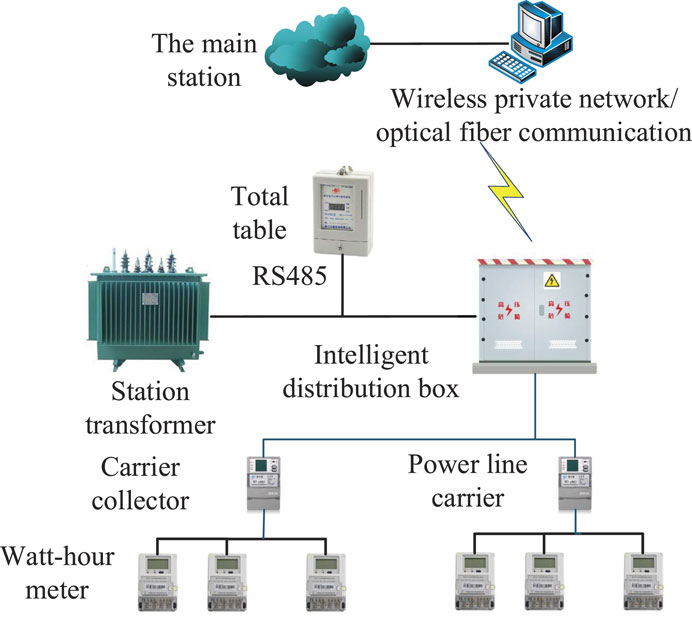
FIGURE 2. Basic communication diagram of the distribution area.
In real-world AMI, meters of users operate in severe environments and it could suffer communication occasionally. Once it suffers communication failure, it could upload daily metering data in the following days, which could cause zero electricity usage on the previous day and electricity usage of 2 days on the following day in the head end of AMI. In order to demonstrate the impact of communication failure on data quality of the head end of AMI, user one of DTSZ was selected to report 0 electricity usage on 29 January 2020, and the usage was accumulated and uploaded on the following day. The usage of users and loss data of DTSZ is plotted as shown in Figure 3. It can be observed that the loss and loss rate of DTSZ escalated notably on 29 January 2020 due to communication failure. While it decreases notably on the following day since usage in two consecutive days is accumulated. As a consequence, communication failure could distort the underlying correlation between anomaly users’ electricity usage and loss of DTSZ and result in misleading electricity theft identification as a consequence.
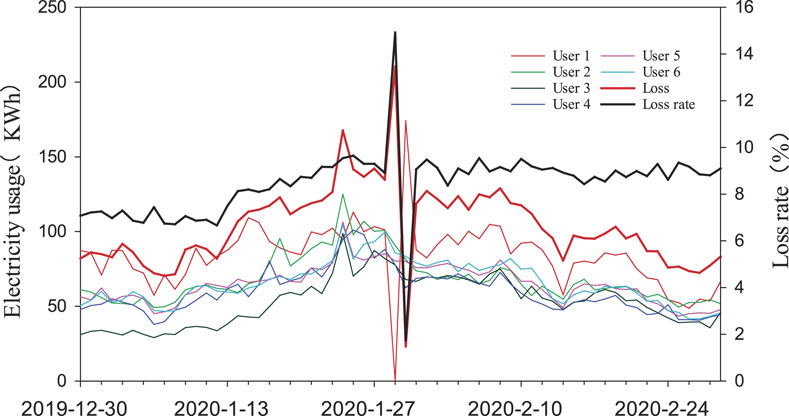
FIGURE 3. Electricity usage of users and loss of DTSZ with communication failure.
3.3 Edge Computing Based Electricity Theft Detection in Distribution Serving Zone
Co-integration test and Granger causality analysis are commonly used in economics to analyze the correlation among time series. In general, a co-integration test is used to test whether there is a long-term equilibrium among time series. Thereafter, Granger causality analysis is used to determine whether a variable impacts another variable (Zhu et al., 2017; Fan et al., 2019; Tian et al., 2019). Since electricity usage of an anomaly user of electricity theft is correlated to its usage in most theft modes, the fluctuation of loss pf DTSZ caused by anomaly users has a similar profile as time series of economic variables disturbed by other factors. Therefore, the equilibrium relationship and causal relationship between the loss of DTSZ and users’ metering data can be analyzed to detect anomaly users.
Traditionally, field terminals, such as DTU, have limited computing and storage resources. Complex functions such as identification of anomaly users of electricity theft can only be implemented in the head end of AMI. Communication failure induced data missing could impact its performance notably (Shi et al., 2016; Covi et al., 2021). In recent years, more and more meters are being deployed in distribution systems with the rapid development of Internet of Things (IoT) technology (Deng et al., 2021). Since computing and storage resources of concurrent IoT terminals escalate notably, it is technically feasible to implement some of the complex functions in IoT terminals with edge computing (Li et al., 2020; Wang et al., 2020; Liu et al., 2022).
DTU could be utilized as a platform for edge computing in DTSZ. Since it collects substantial data within the DTSZ, it can provide loss analysis, power quality monitoring, and topology analysis with edge computing. Since different vendors implement different business functions in the diversified OS environment, Docker technology is employed to provide an appropriate container for the APP of various vendors on the same DTU platform (Gong et al., 2018). Docker-based DTU is composed of a system layer and an application (APP) layer. The APP layer is divided into acquisition APP and business APP, which can interact with each other through the message bus. The former collects real-time operation data and load data; The latter accesses the data center through the device bus, extracts the required data for calculation and analysis, and implements edge computing of business functions (Nie et al., 2020).
Electricity theft detection can be implemented in the DTU with edge computing. The fundamental of the approach is that the concentrator APP of DTU collects users’ metering data within the DTSZ. Loss analysis APP collects serving electricity and calculates the loss of DTSZ. Thereafter, the electricity theft detection APP identifies anomaly users with Granger causality analysis with loss data and metering data of associated users in the DTSZ. The framework of the implementation process is shown in Figure 4. The method proposed in this paper transfers the detection of electricity theft from the head end of AMI to the DTU in the edge, which can eliminate communication associated data missing to identify anomaly users with lower fails positive rate.
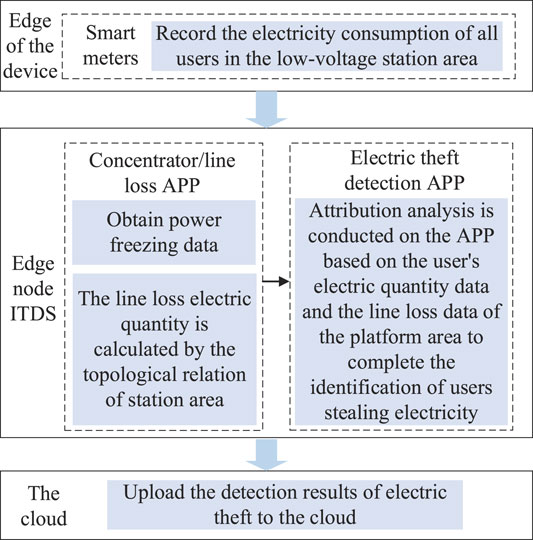
FIGURE 4. Electricity theft detection framework with edge computing.
Granger causality analysis is first used to identify anomaly users in DTSZ depicted in Section 1. Thereafter, the distorted data and distorted data recovered with various data completion approaches are analyzed in this section.
4 Numerical Simulation
4.1 Edge Computing–Based Electricity Theft Detection
ADF unit root tests were performed for G and H1-H6, and their differential sequences were on the edge side. With 5% confidence as the standard, all the sequences were first-order unitary sequences, and the test results are shown in Table 1.
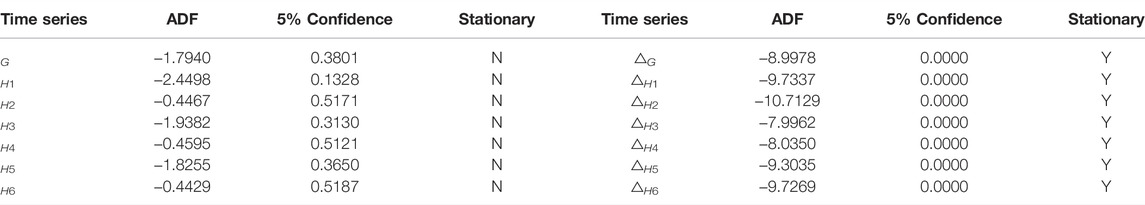
TABLE 1. Results of stationary test for DTSZ with high loss rate.
The Engle–Granger co-integration test was applied to G and H1-H6, respectively. Thereafter, the stationarity test of residual series was implemented with the ADF test. The stationarity test results of the residual series are listed in Table 2, and the shaded area in the table indicates that the result is less than the threshold of −3.4363.
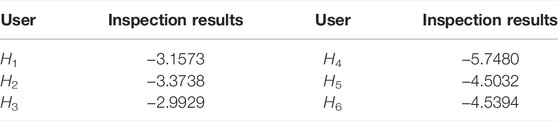
TABLE 2. Residual sequence smoothness test results of user and loss.
When the residual sequence is stationary, the regression equation between the corresponding variables is shown as above. In Eqs 4–6, T1 and T2 are the t-test values of corresponding parameters, R2 denotes the determinability coefficient,
After constructing the least squares regression model for H1–H6 and G, the co-integration test results show that the test value in the stationarity test of residual sequences of H1–H3 and G is greater than the threshold while that in the stationarity test of residual sequences of H4–H6 and G is less than the threshold, which indicates H4–H6 has a co-integration relationship with G. The subsequent Granger causality analysis can be continued, and the threshold refers to the critical value of McKinnon’s co-integration test (Pan, 2017). To further clarify the dynamic relationship between H4∼H6 and G, an error correction model among H4∼H6 and G is established, and the results are listed in Eqs 7–9. It can be observed that when H4–H6 fluctuates (increases) by 1% in the short term, H4–H6 will increase by 0.7040%, 1.2302%, and 1.1019%, respectively. According to the coefficient of error correction term, when the short-term fluctuation of H4–H6 and G deviates from the long-term equilibrium relationship among them, the non-equilibrium state among H4–H6 and G will be corrected to the equilibrium state with the adjustment force of −0.5700, −0.4457, and −0.4409, respectively.
where
where
where
The co-integration relationship among H4∼H6 and G and the error correction model were analyzed. It can be observed that the error correction coefficients in the three error correction models of H4∼H6 and G all conform to the reverse adjustment mechanism. Characteristics of long-term stability and the dynamic relationship between H4∼H6 and G with co-integration relationship are further clarified. Since there is a co-integration relationship between H4∼H6 and G, the causal relationship between their influences can be further analyzed with Granger causality analysis. Granger causality analysis results of edge computing are shown in Table 3. It can be observed that the significance of “H4 is not the Granger cause of G″ is less than the critical level of 5%, which indicates the null hypothesis is rejected. Therefore, H4 is the cause of the change of G, and H4 can be regarded as the anomaly user of electricity theft in the DTSZ. This has been verified by on-site inspection.
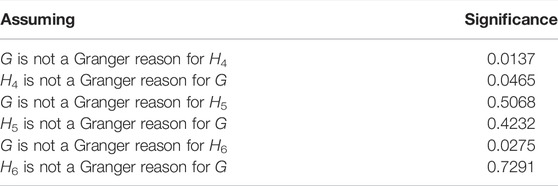
TABLE 3. Granger causality test results of edge computing.
4.2 Master Station Detection Comparative Experiment
When LV users suffer communication failure and upload metering data on the following day, the data at the head end of AMI is distorted with missing data and could cause misleading electricity theft detection results. In order to verify the superiority of the proposed approach, six industrial and commercial users in DTSZ were set to upload zero usage on the 30th day (28 January 2020) and upload usage on two consecutive days on the following day (29 January 2020). Therefore, the loss of DTSZ increased on the first day and decreased on the second day. The metered usage of each user and loss of DTSZ are listed as shown in Table 4. Granger causality test is used to test whether there is a correlation between each user and the loss of DTSZ based on distorted false data. The ultimate results of Granger causality analysis at the head end of AMI are shown in Table 5.
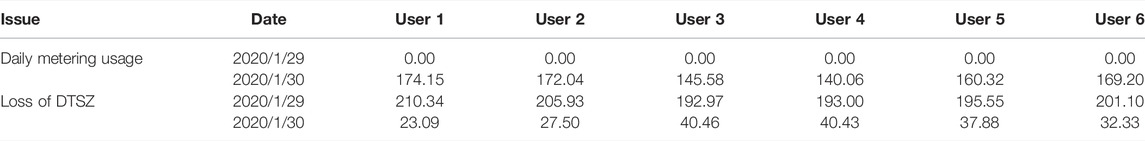
TABLE 4. Daily electricity usage of each anomaly user and loss of DTSZ.
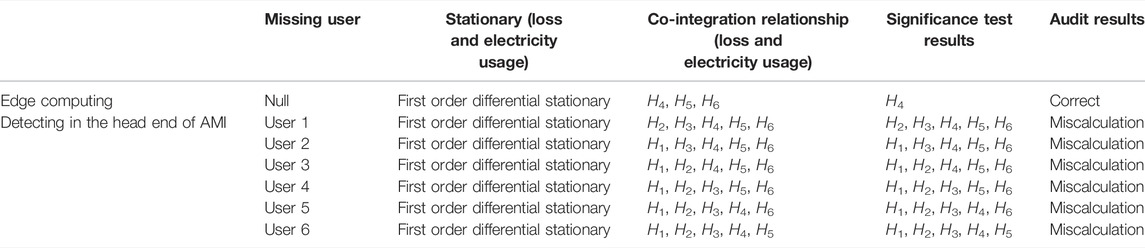
TABLE 5. Result of Granger attribution test at the head end of AMI.
It can be concluded from Table 5 and Schedules as follows.
When users suffer communication failure and fail to upload metering data, there is no co-integration relationship between the user’s electricity usage and loss of DTSZ. Therefore, we cannot analyze it with Granger causality analysis. The co-integration relationship between electricity usage of other users and loss of DTSZ remains, and they can be analyzed with Granger causality analysis.
Except for the user who suffers communication failure, all other users could be identified as anomaly users of electricity theft. Since user 4 has been confirmed to be the anomaly user of electricity theft by onsite inspection, once we identify the anomaly user of electricity theft with distorted data with data missing, the false positive rate escalates to 80%, which is not acceptable for industrial applications.
Missing data completion got broad research in recent years. Yang Y. et al. (2020) proposed a low-rank matrix theory based on matrix completion of power quality data. It designs a multi-norm joint low-rank optimization model and solves it with an alternating direction multiplier method. Zhao et al. (2020) proposed a tension completion based approach to recover missing data of multiple-user, and a low-rank tensor completion model was employed to recover missing data in DTSZ. It analyzes the characteristics of the LV data in DTSZ and constructs the standard missing tensor.
In order to find outperformance of matrix completion and Tensor completion, missing data of each user is recovered with these two approaches. The authentic usage and recovered usage with the two completion approaches are listed in Table 6. The authentic loss on 29 January and 30 January is 115.30 and 118.13 kWh, respectively. According to the user usage data recovered with correction, the loss of the DTSZ calculated with recovered data is listed in Table 7.
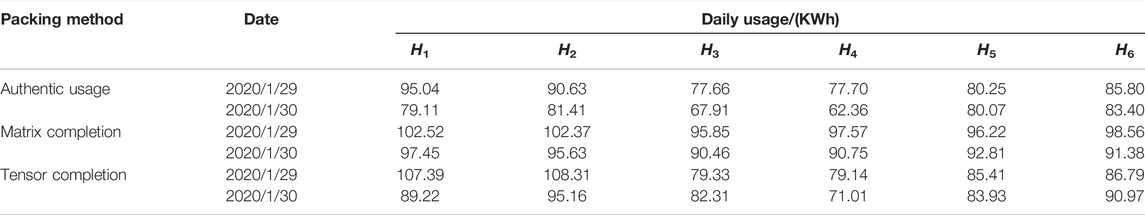
TABLE 6. Recovered electricity usage of each anomaly user.
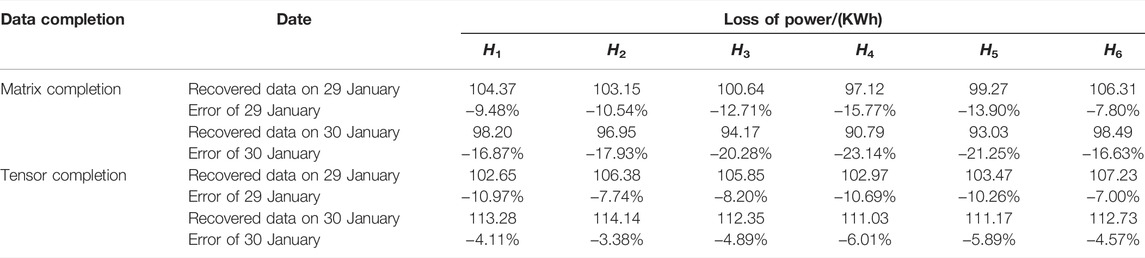
TABLE 7. Calculated loss for each recovered anomaly user.
It can be observed from Tables 6, 7 that although it is widely supposed that matrix completion and tensor completion can recover missing data ideally, its premise is that time series are of low rank. Missing data cannot be recovered precisely once there is no strong correlation between users’ usage data in the DTSZ. The data recovered with these two approaches are used to test whether the Granger causality test can accurately identify anomaly users of electricity theft. The Granger causality analysis results are listed in Table 8.
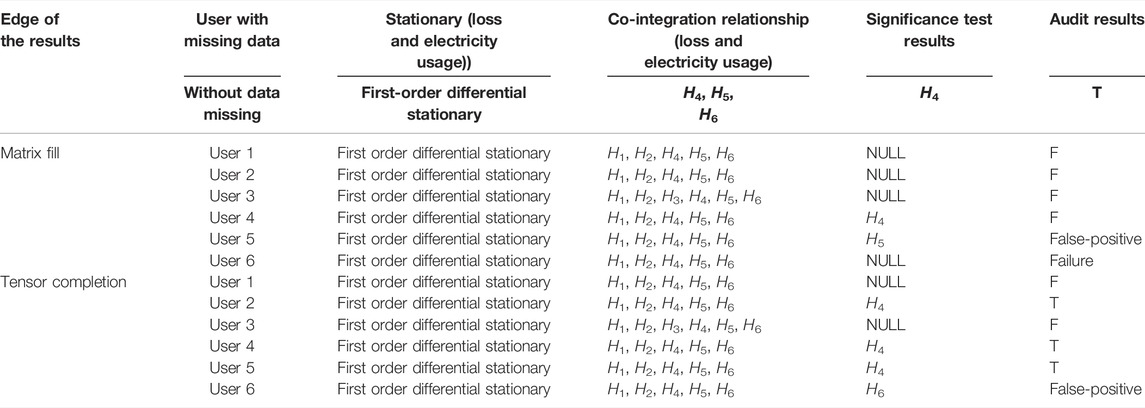
TABLE 8. Results of Granger causality analysis of anomaly user with data recovery.
It can be concluded from Table 8 as follows.
According to the data analysis with matrix completion, Granger causality analysis cannot identify any anomaly user of electricity theft once users H1–H3 or H6 suffer communication failure and recover with matrix completion. User H4 is correctly identified as an anomaly user of electricity theft once user H4 suffers communication failure and recovers with matrix completion. User H5 is incorrectly identified as an anomaly user once user H5 suffers communication failure and recovers with matrix completion. The accuracy rate of electricity theft detection with data in the head end of AMI declined to 16.6%.
According to the data analysis after tensor completion, Granger causality analysis cannot determine any anomaly user of electricity theft once user H1 or H3 suffers communication failure and recovers with tensor completion. User H4 can be judged as an anomaly user once users H2, H4, or H5 suffer communication failure and recover with tensor completion. User H6 can be misjudged as an anomaly user once user H6 suffers communication failure and recovers with tensor completion. The accuracy rate of electricity theft detection with data in the head end of AMI declined to 50%.
The goal of either matrix completion or tensor completion is to get the minimum norm of low-rank matrix/tensor. They recover data within a certain error range with higher linear correlation for the low rank of the data. It can be observed from Tables 5, 6 that there are notable errors in the recovered data of both algorithms. According to the Granger causality analysis by Jin et al. (2020), the one-to-one correspondence between electricity usage and loss of the detected user at the same time has a great influence on the final result, while both completion algorithms change correlation to a certain range, which results in the failure of Granger causality analysis–based approach.
In conclusion, both matrix completion and tensor completion based approaches cannot recover data missing ideally and could negatively impact the precision of Granger causality–based electricity theft detection. The proposed approach to implement electricity theft in DTU of DTSZ with edge computing could eliminate the impact of communication failure–induced difficulty and facilitate precise electricity theft detection.
5 Conclusion
The article analyzes communication failure’s impact on data missing in the head end of AMI and points out that the false metering data could negatively impact electricity theft detection of LV users in DTSZ. Edge computing–based approach is proposed to detect electricity theft of DTSZ in DTU with edge computing, which can identify anomaly users with authentic metering data in the edge and mitigate the difficulty of data recovery of missing/false data caused by communication failure. The real world metering data of a DTSZ is employed to produce distorted data caused by communication failure. Thereafter, produced data is recovered with matrix completion and tensor completion. Numerical simulation of these data shows that the Granger causality analysis–based approach could identify anomaly users of electricity precisely with authentic data in the edge. However, all users are identified as anomaly users of electricity theft once the false data in the head end system is utilized. Once false/missing data are recovered with matrix completion or tensor completion, the accuracy of the Granger causality analysis–based approach declines to 16.7% or 50%.
It should be pointed out that there is an anomaly LV user bypass meter, and its electricity usage is zero around the clock. Since there are numerous vacant apartments without electricity usage, it is rather difficult to detect these anomaly users since its meter data do not provide any useful information. We cannot detect these users precisely, even with authentic metering data. The way to identify these users requires further investigation.
Data Availability Statement
The raw data supporting the conclusion of this article will be made available by the authors, without undue reservation.
Author Contributions
YZ implemented numerical simulation and wrote the manuscript. FC helped collect low voltage users’ metering data. HY revised the manuscript, and SS proposed the edge computing‐based approach.
Funding
This research is supported by the National Natural Science Foundation of China (no. 51777015).
Conflict of Interest
FC is employed by Changsha Electric Power Corporation.
The remaining authors declare that the research was conducted in the absence of any commercial or financial relationships that could be construed as a potential conflict of interest.
Publisher’s Note
All claims expressed in this article are solely those of the authors and do not necessarily represent those of their affiliated organizations, or those of the publisher, the editors, and the reviewers. Any product that may be evaluated in this article, or claim that may be made by its manufacturer, is not guaranteed or endorsed by the publisher.
References
Chen, X., Mcelroy, M. B., Wu, Q., Shu, Y., and Xue, Y. (2019). Transition towards Higher Penetration of Renewables: an Overview of Interlinked Technical, Environmental and Socio-Economic Challenges. J. Mod. Power Syst. Clean. Energy 7, 1–8. doi:10.1007/s40565-018-0438-9
Covi, E., Donati, E., Liang, X., Kappel, D., Heidari, H., Payvand, M., et al. (2021). Adaptive Extreme Edge Computing for Wearable Devices. Front. Neurosci. 15, 611300. doi:10.3389/fnins.2021.611300
Deng, Y., Zhang, Y., Luo, F., and Mu, Y. (2021). Operational Planning of Centralized Charging Stations Utilizing Second-Life Battery Energy Storage Systems. IEEE Trans. Sustain. Energy 12, 387–399. doi:10.1109/tste.2020.3001015
Fan, H., Wang, Y., Li, Y., and Zhao, C. (2019). Sparse Fault Degradation Oriented Fisher Discriminant Analysis Based Fault Trace. Control Eng. China 7, 1239–1244.
Gong, G., Luo, A., Chen, Z., Luan, A., An, X., Wang, X., et al. (2018). Information Physical System of Active Distribution Network Based on Edge Computing. Power grid Technol. 10, 3128–3135.
Hu, T, GUO, Q, and SUN, H (2019). Nontechnical loss detection based on stacked uncorrelated autoencoder and support vector machine. Automation of Electric Power Systems 1, 119–125.
Huang, Y., Yu, H., Yin, J., Meng, G., and Cheng, Y. (2021). Electric Power Network Data Transmission Schemepresent Situation and the Outlook Based on 5G Technology. Trans. China Electrotech. Soc. 17, 3581–3593.
Jin, C., Su, S., Cao, Y., Xue, Y., Yang, Y., and Liu, X. (2020). Detection of Power Theft in High-Loss Areas Based on Granger Attribution Analysis. Automation Electr. Power Syst. 23, 82–89.
Jin, C., Su, S., Xue, Y., Yang, Y., Liu, X., and Cao, Y. (2022). Review on Data-Driven Based Electricity Theft Detection Method and Research Prospect for Low False Positive Rate. Automation Electr. Power Syst. 1, 3–14.
Li, B., Yan, K., Luo, F., and Lu, Y. (2018). Comprehensive Application of Optimal Benchmarking in Line Loss Lean Management of City-Level Power Grid Enterprises. Automation Electr. Power Syst. 23, 184–191.doi:10.7500/AEPS20180129003
Li, Q., Zhang, Y., Chen, J., Yi, Y., and He, F. (2020). Development Forms and Challenges of Ubiquitous Power Internet of Things. Automation Electr. Power Syst. 1, 13–22.
Liu, D., Zeng, X., and Wang, Y. (2020). Security Situation Assessment of Smart Distribution Transformer Terminal Based on Information Entropy. South. Power Grid Technol. 1, 18–23.
Liu, D., Liang, H., Zeng, X., Zhang, Q., Zhang, Z., and Li, M. (2022). Edge Computing Application, Architecture, and Challenges in Ubiquitous Power Internet of Things. Front. Energy Res. 10, 850252. doi:10.3389/fenrg.2022.850252
Nie, Z., Zhang, J., and Fu, H. (2020). Key Technologies and Application Scenarios Designed for Edge Modernization and Containerization of Distribution Transformer Terminals. Automation Electr. Power Syst. 3, 154–161.
Pan, Z. (2017). Time Series Analysis-Macroeconomic Data Analysis Model. Beijing: Economic Science Press, 121–145.
Partha, P. B., Hongyun, C., Zhou, B., Chen, B., Mashima, D., Zheng, V. W., et al. (2020). Electricity Theft Pinpointing through Correlation Analysis of Master and Individual Meter Readings. IEEE Trans. Smart Grid 4, 3031–3042.doi:10.1109/TSG.2019.2961136
Ruan, J., Liang, G., Zhao, J., Qiu, J., and Dong, Z. Y. (2022). An Inertia-Based Data Recovery Scheme for False Data Injection Attack. IEEE Trans. Ind. Inf. 1, 1. doi:10.1109/TII.2022.3146859
Shi, W., Cao, J., Zhang, Q., Li, Y., and Xu, L. (2016). Edge Computing: Vision and Challenges. IEEE Internet Things J. 3, 637–646. doi:10.1109/jiot.2016.2579198
Siamakz, D., Dougherty, E. R., and Xiao, N. Q. (2018). Optimal Bayesian Classification with Missing Values. IEEE Trans. Signal Process. 16, 4182–4192.
Song, X., Guo, Y., Li, N., and Qian, P. (2019). A Novel Approach for Missing Data Prediction in Coevolving Time Series. Computing 101, 1565–1584. doi:10.1007/s00607-018-0668-8
Sun, Y., Li, S., Cui, C., Li, B., Chen, S., and Cui, G. (2018). Detection Method of Power Data Outliers Based on Gaussian Kernel Function. Power Syst. Technol. 5, 1595–1604.
Sundararajan, A., Khan, T., Moghadasi, A., and Sarwat, A. I. (2019). Survey on Synchrophasor Data Quality and Cybersecurity Challenges, and Evaluation of Their Interdependencies. J. Mod. Power Syst. Clean. Energy 7, 449–467. doi:10.1007/s40565-018-0473-6
Tang, D., Liu, Y., Xiong, Z., Ma, T., and Su, T. (2020). Early Warning Method of Electricity Anti-theft in Distribution Station Area Based on the Spatiotemporal Correlation Matrix. Automation Electr. Power Syst. 19, 168–176.
Tian, S., Gong, T., Huang, X., and Yu, W. (2019). Based on the Power of Big Data Area E - GDP Value Prediction. Electr. power Autom. Equip. 11, 198–204.
Wang, H., Li, S., Yu, H., and Zhang, J. (2020). Power Quality Data Compression Storage Method for Distribution Network Based on Distributed Compressed Sensing and Edge Computing. Trans. China Electrotech. Soc. 21, 4553–4564.
Wang, S., Chen, H., Pan, Z., and Wang, J. (2019b). A Reconstruction Method for Missing Data in Power System Measurement Using an Improved Generative Adversarial Network. Proc. CSEE. 1, 56–64. doi:10.13334/j.0258-8013.pcsee.181282
Wang, Y., Chen, Q., Hong, T., and Kang, C. (2019a). Review of Smart Meter Data Analytics: Applications, Methodologies, and Challenges. IEEE Trans. Smart Grid 10, 3125–3148. doi:10.1109/tsg.2018.2818167
Yang, T., Li, Y., He, Z., Han, X., Pen, H., and Lu, Y. (2020b). Power Quality Data Repair Algorithm for Ubiquitous Power Internet of Things Based on Matrix Filling. Automation Electr. power Syst. 2, 13–21.
Yang, T., Zhao, L., and Wang, C. (2019). Review on Application of Artificial Intelligence in Power Systems and Integrated Energy System. Automation Electr. Power Syst. 1, 2–14.
Yang, Y., Qi, L., Wang, H., Su, L., and Xu, Y. (2020a). Measurement Data Missing Reconstruction in Distribution Network Based on Generative Antagonism and Dual Semantic Perception. Automation Electr. power Syst. 18, 46–54.
Zhang, C., Xiao, X., and Zheng, Z. (2019). User-side Power-Stealing Behavior Detection Based on Real-Valued Deep Confidence Network. Power Syst. Technol. 3, 1083–1091.
Zhao, H., Shou, P., and Ma, L. (2020). Tensor Completion Method for Missing Data in Low-Voltage Platform Region. Proc. CSEE. 22, 7328–7337.
Zheng, K., Chen, Q., Wang, Y., Kang, C., and Xia, Q. (2019). A Novel Combined Data-Driven Approach for Electricity Theft Detection. IEEE Trans. Ind. Inf. 15, 1809–1819. doi:10.1109/tii.2018.2873814
Zhong, J., Xiong, X., He, Y., Shan, R., Jian, H., and Li, S. (2021). A Plug-And-Play and Topology Recognition Method for Platform Intelligent Terminal. Automation Electr. Power Syst. 10, 166–173.
Zhu, J. Y., Sun, C., and Li, V. O. K. (2017). An Extended Spatio-Temporal Granger Causality Model for Air Quality Estimation with Heterogeneous Urban Big Data. IEEE Trans. Big Data 3, 307–319. doi:10.1109/tbdata.2017.2651898
Keywords: electricity theft, communication failure, edge computing, missing data completion, distribution transformer terminal, attribution analysis
Citation: Zheng Y, Chen F, Yang H and Su S (2022) Edge Computing Based Electricity-Theft Detection of Low-Voltage Users. Front. Energy Res. 10:892541. doi: 10.3389/fenrg.2022.892541
Received: 09 March 2022; Accepted: 25 April 2022;
Published: 08 June 2022.
Edited by:
Yunfei Mu, Tianjin University, ChinaReviewed by:
Lin Zhu, The University of Tennessee, Knoxville, United StatesGaoqi Liang, Nanyang Technological University, Singapore
Jian Liu, Wuhan University, China
Copyright © 2022 Zheng, Chen, Yang and Su. This is an open-access article distributed under the terms of the Creative Commons Attribution License (CC BY). The use, distribution or reproduction in other forums is permitted, provided the original author(s) and the copyright owner(s) are credited and that the original publication in this journal is cited, in accordance with accepted academic practice. No use, distribution or reproduction is permitted which does not comply with these terms.
*Correspondence: Sheng Su, ZWVzc2hlbmdAMTYzLmNvbQ==