
94% of researchers rate our articles as excellent or good
Learn more about the work of our research integrity team to safeguard the quality of each article we publish.
Find out more
ORIGINAL RESEARCH article
Front. Energy Res. , 26 April 2022
Sec. Wind Energy
Volume 10 - 2022 | https://doi.org/10.3389/fenrg.2022.888327
This article is part of the Research Topic Advanced Anomaly Detection Technologies and Applications in Energy Systems View all 64 articles
Under the excitement of wind loads, UHV transmission lines are subject to two types of vibration phenomena, namely, sub-span oscillation and galloping. This phenomenon can easily lead to conductor breakage, interphase flashover, fatigue damage to fittings, and even lead to tower collapse and disconnection accidents. The numerical analysis method is used to analyze the sub-span oscillation characteristics of the eight-bundle conductor during galloping. The results of the numerical simulation are compared to explore the influence of wind speed, span length, initial angle of wind attack, and turbulence intensity on the galloping line, looking for movement characteristics between each sub-conductor. The results provide a reference for research on the galloping principle of UHV transmission line and anti-oscillation to further improve the resistance of the power grid against disaster ability.
In recent years, there has been the problem of imbalance between power supply and demand (EPRI 2009; Li et al., 2021a; Li et al., 2021b; Li et al., 2022). Therefore, it is necessary to address ultra-long distance and cross-regional energy transmission. Of course, the safe operation of UHV transmission lines will be affected by the working environment. Due to the sudden change and complexity of the external environment, the normal operation of transmission lines faces serious challenges (Jafari et al., 2020). Aerodynamic instability of iced conductors with asymmetric cross-section area would cause iced conductors to gallop. This phenomenon is typical self-excited fluid–solid coupling vibration, which may cause breakage and short-circuit of transmission lines, or even tower toppling (Nigol et al., 1977; Cai et al., 2019a; Cai et al., 2019b). Research on the galloping phenomenon of UHV transmission lines is very limited, which cannot yet meet the actual engineering needs. In recent years, domestic scholars have begun to study the galloping mechanism of UHV transmission lines and its prevention and control technology, but much research work is still in the exploratory stage.
Numerical models for sub-span oscillation analysis of subconductors are usually dependent on quasi-stationary theory (QST). Since it is very difficult to design a corresponding small-scale model of transmission lines in a long-span length wind tunnel, numerical simulation is an effective method for studying wake-induced oscillation phenomena. Most researchers focused on the wake-induced oscillation responses of twin bundle conductors. Rawlins (1976) and Rawlins (1977) expressed the dynamic properties of twin conductors in the normal propagation mode using the transfer matrix method. Tsui and Tsui (1980) used the 2D and 3D finite element method (FEM) to study sub-span oscillation. Williams and Suaris (2006) presented an interference model to discuss the effects of space on aerodynamic response, and they highlighted that there were three dominant regions: the proximity interference region, induced sub-span oscillation region, and wake interference region. With the wide use of quad-bundle conductors, the sub-span oscillation of quad bundle conductors attracts the interest of researchers. Diana et al. (2014a) and Diana et al. (2014b) proposed a numerical approach to reproduce sub-span oscillation and investigated the quad spacer damper for controlling sub-span oscillations using aerodynamic coefficients obtained in wind tunnel tests. Although there are some studies on the oscillation of bundle conductors, the effects of complicated meteorological conditions of sub-span oscillation behaviors of bundle conductor transmission lines, especially eight-bundle conductors, require further investigation.
In recent years, lots of experts have studied the problem of galloping of transmission lines by numerical methods. Cai et al. (2015) studied the variation of the aerodynamic coefficient varying with the angle of wind attack by using the finite element method (FEM). Zhou et al. (2018) carried out a wind tunnel simulation to simulate the galloping of iced eight-bundle conductors and investigated different galloping behaviors of the parameters. Cai et al. (2019b) used the nonlinear FEM to analyze the galloping morphology of a sector-shaped eight-bundle conductor with different wind speeds, span lengths, and initial angle of wind attack. Talib et al. (2019) proposed a new dynamic model for the simulation of transmission line galloping. Liu et al. (2019), Liu et al. (2020a), Liu et al. (2020b), Liu et al. (2020c), Liu et al. (2021a), Liu et al. (2021b), Liu et al. (2021c), Liu et al. (2021d) and Liu et al. (2021e) and Min et al. (2021) obtained the aerodynamic coefficients of the conductor by applying the wind tunnel test and examined the stability and galloping characteristics of the iced conductor. The galloping behaviors of D-shape six bundles in the random wind test line are numerically simulated. Due to the continued existence of the galloping phenomenon and great harm, Oh and Sohn (2020) analyzed conductor galloping through the study of transmission line stability. Cai et al. (2020a) analyzed sector-shape eight-bundle conductor galloping through the FEM; furthermore, Cai et al. (2020b) analyzed galloping behaviors results of the test transmission tower-line.
Recently, there is still a lack of the influence of sub-span oscillation of iced eight-bundle conductors during galloping, especially the parameter analysis of UHV transmission lines under different turbulence intensity. In this article, the conductor galloping process of iced eight-bundle conductors is simulated by the numerical simulation method, the influence of wind speed and span length on sub-span oscillation during the conductor galloping process is analyzed, and the effects of wind speed, the angle of wind attack and the wind turbulence intensity are studied. Therefore, the follow-up research on galloping and anti-galloping characteristics of the frozen eight-bundle conductor has significant reference meaning.
Wind-driven wet snow may pack onto the windward sides of conductors, forming a hard, tenacious deposit with a sharp leading edge. The resulting ice shape may permit galloping. Combined with actual observation, the crescent shape can be generalized with respect to the great variety of natural heavy ice shapes (Hu et al., 2012; Yan et al., 2016). The aerodynamic forces of bundle conductors are the foundations of the analysis of the galloping of transmission lines (Liu et al., 2019). Here, the aerodynamic coefficients of crescent-shaped iced eight-bundle conductors are experimentally measured by wind tunnel tests.
Eight-bundle iced transmission lines are major research objects. The sub-spans of each span are the same. The conductor model is 8×LGJ-400/50, and the diameter of the sub-conductor is 30 mm. The model of the sub-spacer is FJZ-400, each with a mass of 17.5 kg. Its parameters are given in Table 1, and the model diagrams of 200- and 400-m lines are shown in Figures 1, 2.
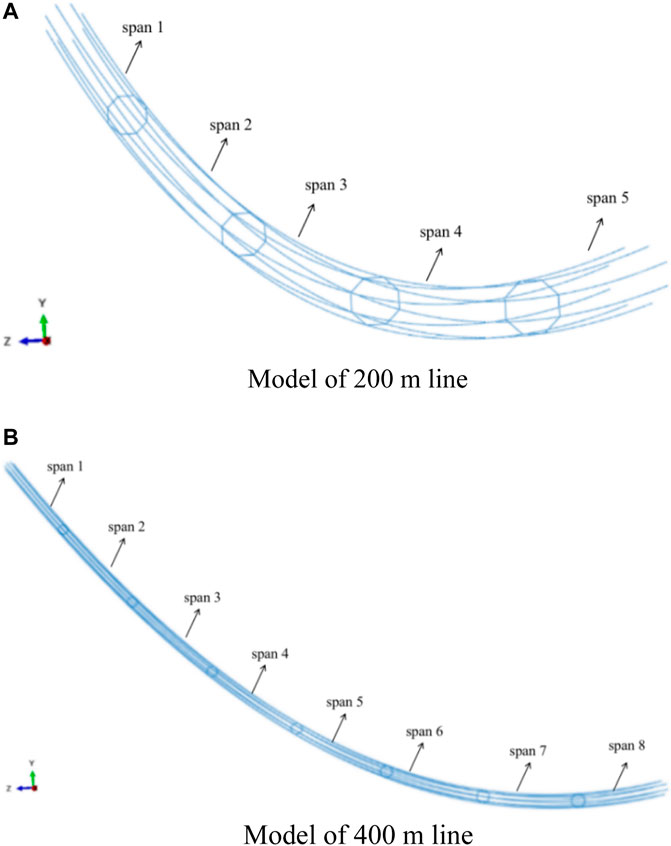
FIGURE 1. Model of the eight-bundle conductor line. (A) Model of the 200-m line. (B) Model of the 400-m line.
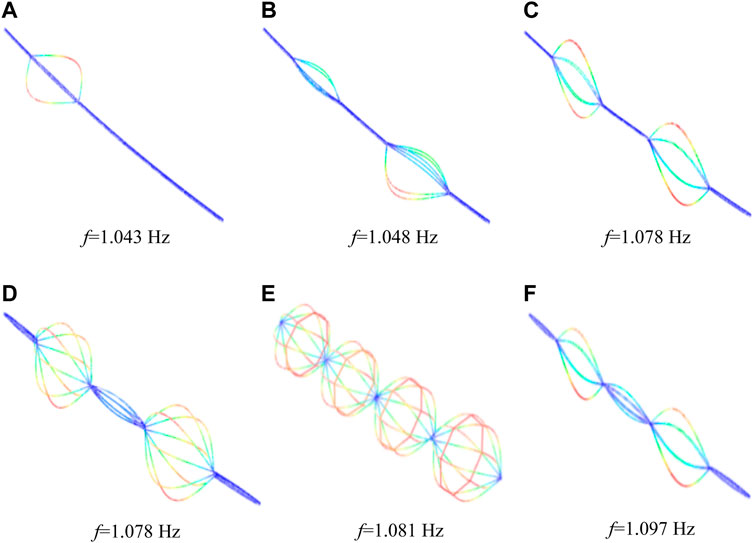
FIGURE 2. Typical partial mode 200-m span. (A) f=1.043 Hz. (B) f=1.048 Hz. (C) f=1.078 Hz. (D) f=1.078 Hz. (E) f=1.081 Hz. (F) f=1.097 Hz.
The physical parameters of conductors and ice are listed in Table 2. The cross section of the iced conductor is simplified as a circular section when the galloping of the iced conductor is simulated by ABAQUS software. It is noted that the axial rigidity, torsional rigidity, mass per unit length, and moment of inertia of the equivalent cable and those of the original cable should be equal, which can be expressed as
where E′, G′, ρ′, and d’ are, respectively, the elastic modulus, shear modulus, density, and diameter of the equivalent cable, which can be obtained by solving (1) whose right hand sides are the corresponding quantities of the original iced conductor. The physical parameters of the conductors and ice are listed in Table 2.
The influence of the initial axial tension in the main cable and side cable on the element stiffness matrix cannot be ignored. In addition, the cable sags due to its own weight, resulting in a certain decrease or loss of its elastic modulus. In order to consider the influence of cable sag, the concept of equivalent elastic modulus is used to modify the elastic modulus of the cable. The equivalent modulus of elasticity generally adopts the EErnst formula:
where EErnst is the equivalent elastic modulus of the material; E is the elastic modulus of the material; q is the weight of the unit length of the cable; l is the projection length of the cable element in the horizontal direction; A is the cross-sectional area of the cable; and T is cable tension.
The numerical simulations were carried out on a personal computer Dell Studio Desktop D540, and each process to arrive at a steady result took about 5 h. To speed up the efficiency, several simulations were submitted at the same time. The dynamic implicit analysis is used in the numerical method. The dynamic responses of the transmission line with different damping ratios in different directions are analyzed by ABAQUS with the user-defined cable element. The damping ratios ξz1, ξy1, and ξθ1, in the horizontal, vertical, and torsional directions are set to be 0, 0.5, and 2%, respectively, determined and verified by the reference (Zhou et al., 2016). The time step is set to be 0.01; we have already calculated that the step is set to be 0.005, and the error of the vertical amplitude is 2.74%. Considering the efficiency of the numerical simulation, the time step is set to be 0.01.
In the research, the aerodynamic parameters of the iced UHV transmission line are analyzed using the results of wind tunnel experiments (Yan et al., 2016). The aerodynamic forces are applied to the conductor to numerically simulate the galloping of the conductor. In the stiffness and massless user-defined element, the torsion angle, velocity, and displacement under the condition of applying aerodynamic force could help obtain the node of the cable element used in ABAQUS software (Zhou et al., 2016). The arrangement of the spacers is shown in Table 3.
The Rayleigh attenuation model is general for cable attenuation, shown in Eq. 3:
C, M, and K are damping matrices, quality matrices, and stiffness matrices, respectively. α and β is the Rayleigh damping coefficient, which are determined by the natural frequency and damping ratio. In order to improve the accuracy of the galloping characteristics, according to the previous literature (Hu et al., 2012, Cai et al., 2015) the calculation repetition time step is set to 0.01.
When the transmission conductor galloping occurs, the line is often accompanied by the vibration between the sub-spans in addition to the whole-span galloping. The natural frequency and mode affect the characteristics of conductor galloping (Zhang et al., 2000; Liu et al., 2021e). The natural frequency and whole-span mode are obtained, shown in Table 4. In the case of a transmission line with a distance of 200 m, the natural frequency of the in-plane single and half-wave 0.26 Hz is less than the natural frequency of the in-plane double half-wave 0.52 Hz, and the frequency of the in-plane single-half-wave is almost the natural frequency of the double half-wave; the natural frequency of the out-of-plane double–half-wave 0.52 Hz is less than the natural frequency of the out-of-plane four-half wave, and the natural frequency of the out-of-plane double half-wave is almost half of the natural frequency of the out-of-plane four-half wave; the natural frequency of the twist three-half wave is 0.83 Hz. It is nearly equal to the natural frequency of 0.80 Hz for the out-of-plane three-half-wave; for a line with a span of 400 m, the natural frequency of the in-plane single half-wave of 0.14 Hz is less than the natural frequency of the in-plane double half-wave 0.29 Hz, and the frequency of the in-plane single half-wave is nearly half of the natural frequency of the double half-wave. The natural frequency of the out-of-plane three-half-wave 0.43 is almost equal to the natural frequency of the torsional three-half-wave 0.48 Hz. The natural frequency of the in-plane double half-wave 0.52 Hz is the same as the natural frequency of the out-of-plane double half-wave 0.52 Hz. It is not difficult to find that in this case, there are 1:2 and 1:1 internal resonance conditions by analyzing the modal and natural frequencies of the 200- and 400-m spans.
It can be observed from the figure that a relatively dense natural frequency is concentrated in the frequency range of 1.043–1.138 Hz, with three directions of in-plane, out-of-plane and torsion, single half-wave, double half-wave, three-half-wave, four-half-wave wave, and several other modes [67]. For example: f = 1.043 Hz and f = 1.045 Hz are single half-waves, f = 1.048 Hz, f = 1.052 Hz, f = 1.138 Hz are double half-waves, f = 1.058 Hz and f = 1.097 Hz are three half-waves, and f = 1.081 Hz is four half-waves.
The galloping process of iced UHV transmission lines under a given wind velocity is analyzed by numerical simulation. The time history of the average displacement of the sub-conductor to iced eight conductors under the wind speed of 8 m/s with a span length of 200 m has been shown in Figure 3. At a wind speed of 8 m/s, because of the different aerodynamic forces between the conductors, the amplitude of the vibration in the vertical direction is more evident than the amplitude of the vibration in the horizontal direction. Among them, at a period of time after the beginning of the galloping, the galloping of the conductor tends to be stable, and the efficiency at which the horizontal galloping tends to stabilize is faster than the efficiency at which the vertical galloping tends to stabilize.
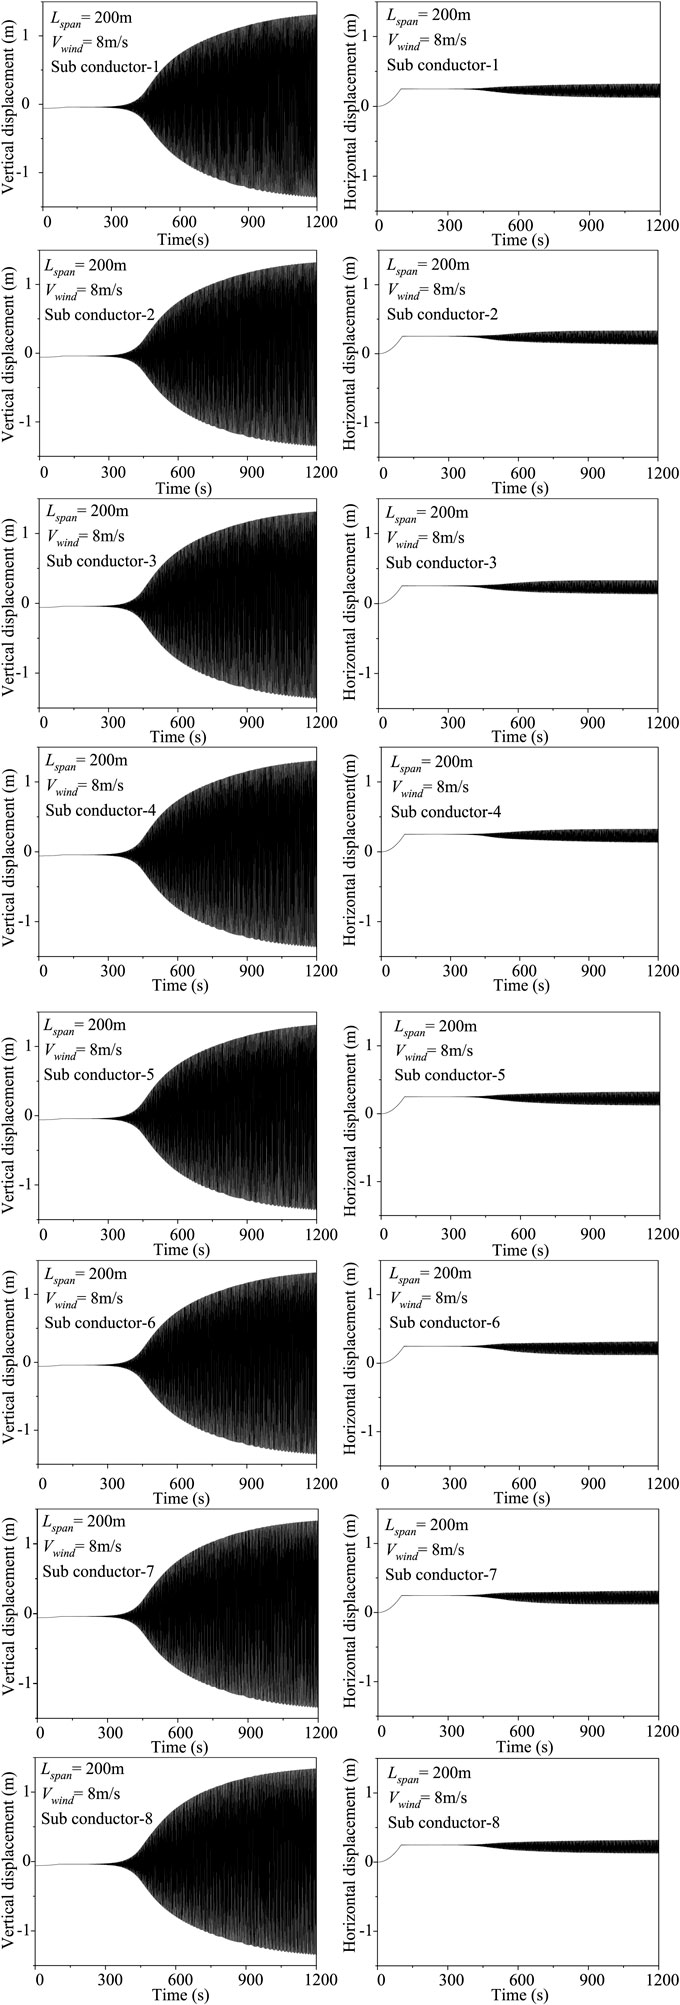
FIGURE 3. Time history of midpoint displacement of the iced eight-bundle conductor under a wind velocity of 8 m/s (200 m span).
Compared with the galloping dynamic response analysis (Table 3), the first prominent peak frequency in the secondary range is 0.45 Hz, which is close to the 0.52 Hz natural frequency of the in-plane double half-waves (Figure 4). The second apparent peak frequency is 0.82 Hz, which is close to the natural frequency of 0.80 Hz of the third out-of-plane half-waves (Table 2).
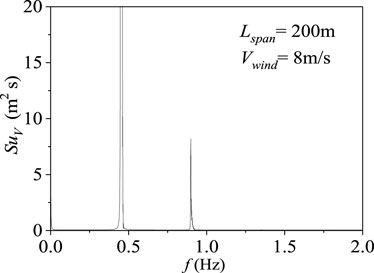
FIGURE 4. Displacement spectrum analysis of the midpoint displacement of the subconductor of the first span of the iced eight-bundle conductor of 200 m span length.
Under different wind velocities the vertical and horizontal amplitude of each subconductor during the line galloping process increased, and the amplitude of vertical vibration increases significantly, reaching 11 m. When the wind speed is 8 m/s, the vertical and horizontal displacement between the subconductors is approximately the same. When the typical wind speed is 12 m/s, the aerodynamic load of each iced subconductor is significantly different due to the interference of the wake. The amplitude of the vibration of each subconductor in the bundle is obviously different. As shown in Table 5, as the wind speeds increase, the horizontal vibration amplitude of the subconductors also increases correspondingly, but the increase rate is relatively slow compared to the vertical vibration amplitude.

TABLE 5. Vibration amplitude of each subconductor during line galloping under different wind velocities.
Figure 5 shows the change in the galloping distance of the subconductor at the intermediate point of the sub-span 3. The vertical vibration amplitude of the subconductor 5, subconductor 6, conductor 7, and subconductor 8 on the leeward side is greater than the vertical vibration amplitude of the subconductor 1, subconductor 2, conductor 3, and subconductor 4 at the leeward side. In the case of the wind speed of 12 m/s, the change of the galloping distance between the subconductors in the middle point of the sub-span 3 is shown in Figure 5. From the table, it can be found that at 400 s, the interval between the subconductors reaches the maximum, and then with the passage of time, the distance between the subconductors fluctuates closer; among them, conductor 1 and 2, conductor 5 and 6 is relatively long, and the distance between conductors 6 and 7 is relatively close.
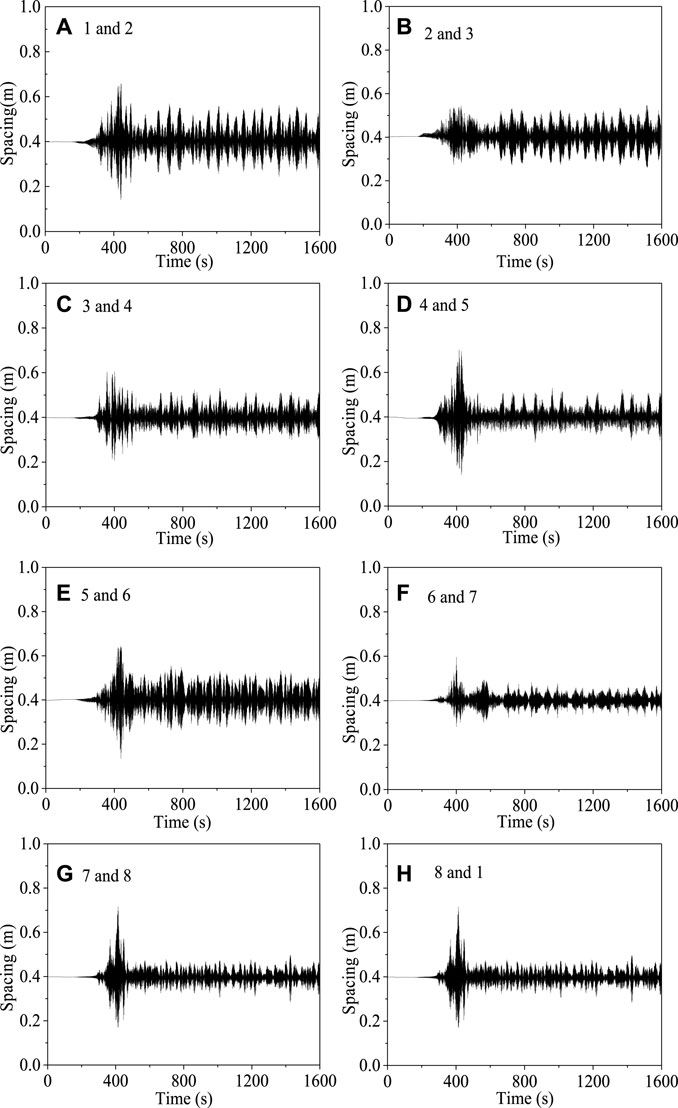
FIGURE 5. Variation of the galloping distance of the respective conductors at the midpoint varying with time when the wind velocity is 12 m/s.
In the wind tunnel experiment, it can be found that different turbulence intensities will lead to different aerodynamic coefficients of UHV transmission lines, and the Den Hartog and Nigol coefficients determined by the aerodynamic coefficients are also different (Den Hartog 1932; Nigol et al., 1977). The effect of different parameters on the galloping of UHV transmission lines is discussed, and the law of influence of wind speed, angle of wind attack, and span length on conductor galloping under the action of the turbulent wind is obtained.
Based on the aerodynamic coefficients obtained from the wind tunnel test (Cai et al., 2019b), the finite element method was used to study the effect of wind speed on the galloping of UHV transmission lines. Figure 6 compares the movement traces of each subconductor at the midpoint of the line span under the action of different wind speeds under the turbulence degree of 8.41% of the 300-m span and angle of wind attack of 20°.
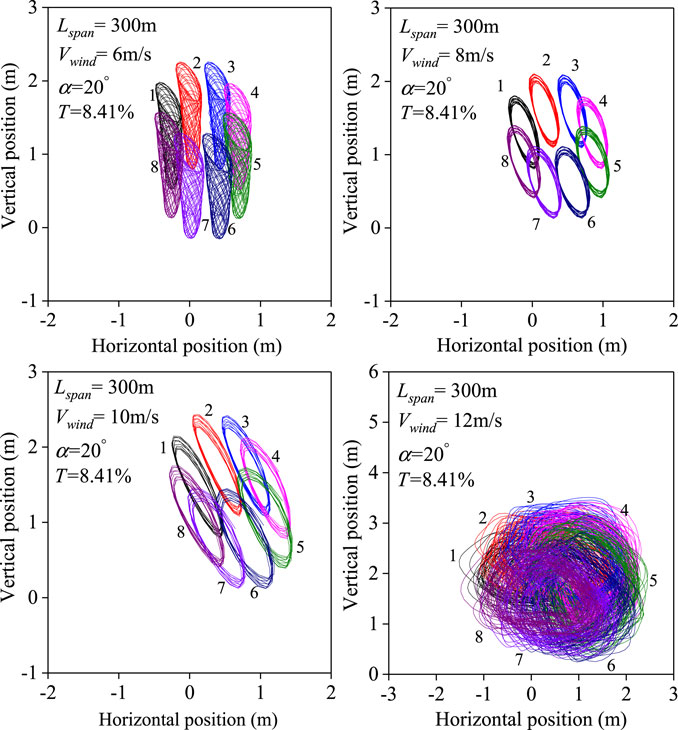
FIGURE 6. Galloping traces of the midpoint of eight-bundle conductors under different wind velocities.
Under higher wind velocity, a shorter time will be needed to reach the wake-induced oscillation state. It also increases the amplitude of vertical displacement, indicating that galloping can occur at high wind speeds (Figure 6). As the wind speed increases, the amplitude of the galloping vertical amplitude of the subconductor decreases, but the amplitude of the horizontal vibration gradually increases.
Figure 7 is the spectrum analysis diagram of the midpoint of the subconductor of the UHV transmission line under different wind speeds. Compared with the vertical displacement response spectrum analysis part, when the wind speed is 6 m/s, the first prominent peak frequency is 0.38 Hz, which is close to the natural frequency of 0.39 Hz of the in-plane single half-wave. The second prominent peak frequency appears (0.67 Hz), which is close to the natural frequencies of the in-plane and out-of-plane half-waves. In this case, the UHV transmission line has in-gear oscillation during the galloping process. On the other hand, when the wind speed is 12 m/s, the vertical displacement response spectrum has a special peak frequency of 0.41 Hz. It can be found that when the wind speed is high, the high-order vibration modes of the line vibration will be excited.
According to the relevant research on the influence of span length on the UHV transmission line, it can be known that the difference in span length can lead to the change of the galloping amplitude of the UHV transmission line. Table 6 shows the maximum galloping amplitudes of UHV transmission lines with 300- and 400-m span length when the wind speed is 12 m/s; the initial wind angle of attack is selected to be 20°, and the turbulence intensities are 0 and 8.41%. It can be seen that the galloping amplitude in the vertical and horizontal directions increases correspondingly with increase of span length.
According to the existing research on the conductor galloping phenomenon, it can be known that the difference of the initial attack of the wind angle will lead to the difference of the aerodynamic coefficients (Cai et al., 2019b). When the ice of the UHV transmission line is crescent-shaped, when the initial angle of wind attack is 15°–60° and 120°–180°, it presents an unstable state, and in actual conditions, the initial angle of wind attack being greater than 90° is rare. Table 7 shows the maximum galloping amplitude of the line when the wind speed is 12 m/s, and the initial angle of wind attack is 20° and 60°. The comparison shows that the vertical and horizontal amplitude of the UHV transmission line when the initial angle of wind attack is 60° is much larger than the vertical and horizontal amplitude when the initial angle of wind attack is 20°. Meanwhile, it can also be found that when other parameters are constant, the greater the turbulence intensity, the greater its horizontal and vertical amplitude.
The sub-span oscillation of iced eight-bundle conductors during galloping under different wind velocities, span length, initial angle of wind attack, and turbulence intensity is simulated and analyzed by using the FEM. The following conclusions can be obtained as follows:
1) The subconductors of the iced eight-bundle transmission line gallop in the same direction under different wind velocities, and the main oscillation direction is the vertical direction. Meanwhile, there is an oscillation in the sub-span during the galloping of the iced eight-bundle conductor, which may cause the subconductor to vibrate.
2) Due to the influence of wake disturbance and aerodynamic load, the amplitude of the oscillation of each subconductor is different. Under the same wind velocity, the vertical oscillation amplitude of the subconductor on the leeward side is greater than that on the upwind side.
3) The vertical and horizontal amplitudes of line galloping increase obviously with the increasing of wind velocity and span length; there are obvious differences in the galloping amplitude of the conductors, and the difference of the initial angle of wind attack will lead to a significant difference.
4) Under the influence of turbulence intensity, the line is more likely to gallop, the galloping trace of the conductor is elliptical, and the vibration amplitude of each sub-conductor has a difference under higher turbulence intensity. The amplitude of galloping increases significantly with the increase of wind velocity, and high wind velocity will excite higher-order vibration modes of line vibration under higher turbulence intensity.
The original contributions presented in the study are included in the article/Supplementary Material; further inquiries can be directed to the corresponding authors.
All authors listed have made a substantial, direct, and intellectual contribution to the work and approved it for publication.
This work was in part financially supported by the National Natural Science Foundation of China (Grant No. 515107106), Postdoctoral Research Foundation of China (2021M702371), Chengdu International Science and Technology Cooperation Support Funding (2020-GH02-00059-HZ), and Open Research Fund of Failure Mechanics and Engineering Disaster Prevention, Key Laboratory of Sichuan Province, Sichuan University (FMEDP202201).
Author ZL is employed by State Grid Sichuan Integrated Energy Service Co. Ltd.
The remaining authors declare that the research was conducted in the absence of any commercial or financial relationships that could be construed as a potential conflict of interest.
All claims expressed in this article are solely those of the authors and do not necessarily represent those of their affiliated organizations, or those of the publisher, the editors, and the reviewers. Any product that may be evaluated in this article, or claim that may be made by its manufacturer, is not guaranteed or endorsed by the publisher.
Cai, M., Yan, B., Lu, X., and Zhou, L. (2015). Numerical Simulation of Aerodynamic Coefficients of Iced-Quad Bundle Conductors. IEEE Trans. Power Deliv. 30 (4), 1669–1676. doi:10.1109/TPWRD.2015.2417890
Cai, M., Zhou, L., Lei, H., and Huang, H. (2019a). Wind Tunnel Test Investigation on Unsteady Aerodynamic Coefficients of Iced 4-Bundle Conductors. Adv. Civil Eng. 2019, 1–12. doi:10.1155/2019/2586242
Cai, M., Xu, Q., Zhou, L., Liu, X., and Huang, H. (2019b). Aerodynamic Characteristics of Iced 8-bundle Conductors under Different Turbulence Intensities. KSCE J. Civ Eng. 23 (11), 4812–4823. doi:10.1007/s12205-019-0359-9
Cai, M., Yang, X., Huang, H., and Zhou, L. (2020a). Investigation on Galloping of D-Shape Iced 6-Bundle Conductors in Transmission Tower Line. KSCE J. Civ Eng. 24 (6), 1799–1809. doi:10.1007/s12205-020-0595-z
Cai, M.-q., Zhou, L.-s., Xu, Q., Yang, X.-h., and Liu, X.-h. (2020b). Galloping Response of Sector-Shape Iced Eight Bundle Conductors. Can. J. Civ. Eng. 47 (10), 1201–1213. doi:10.1139/cjce-2018-0114
Diana, G., Belloli, M., Giappino, S., Manenti, A., Mazzola, L., Muggiasca, S., et al. (2014a). A Numerical Approach to Reproduce Subspan Oscillations and Comparison with Experimental Data. IEEE Trans. Power Deliv. 29 (3), 1311–1317. doi:10.1109/TPWRD.2014.2315444
Diana, G., Belloli, M., Giappino, S., Manenti, A., Mazzola, L., Muggiasca, S., et al. (2014b). Wind Tunnel Tests on Two Cylinders to Measure Subspan Oscillation Aerodynamic Forces. IEEE Trans. Power Deliv. 29 (3), 1273–1283. doi:10.1109/TPWRD.2014.2313455
Hartog, J. P. D. (1932). Transmission Line Vibration Due to Sleet. Trans. Am. Inst. Electr. Eng. 51 (4), 1074–1076. doi:10.1109/T-AIEE.1932.5056223
Hu, J., Yan, B., Zhou, S., and Zhang, H. (2012). Numerical Investigation on Galloping of Iced Quad Bundle Conductors. IEEE Trans. Power Deliv. 27 (2), 784–792. doi:10.1109/TPWRD.2012.2185252
Jafari, M., Hou, F., and Abdelkefi, A. (2020). Wind-Induced Vibration of Structural Cables. Nonlinear Dyn. 100 (1), 351–421. doi:10.1007/s11071-020-05541-6
Li, H., Deng, J., Feng, P., Pu, C., Arachchige, D. D. K., and Cheng, Q. (2021a). Short-Term Nacelle Orientation Forecasting Using Bilinear Transformation and ICEEMDAN Framework. Front. Energ. Res. 9, 780928. doi:10.3389/fenrg.2021.780928
Li, H., Deng, J., Yuan, S., Feng, P., and Arachchige, D. D. K. (2021b). Monitoring and Identifying Wind Turbine Generator Bearing Faults Using Deep Belief Network and EWMA Control Charts. Front. Energ. Res. 9, 799039. doi:10.3389/fenrg.2021.799039
Li, H., He, Y., Xu, Q., Deng, J., Li, W., and Wei, Y. (2022). Detection and Segmentation of Loess Landslides via Satellite Images: a Two-phase Framework. Landslides 19, 673–686. doi:10.1007/s10346-021-01789-0
Liu, X., Hu, Y., and Cai, M. (2019). Free Vibration Analysis of Transmission Lines Based on the Dynamic Stiffness Method. R. Soc. Open Sci. 6 (3), 181354. doi:10.1098/rsos.181354
Liu, X., Min, G., Wu, C., and Cai, M. (2020a). Investigation on Influences of Two Discrete Methods on Galloping Characteristics of Iced Quad Bundle Conductors. Adv. Civil Eng. 2020, 1–17. doi:10.1155/2020/8818728
Liu, X., Zou, M., Wu, C., Cai, M., Min, G., and Yang, S. (2020b). Galloping Stability and Wind Tunnel Test of Iced Quad Bundled Conductors Considering Wake Effect. Discrete Dyn. Nat. Soc. 2020, 1–15. doi:10.1155/2020/8885648
Liu, X., Zou, M., Wu, C., Yan, B., and Cai, M. (2020c). Galloping Stability and Aerodynamic Characteristic of Iced Transmission Line Based on 3-DOF. Shock and Vibration 2020, 1–15. doi:10.1155/2020/8828319
Liu, X., Liang, H., Min, G., Wu, C., and Cai, M. (2021a). Investigation on the Nonlinear Vibration Characteristics of Current-Carrying Crescent Iced Conductors under Aerodynamic Forces, Ampere's Forces, and Forced Excitation Conditions. Discrete Dyn. Nat. Soc. 2021, 1–22. doi:10.1155/2021/5009209
Liu, X. H., Min, G. Y., Sun, C., and Cai, M. Q. (2021b). Investigation on Stability and Galloping Characteristics of Iced Quad Bundle Conductor. J. Appl. Fluid Mech. 14 (1), 117–129. doi:10.47176/jafm.14.01.31417
Liu, X., Min, G., Cai, M., Yan, B., and Wu, C. (2021c). Two Simplified Methods for Galloping of Iced Transmission Lines. KSCE J. Civ Eng. 25 (1), 272–290. doi:10.1007/s12205-020-0693-y
Liu, X., Yang, S., Min, G., Cai, M., Wu, C., and Jiang, Y. (2021d). Investigation on the Accuracy of Approximate Solutions Obtained by Perturbation Method for Galloping Equation of Iced Transmission Lines. Math. Probl. Eng. 2021, 1–18. doi:10.1155/2021/6651629
Liu, X., Yang, S., Wu, C., Zou, M., Min, G., Sun, C., et al. (2021e). Planar Nonlinear Galloping of Iced Transmission Lines under Forced Self-Excitation Conditions. Discrete Dyn. Nat. Soc. 2021, 1–20. doi:10.1155/2021/6686028
Min, G., Liu, X., Wu, C., Yang, S., and Cai, M. (2021). Influences of Two Calculation Methods about Dynamic Tension on Vibration Characteristics of Cable-Bridge Coupling Model. Discrete Dyn. Nat. Soc. 2021, 1–11. doi:10.1155/2021/6681954
Nigol, O., Clarke, G. J., and Havard, D. G. (1977). Torsional Stability of Bundle Conductors. IEEE Trans. Power Apparatus Syst. 96 (5), 1666–1674. doi:10.1109/T-PAS.1977.32496
Oh, Y.-J., and Sohn, J.-H. (2020). Stability Evaluation of the Transmission Line by Using Galloping Simulation. Int. J. Precis. Eng. Manuf. 21 (11), 2139–2147. doi:10.1007/s12541-020-00399-5
Rawlins, C. B. (1976). Fundamental Concepts in the Analysis of Wake-Induced Oscillation of Bundled Conductors. IEEE Trans. Power Apparatus Syst. 95 (4), 1377–1393. doi:10.1109/T-PAS.1976.32233
Rawlins, C. B. (1977). Extended Analysis of Wake-Induced Oscillation of Bundled Conductors. IEEE Trans. Power Apparatus Syst. 96 (5), 1681–1689. doi:10.1109/T-PAS.1977.32498
Talib, E., Shin, J.-H., Kwak, M. K., and Koo, J. R. (2019). Dynamic Modeling and Simulation for Transmission Line Galloping. J. Mech. Sci. Technol. 33 (9), 4173–4181. doi:10.1007/s12206-019-0812-1
Tsui, Y. T., and Tsui, C. C. (1980). Two Dimensional Stability Analysis of Two Coupled Conductors with One in the Wake of the Other. J. Sound Vibration 69 (3), 361–394. doi:10.1016/0022-460X(80)90478-2
Williams, R. G., and Suaris, W. (2006). An Analytical Approach to Wake Interference Effects on Circular Cylindrical Structures. J. Sound Vibration 295 (1-2), 266–281. doi:10.1016/j.jsv.2006.01.023
Yan, B., Liu, X., Lv, X., and Zhou, L. (2016). Investigation into Galloping Characteristics of Iced Quad Bundle Conductors. J. Vibration Control. 22 (4), 965–987. doi:10.1177/1077546314538479
Zhang, Q., Popplewell, N., and Shah, A. H. (2000). Galloping of Bundle Conductor. J. Sound Vibration 234 (1), 115–134. doi:10.1006/jsvi.1999.2858
Zhou, L., Yan, B., Zhang, L., and Zhou, S. (2016). Study on Galloping Behavior of Iced Eight Bundle Conductor Transmission Lines. J. Sound Vibration 362, 85–110. doi:10.1016/j.jsv.2015.09.046
Keywords: galloping characteristic, iced eight-bundle conductors, multi-span transmission line, numerical simulation, sub-span oscillation
Citation: Yu L, Mengqi C, Qingyuan W, Linshu Z, Qian X, Shunli D, Jun L and Chunlin H (2022) Numerical Analysis on the Sub-Span Oscillation of Iced Eight-Bundle Conductors During Galloping. Front. Energy Res. 10:888327. doi: 10.3389/fenrg.2022.888327
Received: 02 March 2022; Accepted: 17 March 2022;
Published: 26 April 2022.
Edited by:
Yusen He, Grinnell College, United StatesReviewed by:
Cheng Liu, Shanghai Jiao Tong University, ChinaCopyright © 2022 Yu, Mengqi, Qingyuan, Linshu, Qian, Shunli, Jun and Chunlin. This is an open-access article distributed under the terms of the Creative Commons Attribution License (CC BY). The use, distribution or reproduction in other forums is permitted, provided the original author(s) and the copyright owner(s) are credited and that the original publication in this journal is cited, in accordance with accepted academic practice. No use, distribution or reproduction is permitted which does not comply with these terms.
*Correspondence: Wang Qingyuan, d2FuZ3F5QHNjdS5lZHUuY24=; Cai Mengqi, bXEuY2FpQGZveG1haWwuY29t
†This author have contributed equally to this work
Disclaimer: All claims expressed in this article are solely those of the authors and do not necessarily represent those of their affiliated organizations, or those of the publisher, the editors and the reviewers. Any product that may be evaluated in this article or claim that may be made by its manufacturer is not guaranteed or endorsed by the publisher.
Research integrity at Frontiers

Learn more about the work of our research integrity team to safeguard the quality of each article we publish.