 Zongqiang Fu
 Bin Li1
- 1Electrical Engineering College, Guizhou University, Guiyang, China
- 2Key Laboratory of “Internet+” Collaborative Intelligent Manufacturing in Guizhou Provence, Guiyang, China
Accelerating the penetration of renewable energy (RE) in energy consumption is an important method to realize the promotion of CO2 emission peaking and carbon neutrality. The energy transaction between two microgrids (MGs) makes up for the limitations that a single MG cannot deal well with the intermittence and fluctuation of RE in the real-time scheduling of the system. Multi-microgrids (MMGs) composed of multiple MGs have become an effective supplement to China’s power system. However, extreme weather and natural disasters can easily cause fault shutdown of wind turbines (WTs) and photovoltaics (PVs) in the microgrid (MG). To better balance the flexible load curtailment and satisfaction of MMGs, this paper proposes a coordinated scheduling model for MMGs. This model covers the WT, the PV, the fuel cell (FC), the energy storage system (ESS), and flexible load curtailment. First, the energy management system (EMS) of MMGs collects information on all the distributed generators’ output and three types of loads. The contribution bargaining game is applied to realize the energy transaction between each two MGs. Second, balancing multi-microgrid satisfaction and the profit of each MG is taken as the objective function, and the scheduling strategy of each MG is formulated. Also, an improved optimization method is applied to solve the amount of flexible load curtailment of each MG and realize the reasonable scheduling of MMG in the fault state. In the case study, the superiority of the model and the proposed method has been verified.
Introduction
To achieve peaking CO2 emissions by 2030 and carbon neutrality by 2060, China is improving the generation structure of the power system. To achieve peaking CO2 emissions by 2030 and carbon neutrality by 2060, China is improving the generation structure of the power system. In the power system, increasing the penetration of renewable energy (RE) in energy consumption can not only reduce CO2 emissions but also solve the problem of fossil energy shortages (Ghenai and Bettayeb, 2019). However, large-scale RE integration into the distribution network will affect the stability of the system, reduce the peak shaving ability of the system, and affect the power quality (Khenissi et al., 2020). The use of microgrids (MGs) can not only solve this problem but also advance the further development of RE (Güney, 2019). The promotion of microgrids (MGs) is an important way to absorb more RE, but a single MG cannot deal well with the intermittence and fluctuation of RE in the real-time scheduling of the system. For example, if the RE is in the intermittent period, wind turbines (WTs) or photovoltaic (PVs) will not work, which is defined as the fault shutdown state of WTs or PVs (Cao et al., 2021). The fault shutdown state of WTs or PVs usually results in an imbalance between the supply and the demand of the MG (Novoa et al., 2019). At this time, to balance the supply and demand of the MG, the system will curtail flexible load or use fuel cells (FCs), micro-turbines (MTs), and diesel generators (DGs). However, curtailing too much flexible load will reduce the electrical comfort of the consumers; excessive use of FCs and other equipment that consumes fossil fuels to generate electricity will not only reduce the economic benefits of the system but also cause environmental pollution (Mohandes et al., 2020). A smart distribution system consisting of multiple MGs has huge advantages in solving the above problem. In multi-microgrids (MMGs), the energy transaction among MGs not only reduces the power purchased by the faulty MG from the distribution network but also continues to provide power to users to a greater extent.
In Kong t al. (2020) and Liu et al. (2020), the cost-effective scheduling of the MMG in the normal status had been studied. At present, some scholars had turned their attention to the load recovery of MG after natural disasters (Wang et al., 2019; Nazemi and Dehghanian, 2020), but MG operation inevitably encountered other faults. The energy management system (EMS) could deal with the fault problems in the dispatching process (Marquez et al., 2021). Handling such problems can be divided into island division, load curtailment, economic dispatching of MG, etc. Islanding division divides the fault MG into its internal available parts. In the literature Oboudi et al. (2020), the probability model of MG was proposed under the islanded operation mode to divide the MG into self-sufficient islands. In Hosseinnezhad et al. (2018) and Beyza and Yusta (2021), the optimal division of MG for load curtailment after a power shortage caused by serious interference in the distribution network was discussed. A two-stage solution method was proposed to determine the division and removal of load, and the load priority and controllability were considered. In Rodrigues et al. (2020), it was studied that, in the case of MG fault, the longest operation time of island MG is the goal to improve the autonomy of island MG. The longest operation time meant that the satisfaction of MG needed to be sacrificed. As shown in Bagdadee and Zhang (2020) and Zhang et al. (2020), the MG reconfiguration scheduling method was used to reduce load interruption and power generation costs. Islanding division can divide the load according to the power provided by each region, but MG division will cause a great risk of power grid reconstruction, and islanding division is only to ensure the safety of the system. When islanding division, it is necessary to ensure that the number of switch changes is as few as possible; otherwise, it will cause multiple divisions, resulting in the satisfaction of the load that cannot be guaranteed.
A commercial solver was used to solve the mixed-integer linear programming to minimize the operation cost and coordinate multiple power carriers in the island mode (Li and Xu, 2018). This paper mainly studied the impact of output device on MG economy in the island mode. In the island mode, the load was fully supplied, and the full supply of load caused the economic loss of MG. In Moslehi and Reddy (2018) and Mishra et al. (2020), modeling the recovery capability of fault MG could better improve the recovery capability of the system, but the fairness of removal was not mentioned. Two stages were used to restore the critical load of the distribution network as much as possible when events with high impact and low probability occurred (Kahnamouei and Lotfifard, 2021). As discussed in Lei et al. (2019) and Afrakhte and Bayat (2020), the backup power supply such as the energy storage system (ESS) and electric vehicles was used to reduce load curtailment. Although load curtailment was improved, the backup power supply increased the installation and operation costs. Load curtailment was usually related to MG satisfaction. Curtailing too much flexible load reduced the MG satisfaction, and curtailing too little flexible load increased the cost of MG. To meet MG satisfaction or the economic profits of MG operators, it is necessary to balance the flexible load curtailment of MG and the economic profits of MG operators.
The economic scheduling of MG dispatches the internal output device with the economic operation of MG as the core, to meet the constraints and cut off the load. Nelson et al. (2020) studied the economy of MG from the perspective of the generator set and showed that, under island operation, the hybrid MG was more economical than pure generator MG, which improved the resilience of MG. In the case of the island, the charge state of the ESS will supplement the fault of the generator set and affect the resilience of MG. As discussed by Goyal and Ghosh (2016) and Hamzeh Aghdam et al. (2018), the emergency problem of the fault of distribution network operators was considered, and the power complementarity between MMGs was studied to reduce unnecessary load curtailment. The article did not consider the problem of load curtailment caused by insufficient energy. Wang and Wang (2015) proposed a two-stage stochastic rolling optimization model, which maximized the profit of MG during fault operation by scheduling the output of controllable distributed generation and ESS. In the fault period, the economic dispatching of MG meant that the power provided by the operator for the load could not affect its profit; otherwise, the load would be cut off to ensure the profit of MG, and the relationship between MG satisfaction and profit should not be ignored (Xu et al., 2020; Chen et al., 2021).
Bi-level programming is one of the commonly used methods to solve MGs. In Lyu et al. (2020), the upper layer reduced the power loss of energy mutual assistance between MGs by optimizing the use of controllable power supply of MG, and the lower layer suppressed the impact of power fault on MMGs through the economy of MG. Lai et al. (2019) studied the impact of ESS on emergencies to reduce the load of the system. Bi-level programming was used to improve the economy of the system. Bi-level programming needed information iteration between attackers and schedulers, which enhanced the complexity of the system. Ahmadi et al. (2020) studied the schedulable distributed generator and emergency load shedding self-healing scheduling method of MMG. The upper EMS was responsible for the optimization of MMG, and the lower EMS was responsible for the self-healing of MG in case of fault. The use of bi-level optimization simplified the calculation of the target, but the information was needed to be transmitted back and forth between the MMG EMS and the MG EMS, which improved the complexity of system calculation and was easy to cause the problem of information leakage. In addition, Jiang et al. (2020) and Qiu et al. (2020) carried out the recovery process in stages to reduce the operation cost and load curtailment of MG.
Compared with the existing studies, the main contributions of this paper are listed as follows:
• The MMG satisfaction model is established so that the MMG with different load types can cut off the flexible load according to the MG satisfaction.
• A contribution bargaining game is established to make the energy transaction between MGs fairer and enable MGs to actively participate in the transaction.
• Combining the two objective functions of MMG satisfaction and MG profit, the optimization method is used to balance the removal of MG flexible load and MG profit.
• The utilization rate of RE is improved, and the output of traditional generator sets is reduced.
The rest of this paper is organized as follows. Multi-Microgrid Model describes the MMG model. In Optimization Model, the objective function and constraints are given. Results and Discussion analyzes and discusses the results. Conclusion concludes this paper.
Multi-Microgrid Model
Distributed generations are the basic component of MMG, and it is necessary to analyze their output characteristics and working principles to establish the corresponding models. In this paper, the MMG includes the WT, PV, FC, and ESS. The following is the analysis and modeling of distributed generation in the system.
WT Model
WT is a device that can convert wind energy into electric power, which can realize RE to replace traditional power generation and effectively realize the goals of peaking CO2 emissions and carbon neutrality. The blade rotation of the WT drives the generator set to generate electricity. The blade rotation is affected by the wind speed, and the control system adjusts the working state according to the power generated by the wind turbine generator. For example, when the generator output is above 15% of the rated power for 10 min and above 50% of rated power for more than 2 s, the wind speed is lower than 3 m/s and the mechanical brake stops power generation. However, the wind speed is intermittent and uncertain, which changes with the changes of meteorological and topographic factors such as temperature, landform, and atmospheric pressure. The relationship between the actual power generated and the wind speed is shown as follows (Guofa, 2020):
where
PV Model
A PV generator is a device that can convert solar energy into electric power. Like the WT, it could reduce carbon emissions. In addition, it has no noise pollution and has free location distribution. It can be installed in buildings, houses, and other places. Similarly, PV output is affected by natural conditions such as light intensity and ambient temperature; under standard temperature and light intensity, the light intensity is less than 20%, PV is in a fault shutdown state, and power generation is stopped. The relationship between actual PV output
where
FC Model
FC is a device that converts the chemical energy of fuel and oxidant into electrical power by chemical reaction. Compared with the WT and PV, the FC has the advantages of fast response and stable power supply, while the disadvantage is that it will produce pollution while burning natural gas to provide power. However, the output cost and conversion efficiency will affect the output of FC, as shown by
where
ESS Model
The ESS converts power into other forms or the same form through chemical or physical methods, stores it in the equipment, and releases it when necessary. In the power system, the combination of distributed generation and ESS can not only improve the consumption of RE but also overcome the intermittence and uncertainty of RE. When the battery is in use, the charge state is used to represent the electric quantity. The charge state during charge and discharge is shown as
where
Optimization Model
The WT and PV are always affected by the weather in their daily work (Amirioun et al., 2019), resulting in uncertainty and intermittence in their power generation, which often stops working, bringing great trouble to dispatchers. This paper takes MG1, MG2, and MG3 as the research objects, which are composed of industrial, residential, and commercial loads, respectively. As shown in Figure 1, black lines indicate the power flow within the distribution network, the green signal flow represents the information exchange between the MG EMS and the MMG EMS, and the blue line represents the power flow between MGs, including the output information of WT, PV, FC, ESS, and load. The load can be divided into flexible load and rigid load (Wu and Wang, 2018). Rigid load refers to the part of power demand that cannot be curtailed, such as lighting, elevator, emergency light, and other electrical equipment. Flexible load refers to the load that can be coordinated or transferred according to the energy of the power grid. For example, the washing machine is arranged to wash clothes at night during low peak hours and the air conditioner is adjusted to reduce power during peak hours. When the industrial MG is intermittent and uncertain of RE, the WT and PV are stopped. At this time, the connection switch is turned on for a short time to purchase energy from other MGs. After meeting the load demand, the connection switch is turned off to prevent power flow. The coordination and interaction between MGs make the flexible load curtailment satisfaction of MMG reach a balance with the profit of MG.
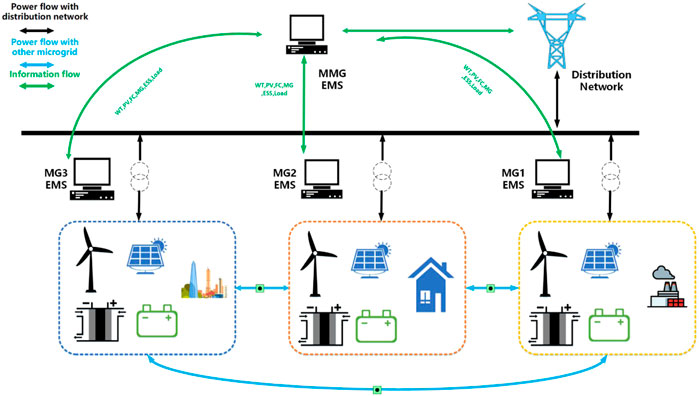
FIGURE 1. Topology of the MMG.
MMG Satisfaction
In the fault state, due to the limitations of generator sets and power connecting lines, the EMS of MMG needs to cut off the flexible load to ensure the safety and economy of MG. However, the flexible load curtailment of MG will reduce the satisfaction of MG and affect the user experience and the safety of the MG. The more flexible loads are curtailed, the lower the satisfaction of the MG. Therefore, the satisfaction of the MMG is shown as (Kaijun and Junyong, 2018)
where
Transaction Strategy Between MGs
The MG is connected through the power connection line. When there is a transaction between MGs, the logic switch of the power connection line is turned on for power transmission; otherwise, it is turned off, which can promote the consumption of RE and reduce the removal of flexible load. The transaction between MGs affects the removal of flexible load and then affects the satisfaction of MG. At the same time, if there are too many energy transactions, it will affect the profit of MG. Therefore, to reflect the fairness of the transaction between MGs, the energy transaction between MGs is carried out using a contribution bargaining game according to the power output information of each unit of MG by the EMS, as follows:
where
Dispatching Profit of Each MG
The MG EMS receives the output information from the MMG EMS, manages the output of FC, WT, PV, and ESS, loads in the MG, and achieves the goal of maximizing its profits. The cost of purchasing reactive power and other auxiliary services from the distribution network is not considered in this paper. The management strategy is shown in Figure 2. The dispatching profit of each MG can be expressed as follows:
where

FIGURE 2. Energy management strategy diagram.
Evaluation Index of RE Utilization
To evaluate the ability of MMG to absorb RE, this paper proposes the utilization rate of RE (URRE) as the evaluation index, which can be defined as follows:
where
Objective Function
The MG sends the information of each unit to the MMG EMS for optimization. There is no need to transfer information back and forth between the MG EMS and the MMG EMS, as shown in Figure 3. Using the contradictory relationship between the profit of MG and the satisfaction of MMG, a balance point needs to be found between the individual profit of MG and the overall satisfaction of MMG to ensure their rationality. Therefore, the objective function can be expressed as follows:
where
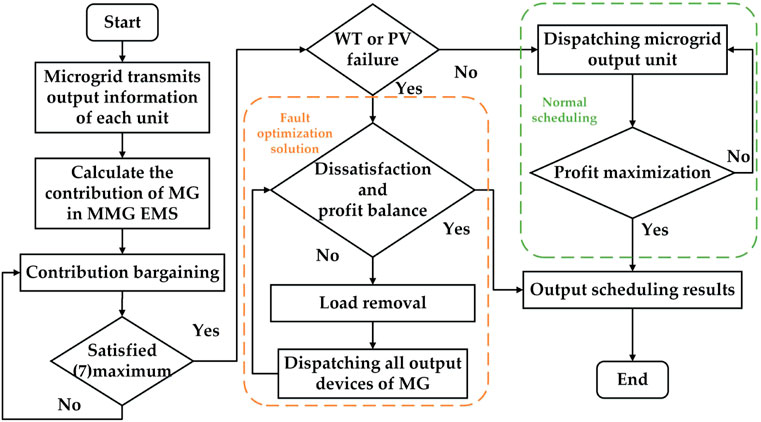
FIGURE 3. Optimization solution flow chart.
Constraint
The EMS of MMG considers not only the flexible load curtailment of each MG but also the transaction balance constraints between MGs. Eqs. 13, 14 are the flexible load curtailment constraints of each MG:
where,
Eqs. 15–17 are the power purchase and sale constraints between MGs, that is, the energy purchase and sale shall be within the maximum acceptable range of MG, to prevent simultaneous purchase and sale of energy and earn intermediate profit:
Eq 18 is the balance constraint. The power balance of MG is the basic condition to ensure system safety and user experience, which includes the energy purchase from the distribution network and FC, WT, and PV generator output limits:
To ensure the service life, safety, and reliability of the battery during use, it must also be restrained as follows:
where
Results and Discussion
Designed Scenario
This paper takes MG1, MG2, and MG3 as the research objects, which are composed of industrial, residential, and commercial loads, respectively. These loads have different demand characteristics, in which the industrial load includes 10% flexible load and the commercial load includes 20% flexible load. According to the importance of load, the satisfaction sensitivity of the three loads is also different. The industrial load sensitivity is the highest, the commercial load is the second, and the residential load is the last. The 15 min load active power demand curve is shown in Figure 4. The commercial load peak is 09:00–18:00, the residential load peak is 18:00–23:45, and the industrial load peak is 08:00–18:00. The wind speed and light intensity conditions of the three MGs are quite different. The 15 min PV and WT output curves are shown in Figure 5. The intermittent RE of MG 1 occurs at 10:00–15:00, resulting in the fault shutdown of the WT and PV generator. The installed capacity of each unit of MG is shown in Table 1. The experimental environment uses Intel (R) Core (TM) i7-6700hq CPU @ 2.60GHz, Matlab (2020) commercial fmincon solver.
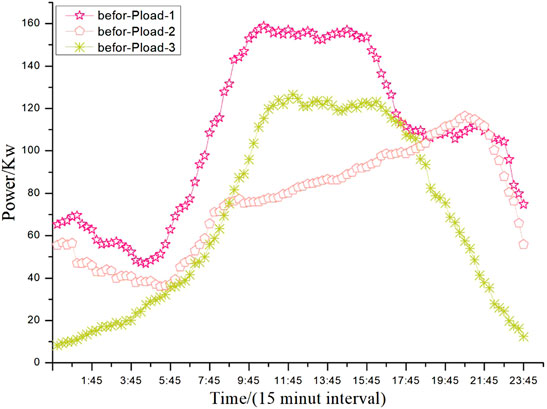
FIGURE 4. 15 min active power demand curve.
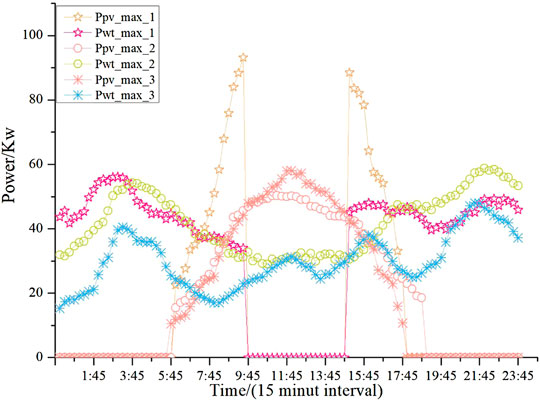
FIGURE 5. Output curve of the 15 min PV and WT.
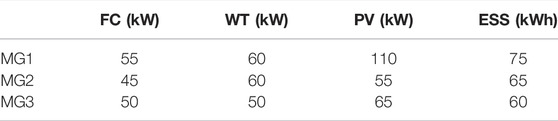
TABLE 1. Installed capacity of each MG.
Analysis of Flexible Load Curtailment and Dispatching Results
According to the satisfaction of MMG and the balance of MG profit, the flexible load is cut off, as shown in Figure 6. At 10:00–15:00 MG1, the RE is intermittent, resulting in the fault shutdown of WT and PV. To ensure the safety constraints and economy of each MG, the flexible load of each MG is cut off. MG1 supplies the industrial load. At this time, the energies purchased from the distribution network, the use of FC, and the energies purchased from other MGs reach the limit. At this time, the satisfaction with the MG has been very low, so the load is restored to the limit value of 124.57kw. MG2 supplies the residential load. During this period, it belongs to the flat valley period of power consumption. In other periods, when the energy is insufficient, it is necessary to purchase energies from the distribution network or use FC to meet the load demand. Therefore, the flexible load is cut off to ensure the profit of each MG2. The supply of commercial load by MG3 belongs to the peak period of power consumption at this time. However, in order to improve the satisfaction of MG1, it is necessary to sell power to MG1, resulting in a shortage of RE. Like MG2, it is necessary to use FC or purchase energies from the distribution network to meet the load demand and ensure its own profit.
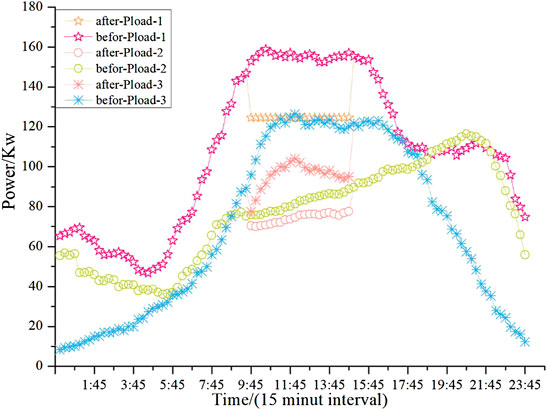
FIGURE 6. Flexible load curtailment curve.
The dispatching of each MG in the fault state is shown in Figures 7–9. MG1 faults during peak power generation of WT and PV, resulting in no surplus energy for MG to sell energies to other MGs. Although there is surplus RE at 03:30, 03:45, and 04:15–04:45, other MGs also have surplus RE at this time and do not trade energy. At 0:00–2:15, 05:00–06:15, and 21:45–23:45, MG1 purchases energy from MG3 and MG2, respectively, to meet their own load demand.
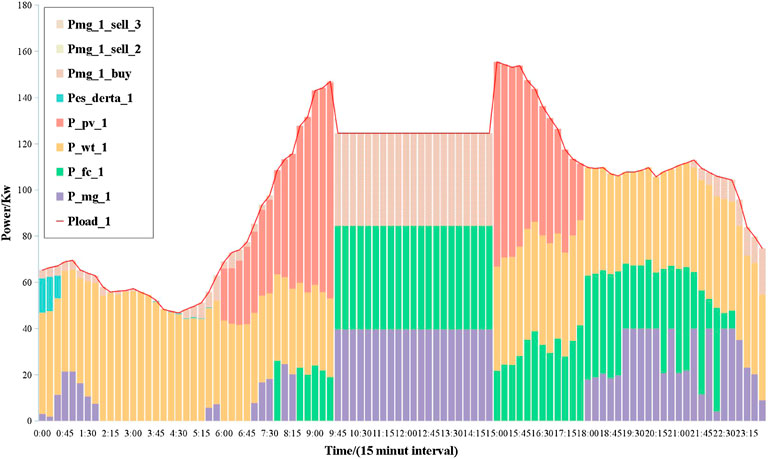
FIGURE 7. Power balance of MG1.

FIGURE 8. Power balance of MG2.
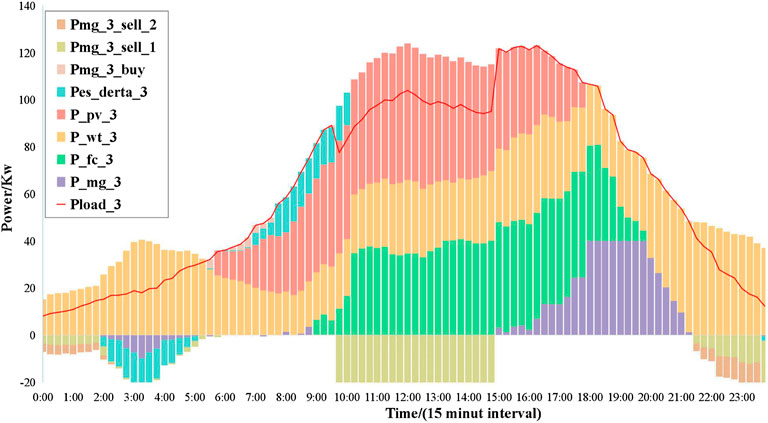
FIGURE 9. Power balance of MG3.
MG2 has surplus RE at 04:15–07:30, and at 03:00–04:45, other MGs also have surplus RE. At this time, MG2 charges the power storage. Due to the limitation of the power of the ESS, it cannot fully absorb the RE, so it sells the excess RE to the distribution grid, and at 05:00–07:30, it gives priority to selling energies to other MGs; after other MGs meet the load demand, they charge the ESS and finally sell energies to the distribution network. At 07:15–07:30, the bargaining transaction distribution mode, the energy sales to MG1 and MG3 tend to be evenly distributed. At 05:45, 06:30, and 06:45, MG3 wants to buy a large number of energies. If most RE is sold to MG3 at this time, the energy purchase revenue of MG1 will be reduced, the principle of fair bargaining is destroyed, and the negotiation breaks down. Only after the energy purchase of MG1 is satisfied, MG3 can purchase a large amount of purchase. At 00:00–00:45, MG3 has surplus RE, but the energy of MG3 cannot fully meet the demand of MG2. The ESS is used to discharge to meet the load demand. At 08:00–09:00 and 14:30–16:15, other MGs have no surplus RE and MG2 uses the energy stored by the ESS. At 21:45–23:45, MG2 is short of energy, but MG3 has surplus energy, so energy is purchased from MG3 to meet the demand of the load. From 10:00 to 15:00, to meet the load demand of MG1, MG2 sells RE to MG1 and meets its load demand through FC or purchasing energies from the distribution network.
MG3 has surplus RE at 00:00–05:30 and 21:45–23:45. Among them, 00:00–02:00 and 21:45–23:45 are insufficient, and MG3 sells energies to them. Similarly, it tends to be evenly distributed before one party fails to meet the energy purchase demand. A lot of energy can be purchased only after MG3 meets the demand, such as at 23:45. At 2:30–04:45, the energy of MG1 and MG2 can meet their own needs. At this time, MG3 charges the excess energy to the ESS; at 08:00–10:15, RE cannot fully meet the load demand, and ESS has a priority to releasing power to meet the load demand. After 10:00–15:00, MG1 fails and MG3 sells energies to MG1, and the FC is used to meet its own load demand in order to balance MG3 satisfaction and profit.
As shown in Figure 6 and Table 2, taking 23:00 and 23:45 as examples, at this time, MG3 has surplus RE, and the total number of RE is less than the sum of the demand for MG1 and MG2. MG1 needs a large number of RE. If MG3 sells a large number of RE to MG1 (strategy 1), MG2 has a small energy purchase and energy purchase income, which violates the fairness of bargaining, and the bargaining negotiation breaks down. At the time of 23:45, MG3 has surplus RE, and the total number of RE is greater than the sum of the demand for MG1 and MG2. Due to power restrictions, MG2 needs a little energy, so MG1 obtains more energy. This bargaining distribution model can reasonably distribute the MG3 surplus RE to other MGs.
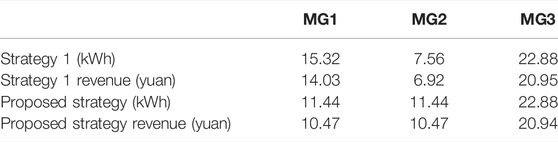
TABLE 2. Comparison of transactions between MGs.
As shown in Table 3, during the fault period, since the load curtailment of MG1 reaches the constraint boundary, both the strategy in this paper and the complete removal strategy reach the limit value. Although the dispatching of MG1 is in a loss state, the removal number of such flexible load can make MG1 the most satisfactory. When MG2 and MG3 are fully restored, no load is cut off to achieve the most satisfaction because their profits are sacrificed to improve the satisfaction of MMG. The strategy of this paper is to obtain more profits by balancing satisfaction and income and reducing satisfaction.

TABLE 3. Comparison of satisfaction and profit between MGs.
The utilization rate of renewable energy is shown in the Table 4. The transaction between MG not only reduces the removal of load but also increases the utilization rate of renewable energy. Due to the fault of MG1 during the peak period of renewable energy power generation, the energy utilization rate is the highest and the wind and light abandonment are the least; MG2 and MG3 sell surplus renewable energy to MG1, increasing the consumption of renewable energy. Their energy utilization rates reached 99.81%, 98.73%, and 98.91% respectively.

TABLE 4. Comparison of energy utilization.
Comparison of Solution Methods
Comparing Figure 6 with Figure 10, the bi-level programming method curtails more flexible loads from MG2 in exchange for its profits. However, as shown in Table 5, MG2 will obtain a small number of profits by removing more flexible loads; MG3 cuts off a little flexible load in exchange for higher satisfaction. Compared with bi-level programming, the optimization solution method does not require information exchange between the MMG EMS and the MG EMS. In bi-level programming, the MGs can only coordinate their own output devices and cannot coordinate the three MGs from the perspective of the MG EMS. As a result, the total profit and total satisfaction of the MMG are not reasonably distributed. As shown in Table 5, the optimized solution method can make the income difference after the flexible load of MMG is cut off larger than that of the bi-level programming method.
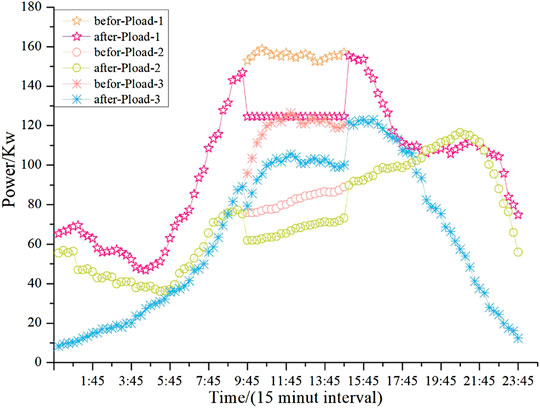
FIGURE 10. Bi-level planning flexible load curtailment.
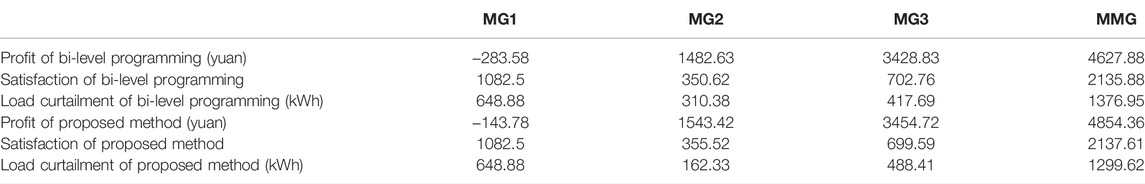
TABLE 5. Comparison between optimization solution and bi-level programming solution.
Conclusion
In this paper, a coordinated dispatching model of MMG is proposed, which balances the two objective problems of MMG satisfaction and each MG profit in a fault state. It also effectively promotes the absorption of RE, peaking CO2 emissions and carbon neutrality. RE is uncontrollable power, which will change with the change of weather and temperature, resulting in intermittence and uncertainty of WT and PV, resulting in fault halting work. Due to the intermittent reason, an MG has to cut off the flexible load in order to meet the safety and economy; however, cutting off too much flexible load will reduce the satisfaction of MMG. This paper uses the optimization solution method to balance the satisfaction of MMG and the profit of each MG and cut off the load more reasonably. At the same time, the fair transaction between MGs can provide the necessary power for the faulty MG, overcome the intermittence of RE, increase the consumption of RE, reduce the flexible load curtailment of MGs, and improve the profit of MGs. The results of the case analysis show that the method proposed in this paper achieves a balance between the satisfaction of the MMG and the profit of each MG. Moreover, the results of the solution method used in this paper are better than those of traditional bi-level programming.
Data Availability Statement
The original contributions presented in the study are included in the article/supplementary material, and further inquiries can be directed to the corresponding author.
Author Contributions
All authors listed have made a substantial, direct, and intellectual contribution to the work and approved it for publication.
Funding
This work was supported by the National Natural Science Foundation of China under Grant 52067004 and the Science and Technology Plan Project of Guizhou Province under Grant (2016)5103.
Conflict of Interest
The authors declare that the research was conducted in the absence of any commercial or financial relationships that could be construed as a potential conflict of interest.
Publisher’s Note
All claims expressed in this article are solely those of the authors and do not necessarily represent those of their affiliated organizations, or those of the publisher, the editors and the reviewers. Any product that may be evaluated in this article, or claim that may be made by its manufacturer, is not guaranteed or endorsed by the publisher.
References
Afrakhte, H., and Bayat, P. (2020). A Contingency Based Energy Management Strategy for Multi-Microgrids Considering Battery Energy Storage Systems and Electric Vehicles. J. Energy Storage 27, 101087. doi:10.1016/j.est.2019.101087
Ahmadi, S. E., Rezaei, N., and Khayyam, H. (2020). Energy Management System of Networked Microgrids through Optimal Reliability-Oriented Day-Ahead Self-Healing Scheduling. Sustain. Energy, Grids Netw. 23, 100387. doi:10.1016/j.segan.2020.100387
Amirioun, M. H., Aminifar, F., Lesani, H., and Shahidehpour, M. (2019). Metrics and Quantitative Framework for Assessing Microgrid Resilience against Windstorms. Int. J. Electr. Power & Energy Syst. 104, 716–723. doi:10.1016/j.ijepes.2018.07.025
Bagdadee, A. H., and Zhang, L. (2020). Renewable Energy Based Self-Healing Scheme in Smart Grid. Energy Rep. 6, 166–172. doi:10.1016/j.egyr.2019.11.058
Beyza, J., and Yusta, J. M. (2021). Integrated Risk Assessment for Robustness Evaluation and Resilience Optimisation of Power Systems after Cascading Failures. Energies (Basel) 14 (2028), 2028. doi:10.3390/en14072028
Cao, S. M., Zhang, H. L., Cao, K., Chen, M., Wu, Y., and Zhou, S. Y. (2021). Day-Ahead Economic Optimal Dispatch of Microgrid Cluster Considering Shared Energy Storage System and P2P Transaction. Frontiers in Energy Research 9 doi:10.3389/fenrg.2021.645017
Chen, J. J., Rong, Z. K., Peng, K., Zhao, Y. L., Zhang, X. H., Qi, B. X., et al. (2021). Multi-energy Coordinated Microgrid Scheduling with Integrated Demand Response for Flexibility Improvement. Energy 217, 119387. doi:10.1016/j.energy.2020.119387
Ghenai, C., and Bettayeb, M. (2019). Modelling and Performance Analysis of a Stand-Alone Hybrid Solar PV/fuel Cell/diesel Generator Power System for University Building. Energy 171, 180–189. doi:10.1016/j.energy.2019.01.019
Goyal, M., and Ghosh, A. (2016). Microgrids Interconnection to Support Mutually during Any Contingency. Sustain. Energy, Grids Netw. 6, 100–108. doi:10.1016/j.segan.2016.02.006
Güney, T. (2019). Renewable Energy, Non-renewable Energy and Sustainable Development. Int. J. Sustain. Dev. World Ecol. 26 (5), 389–397. doi:10.1080/13504509.2019.1595214
Guofa, C. (2020). Research on Bi-level Coordinated Optimized Operation Strategy of Microgrid Cluster. Lanzhou University of Technology.
Hamzeh Aghdam, F., Salehi, J., and Ghaemi, S. (2018). Contingency Based Energy Management of Multi-Microgrid Based Distribution Network. Sustain. Cities Soc. 41, 265–274. doi:10.1016/j.scs.2018.05.019
Hosseinnezhad, V., Rafiee, M., Ahmadian, M., and Siano, P. (2018). Optimal Island Partitioning of Smart Distribution Systems to Improve System Restoration under Emergency Conditions. Int. J. Electr. Power & Energy Syst. 97, 155–164. doi:10.1016/j.ijepes.2017.11.003
Jiang, W., Wu, L., Zhang, L., and Jiang, Z. (2020). Research on Load Transfer Strategy Optimisation with Considering the Operation of Distributed Generations and Secondary Dispatch. IET Gener. Transm. & Distrib. 14 (23), 5526–5535. doi:10.1049/iet-gtd.2020.1144
Kahnamouei, A. S., and Lotfifard, S. (2021). “Enhancing Resilience of Distribution Networks by Coordinating Microgrids and Demand Response Programs in Service Restoration,” in IEEE Systems Journal (IEEE), 1–12. doi:10.1109/jsyst.2021.3097263
Kaijun, L., and Junyong, W. (2018). Optimization of Operation Strategy for Micor-Energy Grid with Cchp Systems Based on Non-cooperative Game. Automation Electr. Power Syst. 42 (06), 25–32. doi:10.1016/j.jclepro.2019.118822
Khenissi, I., Sellami, R., Fakhfakh, M. A., Neji, R., and Derbel, F. (2020). “Effects of High PV Penetration Level on Voltage and Frequency Profile of a Distribution Network,” in 2020 17th International Multi-Conference on Systems, Signals & Devices (SSD), Monastir, Tunisia, 20-23 July 2020 (IEEE).
Kong, X., Liu, D., Wang, C., Sun, F., and Li, S. (2020). Optimal Operation Strategy for Interconnected Microgrids in Market Environment Considering Uncertainty. Appl. Energy 275, 115336. doi:10.1016/j.apenergy.2020.115336
Lai, K., Wang, Y., Shi, D., Illindala, M. S., Jin, Y., and Wang, Z. (2019). Sizing Battery Storage for Islanded Microgrid Systems to Enhance Robustness against Attacks on Energy Sources. J. Mod. Power Syst. Clean. Energy 7 (5), 1177–1188. doi:10.1007/s40565-019-0501-1
Lei, S., Chen, C., Zhou, H., and Hou, Y. (2019). Routing and Scheduling of Mobile Power Sources for Distribution System Resilience Enhancement. IEEE Trans. Smart Grid 10 (5), 5650–5662. doi:10.1109/tsg.2018.2889347
Li, Z., and Xu, Y. (2018). Optimal Coordinated Energy Dispatch of a Multi-Energy Microgrid in Grid-Connected and Islanded Modes. Appl. Energy 210, 974–986. doi:10.1016/j.apenergy.2017.08.197
Liu, H., Li, J., Ge, S., He, X., Li, F., and Gu, C. (2020). Distributed Day-Ahead Peer-To-Peer Trading for Multi-Microgrid Systems in Active Distribution Networks. IEEE Access 8, 66961–66976. doi:10.1109/access.2020.2983645
Lyu, Z., Yang, X., Zhang, Y., and Zhao, J. (2020). Bi-level Optimal Strategy of Islanded Multi-Microgrid Systems Based on Optimal Power Flow and Consensus Algorithm. Energies 13 (7), 1537. doi:10.3390/en13071537
Marquez, J. J., Zafra-Cabeza, A., Bordons, C., and Ridao, M. A. (2021). A Fault Detection and Reconfiguration Approach for MPC-Based Energy Management in an Experimental Microgrid. Control Eng. Pract. 107, 104695. doi:10.1016/j.conengprac.2020.104695
Mishra, S., Anderson, K., Brain, M., Boyer, K., and Warren, A. (2020). Microgrid Resilience: A Holistic Approach for Assessing Threats, Identifying Vulnerabilities, and Designing Corresponding Mitigation Strategies. Appl. Energy 264 (C), 114726. doi:10.1016/j.apenergy.2020.114726
Mohandes, B., Acharya, S., Moursi, M. S. E., Al-Sumaiti, A. S., Doukas, H., and Sgouridis, S. (2020). Optimal Design of an Islanded Microgrid with Load Shifting Mechanism between Electrical and Thermal Energy Storage Systems. IEEE Trans. Power Syst. 35 (4), 2642–2657. doi:10.1109/tpwrs.2020.2969575
Moslehi, S., and Reddy, T. A. (2018). Sustainability of Integrated Energy Systems: A Performance-Based Resilience Assessment Methodology. Appl. Energy 228, 487–498. doi:10.1016/j.apenergy.2018.06.075
Nazemi, M., and Dehghanian, P. (2020). Seismic-resilient Bulk Power Grids: Hazard Characterization, Modeling, and Mitigation. IEEE Trans. Eng. Manage. 67 (3), 614–630. doi:10.1109/tem.2019.2950669
Nelson, J., Johnson, N. G., Fahy, K., and Hansen, T. A. (2020). Statistical Development of Microgrid Resilience during Islanding Operations. Appl. Energy 279, 115724. doi:10.1016/j.apenergy.2020.115724
Novoa, L., Flores, R., and Brouwer, J. (2019). Optimal Renewable Generation and Battery Storage Sizing and Siting Considering Local Transformer Limits. Appl. Energy 256, 113926. doi:10.1016/j.apenergy.2019.113926
Oboudi, M. H., Ragimi, S., and Hooshmand, R. (2020). Stochastic Operation Framework of Microgrid under Uncertainties of Load, Generation, and Contingency. J. Eenergy Eengineering 146 (1), 639. doi:10.1061/(asce)ey.1943-7897.0000639
Qiu, H., Gu, W., Xu, Y., Yu, W., Pan, G., and Liu, P. (2020). Tri-level Mixed-Integer Optimization for Two-Stage Microgrid Dispatch with Multi-Uncertainties. IEEE Trans. Power Syst. 35 (5), 3636–3647. doi:10.1109/tpwrs.2020.2987481
Rodrigues, Y., Monteiro, M., Abdelaziz, M., Wang, L., de Souza, A. Z., and Ribeiro, P. (2020). Improving the Autonomy of Islanded Microgrids through Frequency Regulation. Int. J. Electr. Power & Energy Syst. 115, 105499. doi:10.1016/j.ijepes.2019.105499
Wang, Z., Shen, C., Xu, Y., Liu, F., Wu, X., and Liu, C.-C. (2019). Risk-limiting Load Restoration for Resilience Enhancement with Intermittent Energy Resources. IEEE Trans. Smart Grid 10 (3), 2507–2522. doi:10.1109/tsg.2018.2803141
Wang, Z., and Wang, J. (2015). Self-healing Resilient Distribution Systems Based on Sectionalization into Microgrids. IEEE Trans. Power Syst. 30 (6), 3139–3149. doi:10.1109/tpwrs.2015.2389753
Wu, N., and Wang, H. (2018). Deep Learning Adaptive Dynamic Programming for Real Time Energy Management and Control Strategy of Micro-grid. J. Clean. Prod. 204, 1169–1177. doi:10.1016/j.jclepro.2018.09.052
Xu, H., Meng, Z., Zhao, R., Wang, Y., and Yan, Q. (2020). Optimal Dispatching Strategy of an Electric-Thermal-Gas Coupling Microgrid Considering Consumer Satisfaction. IEEE Access 8, 173169–173176. doi:10.1109/access.2020.3024931
Keywords: multi-microgrid, contribution bargaining, satisfaction, load removal, renewable energy utilization, CO2 emission
Citation: Fu Z, Li B and Wang H (2022) Real-Time Optimal Scheduling of Multi-Microgrids Considering Renewable Energy Intermittency. Front. Energy Res. 10:888156. doi: 10.3389/fenrg.2022.888156
Received: 02 March 2022; Accepted: 04 May 2022;
Published: 23 June 2022.
Edited by:
Chao Duan, Northwestern University, United StatesReviewed by:
Zitian Qiu, University of Liverpool, United KingdomZiyu Fan, University of Liverpool, United Kingdom
Copyright © 2022 Fu, Li and Wang. This is an open-access article distributed under the terms of the Creative Commons Attribution License (CC BY). The use, distribution or reproduction in other forums is permitted, provided the original author(s) and the copyright owner(s) are credited and that the original publication in this journal is cited, in accordance with accepted academic practice. No use, distribution or reproduction is permitted which does not comply with these terms.
*Correspondence: Honglei Wang, aGx3YW5nQGd6dS5lZHUuY24=