- 1Drilling Process Research Institute of Shengli Petroleum Engineering Company, Dongying, China
- 2School of Petroleum Engineering, China University of Petroleum (East China), Qingdao, China
Gas hydrate is a type of ice like crystals, which could widely form and plug the offshore oil and gas pipelines. In order to reduce the cost of hydrate control in oil and gas transportation, search for new anti-agglomerates (AAs) is always needed. In this work, fourteen different types of polymers from drilling fluid additives were selected and their anti-agglomeration ability on gas hydrate was experimentally studied by using a high-pressure rocking cell. The hydrate volume percentage, slider moving range, and moving velocity were measured for evaluation. Two polymers [acrylamide polymer (AAP) and hydrolyzed polyacrylonitrile ammonium salt (HAPS)] were found to be effective to avoid agglomerating at low hydrate concentration (≤6%). AAP and HAPS could prevent plugging, while the hydrate concentration is lower than 15.12% and 16.92%, respectively. It was speculated that the hydrogen bonding capability of the hydrophilic groups, the length of the hydrophobic chains and polymer molecules, and the antagonism of different functional groups might affect the anti-agglomerating performance of polymers.
Introduction
Gas hydrate is a type of non-stoichiometric clathrate compound, in which the cage-like structure is formed by the hydrogen bonding water molecules and the infilling gas molecules (Chen et al., 2008; Xu et al., 2016). Gas hydrate could easily form in oil and gas pipelines. The formation of hydrate in oil and gas pipelines will not only increase the pressure drop and reduce the delivery capacity but in severe cases will also block the pipelines and cause stoppage of transportation (Sloan et al., 2010). In the deep-water oil and gas co-transportation pipelines, the high pressure and low temperature environment is very favorable for hydrate formation. The consequent hydrate aggregation and plugging at elbows, valves, and connections of the pipelines will reduce the transport efficiency and even cause the pipeline to burst (Liu and Zhong, 2007; Li et al., 2015). The most widely used method for hydrate control is adding inhibitors. Hydrate inhibitors could be classified into thermodynamic inhibitors and low dose hydrate inhibitors (LDHI). The thermodynamic inhibitors (usually glycols and inorganic salts) are usually used in high dosage (up to 60 wt%) with the problem of environmental pollution, corrosiveness, and high cost (Brustad et al., 2005). LDHIs could be classified into kinetic hydrate inhibitors (KHIs) and anti-aggregation (AA). In terms of dosage, LDHIs are more effective than thermodynamic inhibitors (Kelland et al., 2009) and are effective in reducing the cost of hydrate inhibition by 16–50% compared to methanol (Fu et al., 2001). LDHIs could interfere with the nucleation, growth, or aggregation of hydrate (Erfani et al., 2013) and retard or prevent hydrate plugging. KHIs (usually polymers) inhibit hydrate formation by delaying hydrate nucleation and growth (Sun and Firoozabadi, 2014). AAs are usually used in the hydrate slurry flow. As a new type of oil–gas–water multi-phase co-transportation method, hydrate slurry flow technology is gradually gaining attention in the oil and gas gathering and transportations. The macroscopic morphological study shows that when hydrate particles appear, the original oil–water emulsion structure is destroyed, and the final hydrate slurry is formed as the solid (hydrate)–liquid (diesel) dispersion system (Yan et al., 2016). The degree of hydrate aggregation is directly related to the anti-aggregating performance of AAs.
In order to reduce the incidence of complex downhole accidents and maintain wellbore stability, some polymers have been used as the main treatment agent to modulate the properties of the drilling fluid. These fluids are called polymer drilling fluids. Main treatment agents such as cationic polymers, amphoteric polymers, and organo-amine with high shale inhibition capability are developed. By using these main treatment agents, the cationic/amphoteric polymer drilling fluid and strong inhibition of the water-based drilling fluid were developed (Zhang, 2018). Gao et al. (2016) synthesized one polymer which could inhibit hydrate formation in the water-based drilling fluid. Wang et al. (2021) found that three thickening agents, such as modified starch, sodium carboxymethyl cellulose, and xanthan gum, inhibited hydrate nucleation and growth to various degrees by binding water molecules in the system. It seems polymers have a certain degree of anti-agglomerating effect, some of them have functional groups that can disrupt the cage structure of hydrate, and chain polymers adsorb on the surface of hydrate crystals, creating spatial site resistance and inhibiting the growth of the cage structure (Ke and Chen, 2019). In addition, some polymers such as PVCap, polymer hydrogels and polypropoxides have the potential capability of dispersing hydrate, which provides a guidance for screening AAs from polymers. Seo et al. (2014) used polymer hydrogels for the first time to prevent gas hydrate from aggregation. Without any surfactant, a polyacrylamide (PAM)-based hydrogel was synthesized, which greatly improved the fluidity of the slurry and make it more stable and volume controllable after swelling. Park et al. (2019) synthesized poly(N-isopropylacrylamide) (PNIPAM) based on the RAFT method, and PNIPAM maintained great anti-agglomerating capability even at a subcooling of 16 K. Farhadian et al. (2019) synthesized castor oil-based aqueous polyurea/urethane (CWPUUs), which effectively prevented the hydrate particles from aggregation and the adhesion of particles to the cell wall. Farhadian et al. (2020) studied the effect of synthetic hydrophilic polymer WPUUs on hydrate agglomeration at 60–100% water cut and found that 1 wt% of hydrophilic polymer WPUUs containing quaternary ammonium functional groups were effective in preventing hydrate aggregation and forming stable hydrate slurry in both 60% oil–water fluid and pure water.
However, due to the wide types of drilling fluid treatment agents and the different functional groups of the polymer, the hydrate inhibiting performance capability of drilling fluid polymers needs to be experimentally tested one by one, and important conclusions that can guide the screening of inhibitors are missing. In this work, 14 different types of polymers were selected from various drilling fluid additives to evaluate their hydrate inhibition capability in order to screen effective polymer types, and the relationship between the anti-agglomeration ability and the chemical structure was analyzed to provide new ideas for the development of low-dose hydrate inhibitors.
Materials and Methods
Apparatus
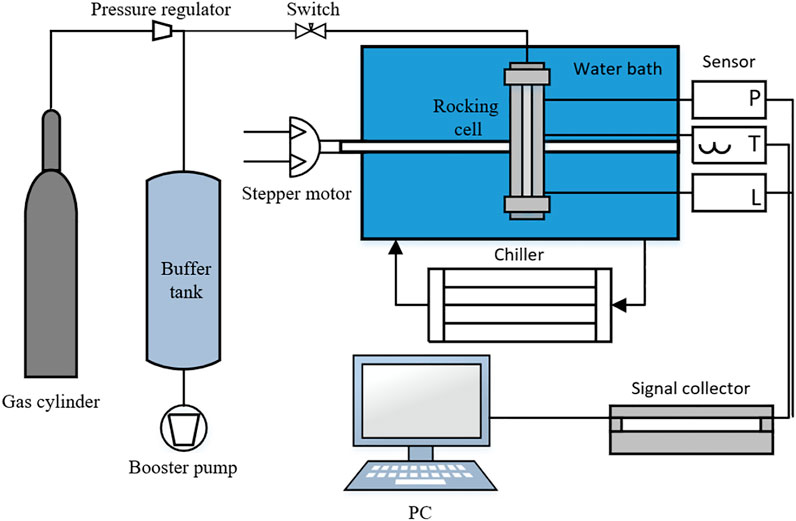
Based on extensive investigation and research on hydrate inhibitor evaluation equipment, a high-pressure rocking cell is used for the evaluation and screening experiments. The schematic diagram of the high-pressure rocking cell is shown in Figure 1. The photograph of the apparatus is shown in Figure 2. The reactor cell is made of 316 L stainless steel, which has good corrosion resistance with a maximum operation pressure of 30 MPa. The rocking cell apparatus is made up of rocking module, gas injection module, data acquisition module, and temperature control module. The rocking system consists of a two-phase stepper motor, drive, rotating shaft, and control box. The rocking angle of the rocking cell is set at ±90 degrees, and the maximum rocking frequency is 1 rock/min. The temperature sensor has a range of −50–100°C and a measurement accuracy of ±0.1°C. The pressure sensor has a range of 0–40 MPa and an accuracy of ±0.1 MPa. The data acquisition module collects four sets of data per second. The positions of the slider could be record in time. The gas injection system includes a vacuum pump, high-pressure gas cylinder, pressure regulator, and six-way valve. The system temperature is controlled by a water bath (Ningbo Tianheng THX-2030H), with a temperature range of −20–100°C and the cooling rate of 2°C/h. The electronic balance (BSM-420.3, accuracy ±0.001 g) was manufactured by Shanghai Zhuojing Electronic Technology Co.
Chemicals
In all the experiments, methane gas with a purity of 99.999% was from Qingdao Xin Keyuan Gas Co. Ltd. Mineral oil (#5) was from Mo Jiezuo Petrochemical Co. Ltd. Pure water with a resistivity of 18
Procedure
A high-pressure rocking cell is used to evaluate the anti-agglomerating capability of fourteen polymers. A position sensor is used to track the slider trajectory, while the cell is rocking to evaluate the polymers’ anti-agglomerating capability on hydrate. The specific experimental procedures are as follows: 1) Turn off the power of the control box and motor, clean the reactor cell with petroleum ether and dry it. 2) Prepare mineral oil, pure water, and polymers in a certain ratio to form an oil–water mixture and add it to the reactor. Tighten the reactor cover and vacuum the reactor, and then set the water bath to 16°C until the gauge pressure is stable. 3) After the temperature inside the cell is stable, inject the high-purity methane into the cell and close the valve after the experimental pressure is reached. 4) Turn on the power of the control box and the motor and set the angle and the frequency of the rocking cell on the control box. The reaction cell starts to rock, and the methane dissolves in mineral oil and water quickly. 5) When the pressure in the reaction cell is stable, set the temperature of the water bath to 0°C and the cooling rate is 2°C/h. At the same time, start the data acquisition system. The temperature, pressure, and position data are recorded during the hydrate formation. 6) After the completion of hydrate formation, the temperature and pressure are stabilized again. Turn off the water bath and data acquisition. Turn off the control box and motor; and 7) release the pressure and pour out the waste liquid from the cell.
Results and Discussion
Anti-Agglomerating Capability
The anti-agglomerating ability of 14 polymers are evaluated in this section. The polymers are divided into three levels based on their anti-agglomeration performance, considering the characteristics of the rocking cell. The formation and aggregation of hydrate directly affect the slider moving. The hydrate particles dispersed in the liquid phase will increase the fluid viscosity and decrease the slider velocity. Besides, large hydrate aggregates are accumulated on both sides of the cell, which will reduce the slider moving range. The aged hydrate sediment will directly plug the slider. According to the slider moving trajectory, the anti-agglomerating capability of the polymers is classified as A, B, and C from the best to the worst.
In the process of the experiment, as shown in Figure 3, there are no large hydrate aggregates precipitated throughout the experiment for the grade-A polymer, which means that the slider can move periodically through the whole cell; if there is hydrate aggregation precipitated in the experimental process, which reflects in the reduced range of the slider motion without plugging phenomenon, as shown in Figure 4, such polymers have B-grade anti-agglomerating capability. In order to see the motion trajectory of the slider clearly, we made a partial zoom on Figure 4. If the slider is plugged at a certain position in the cell with the polymer, it indicates that the polymer has C-level anti-agglomeration ability. As shown in Figure 5, the slider moving range gradually decreases as the hydrate the aggregation and ageing, and the trajectory is finally a straight line.
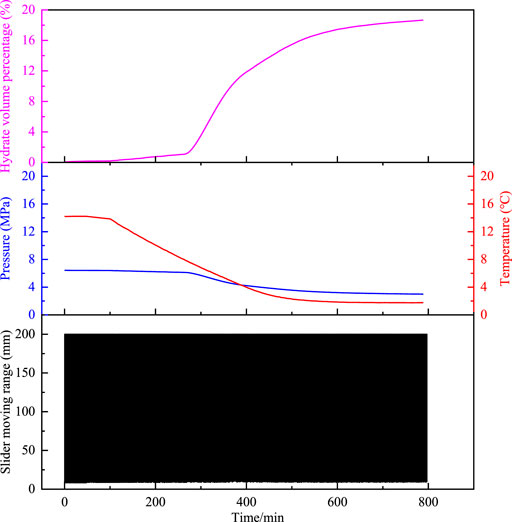
FIGURE 3. Temperature and pressure changes of the oil–water system, the hydrate volume fraction, and the slider trajectory as a function of time with A-grade polymers.
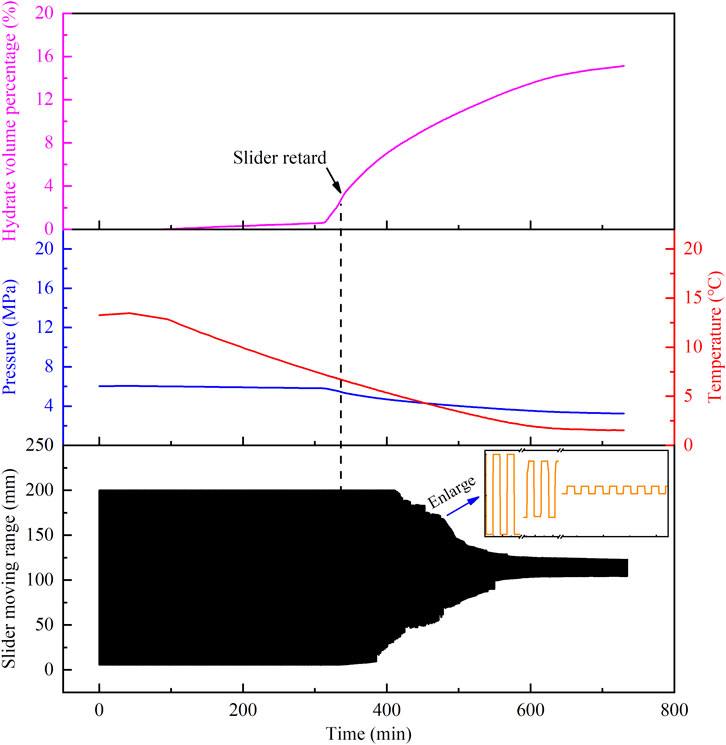
FIGURE 4. Temperature and pressure changes of the oil–water system, the hydrate volume fraction, and the slider trajectory as a function of time with B-grade polymers.
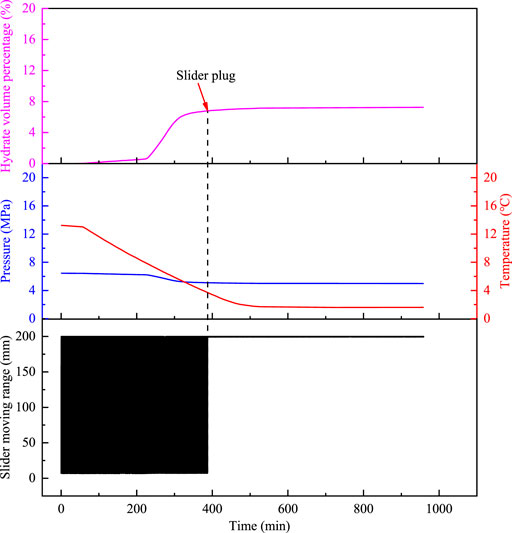
FIGURE 5. Temperature and pressure changes of the oil–water system, the hydrate volume percentage, and the slider trajectory as a function of time with C-grade polymers.
The hydrate volume percentage reflects the amount of hydrate formation at different time. In the process, the slider motion is mainly controlled by the amount of hydrate, hydrate aggregation, and deposition. By comparing the slider velocity in the presence of different AAs at the same hydrate volume percentage, the hydrate aggregation of hydrate in the reactor can be judged, and thus, its anti-agglomerating capability can be compared. The hydrate volume percentage that causes the slider retard is marked as Hslow, and the hydrate volume percentage that causes the slider plug is marked as Hplug, and the final amount of hydrate is marked as Hhyd, which are used as important parameters to evaluate the polymers’ anti-agglomerating capability at the same grade.
The hydrate volume percentage is calculated as follows:
In Equation 1, Vhyd is the volume of hydrate generated, ml; Voil is the volume of mineral oil, ml; Vwater is the initial volume of water, ml; and Vwater,conv is the volume of water converted to hydrate, ml.
The hydrate volume generated is calculated as follows:
In Equation 2, mhyd is the mass of hydrate formed, Kg; ρhyd is the density of methane hydrate, taken as 0.91 g cm−3,
In Equation 3,
During hydrate generation, the methane solubility changes with the temperature and pressure variation. Besides, due to methane’s low solubility in water, only the dissolution of methane in mineral oil needs to be considered in the process of calculation. The amount of methane consumed nhyd for hydrate formation can be calculated from material conservation,
In Equation 4, ngas,1 is the amount of methane substance in the gas phase before hydrate formation, mol, which can be obtained from the gas equation of state, and noil,1 is the amount of methane substance dissolved in mineral oil before hydrate formation, mol. Similarly, ngas,2 is the amount of methane substance in the gas phase during or after hydrate formation, mol; noil,2 is the amount of methane substance dissolved in mineral oil during or after hydrate formation, mol; noil,2 is the amount of methane substance dissolved in mineral oil during or after hydrate formation, mol; and noil,2 is the amount of methane substance dissolved in the mineral oil during or after hydrate formation, mol.
In Equations 5 and (6), R is the gas constant, R = 8.314 J mol−1∙K−1; P1 and P2 are the system pressure before and after hydrate formation, Pa; T1 and T2 are the system temperature before and after hydrate formation, K; V1 and V2 are the gas volume, m3; and Z1 and Z2 are the system compression factor before and after hydrate generation, respectively. The compression factor of the system can be calculated by the Patel–Teja equation of state (Chen et al., 2008).
The solubility of methane in mineral oil is obtained by applying our experimentally derived empirical model (Yue, 2020),
The slider moves in a cyclic reciprocal motion in the rocking cell and the slider trajectory characterized the state of hydrate aggregation. The distance between the slider and the bottom gland is called the slider position. When the slider is in normal motion, the slider can move from 7 to 200 mm. The slider moving range trajectory is actually a line, but because the moving range time is too short compared to the experimental time, it is reflected in the moving range and time image as a black-shaded graph. This section uses the blank group in the 20% water cut oil–water system as an example for specific illustration.
As shown in Figure 6, L1 is the slider the displacement in the forward direction (from 7 to 200 mm), mm, and L2 is the slider displacement (from 200 to 7 mm), mm. The moving times required for the forward and reverse directions are noted as ∆t1 and ∆t2, respectively.
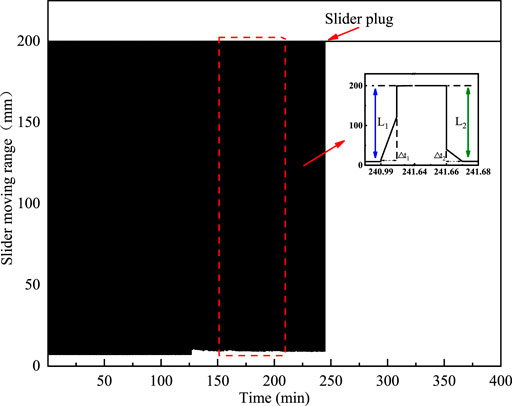
FIGURE 6. Illustration of the slider plug position, the slider motion range in both forward and reverse directions in the 20% water cut oil–water system without polymers.
In the system without polymers, the hydrate formation increases the fluid viscosity in the cell and slows down the slider motion, which will decrease L1 and L2 and extend ∆t1 and ∆t2, and ultimately results in a reduction in the slider velocity. The forward V1 and reverse velocity V2 of the slider are calculated as follows:
Results
As shown in Table 2, there are 12 kinds of polymers with C-grade anti-agglomerating capability at 20% water cut among the selected 14 polymers, they are MBR, HVPAC, MEP, CAMIP, MS, HC, SP, PA, PAA, HAR-D, FA-367, and PCMIP. Besides, there are two polymers, AAP and HAPS show B-grade anti-agglomerating performance, and no A-grade polymer is found. The addition of polymers will promote the hydrate formation and increase the amount of hydrate formation. However, efficient AA can prevent the aggregations under a large amount of hydrate so that the formed hydrate dispersed in the oil and water phase is in the form of small particles, which will increase the fluid viscosity.
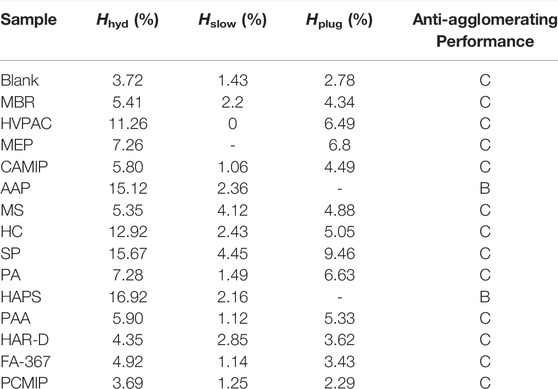
TABLE 2. Experimental results of 14 polymers at the concentration of 2wt% for the evaluation of anti-agglomerating capability in the 20% water cut oil–water system.
It is found that the larger the amount of hydrate in the oil–water system, the larger the amount of hydrate required to cause the slider retarding and plugging. As shown in Figure 7, among the 12 C-class polymers, the most amount of the hydrate is generated in the oil–water system with SP, accounted for 15.67%. Correspondingly, Hslow is also the largest, accounting for 4.45%, and Hplug accounted for 9.46%. PCMIP, HAR-D, MS, and COPNA also follow this principle. The slider velocity decreased in the oil–water system with some high viscosity polymer initially. What’s worth to mention is that the initial fluid viscosity with MEP and HVCP can slow down the slider movement even before the hydrate formation. Besides, oil–water systems with CAMIP, PA, PAA, and FA-367 slowed the slider motion at a small amount of hydrate, while the oil–water system with 2wt% CAMIP retarding the slider when the amount of hydrate produced was only 1.06%. In most oil–water systems with polymers, it can be observed experimentally that a small amount of hydrate continued to be produced after the hydrate plug formation. After the slider is stagnant, the hydrate formed 0.46% with 2 wt% MEP after the slider plug by the hydrate plug formation. This phenomenon can also be observed in the oil–water systems with MS, PA, and PAA. The dense aged hydrate layer increases the mass transfer resistance. The oil–water systems with 2 wt% HVPAC, HC, and SP are still able to generate significant amounts of hydrate after the hydrate plug formation, while the system with HC still able to generate 7.87% hydrate. The reason is probably that the inner diameter of the cell is not plugged completely by the hydrate, and gas–liquid exchange is still possible. However, there are two reasons for the cessation of hydrate generation: 1) Further deposition and the hydrate aging that continues to be generated fill the gap in the hydrate compartment and hinder mass transfer, resulting in no further hydrate formation. 2) As the hydrate has reached the maximum amount under the current condition, the experimental conditions cannot accommodate for further hydrate generation.
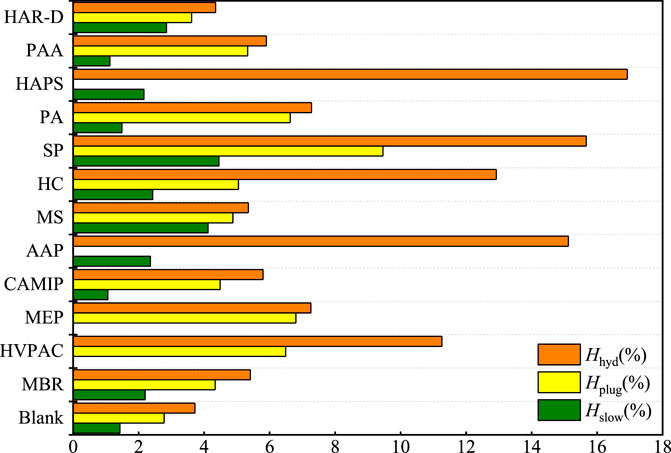
FIGURE 7. Results of the C-grade polymers’ anti-agglomerating capability test in the 20% water cut oil–water system.
There are 2 B-grade polymers, AMP and NPAN. In the system with AAP and HAPS, the generated hydrate is uniformly dispersed in both oil and water phases, and the viscosity of the fluid gradually increases with the continuous generation of hydrate, which will reduce the slider velocity. The slider velocity in the forward and reverse directions reflects the fluid viscosity variation. In addition, the precipitation of hydrate aggregates also provides a greater resistance to mass transfer in the oil–water system. The larger and more abundant the precipitated hydrate aggregates, the lower the final hydrate volume in the system. The final forward slider velocity in the oil–water system with HPAS is higher than that in the AAP-containing system, and the final amount of hydrate produced is higher, indicating that the HAPS system has a lower amount of precipitated hydrate deposited and HAPS have stronger anti-agglomerating capability than AAP. As shown in Figure 8A, in the system without polymers, the generated hydrate rapidly aggregates and precipitates, and the fluid viscosity gradually decreases, which will gradually increase the slider velocity. As the precipitated hydrate aggregates deposited and aged, a dense hydrate shell is gradually formed when the hydrate volume percentage reaches 3.72%, blocking the slider somewhere in the cell, and the slider velocity returns to 0 mm s−1. Figure 7 shows the results of the C-grade polymer anti-agglomerating capability test in the 20% water cut oil–water system. Besides, in addition to the dispersed hydrate particles increasing the viscosity of the fluid, the polymer has a certain viscosity. Under the same initial conditions of temperature and concentration of water cut, the slider velocity of the HAPS system is smaller than that of the AAP system, indicating that the viscosity of the polymer HAPS is higher. Thus, AAP has a better performance in anti-aggregation at the low hydrate percentage. As shown in Figure 8B, in the oil–water system with 2 wt% AAP, when the volume percentage of hydrate reaches 5.96%, the slider moving range starts to decrease, indicating the precipitation of hydrate aggregates. At the early stage of hydrate generation, the slider moving range in the forward direction decreased by nearly 40 mm when the hydrate volume percentage is only 0.34%, indicating that large hydrate crystals had already precipitated. In addition, the increasing slider moving range is due to the hydrate aggregation which is not dense enough and is gradually narrow and compressed by the impact of slider movement. The slider moving range in the HAPS system is higher than that in the AAP system when the hydrate volume concentration is about 6.7%, indicating that the size of the precipitated hydrate aggregates is smaller and the formed hydrate shell is thinner, which is more likely to be broken under the impact of the slider.
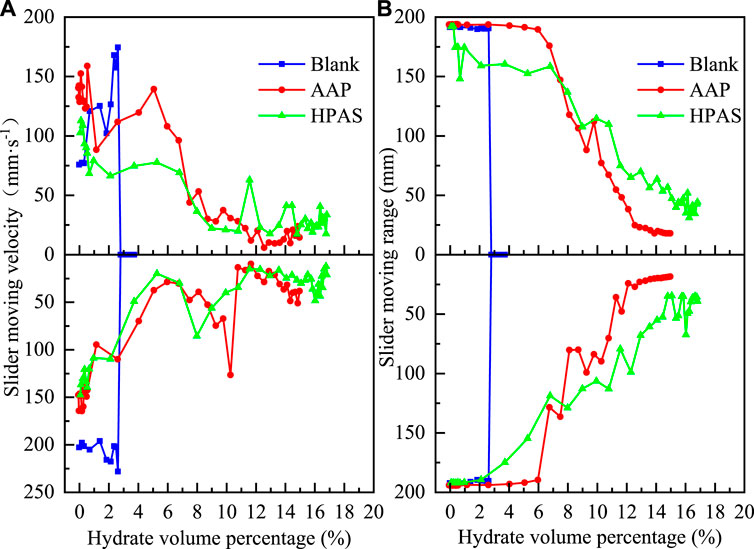
FIGURE 8. The slider moving range and velocity in both forward and reverse directions in 20% water cut oil-water system at variation hydrate volume with B-class polymers AAP and HAPS.
Table 3 gives the amount of hydrate formation and the slider moving range and velocity with the 2 B-grade polymers in the 20% water cut oil–water system. As shown in Table 3, there are more final hydrates in the system with stronger anti-agglomerating polymers. Compared to the blank group, Hhyd is about 15.12% in the oil–water system with AAP and Hhyd in the system with HAPS is more, according at 16.92%. The final slider motion range in the HAPS system with higher hydrate is more than that in the AAP system, with the forward moving range being 3.19 mm more, and the reverse moving range being 25.93 mm more. In terms of fluid viscosity, the slider velocity of the oil–water system with HAPS is higher than that of the system with AAP, at 16.81 mm s−1 in the forward direction, and lower than that of the system with AAP at 33.64 mm s−1 in the reverse direction. Overall, HAPS has stronger anti-agglomerating capability than AAP at high hydrate percentage.

TABLE 3. The final hydrate volume fraction (Hhyd), the final slider moving range and final velocity in both forward and reverse directions in 20% water cut oil-water system" with 2.0wt% B-class polymers (AAP and HAPS).
The hydrogen bonding capability of the functional group determines the adsorption capacity of the compound on the hydrate surface. The stronger the hydrogen bonding capability of the functional group, the stronger the adsorption capacity of the chemical group, which is expressed as the stronger the polymer’s anti-agglomerating performance. However, the influence of the functional group on the anti-agglomerating performance is not only reflected in the hydrogen bonding capability but also the length of the hydrophobic tail chain and the overall length of the polymer, which will affect the mass transfer. The longer the hydrophobic tail chain and polymer molecule, the greater the effect on mass transfer, and it is more difficult to hydrate formation. However, it will increase the perturbation that promotes hydrate formation. Therefore, the length of polymer molecules and hydrophobic tail chains is not as long as possible (Bao, 2014).
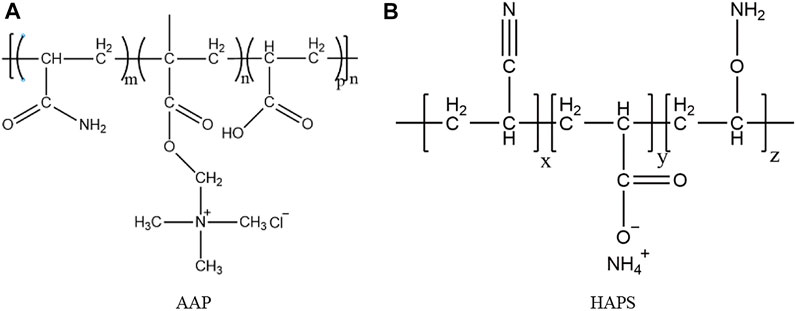
The chemical structure of AAP and HAPS is shown in Figure 9. Structurally, both AAP and HAPS contain an amide group (-CONH2) with strong binding capability to water molecules. In addition, the hydroxyl groups (-OH) will increase the surface binding energy, making it easier for the polymer to adsorb on the hydrate surface. AAP molecules form hydrogen bonds with caged water molecules at different points on the hydrate surface through amide groups and carboxyl groups (-COOH), disrupting the cage structure and adsorbing on the hydrate particle surface. In addition, hydrophobic groups provide no sites for hydrate nucleation and prevent further hydrate nucleation, but there may be antagonistic interactions between different hydrophilic groups, resulting in hydrophilic groups facing the liquid phase and providing nucleation sites for hydrate, which will promote hydrate formation. Thus, the anti-agglomerating capability of AAP does not reach grade A. HAPS is the polymer with alkynes and alkanes containing an unsaturated bond cyanide (-CN) and hydrophilic functional groups, ester group (-COO-) and amino group (-NH2). It may be one of the effective reasons for the stronger anti-agglomerating capability of HAPS molecules at high hydrate percentage that the cyanide contains two hydrogen-bonding acceptors, which will forming a stronger hydrogen-bonding structure. In addition, the amino group has stronger hydrogen-bonding capability as well as amphoteric properties (Pei and Kelland, 2013). HAPS molecules have more hydrophilic groups and contain more hydrogen-bonding sites with stronger capability to adsorb on hydrate surfaces. However, although HAPS has better anti-agglomeration capability at high hydrate concentration compared to AAP, it cannot completely avoid the hydrate agglomeration.
Conclusion
Fourteen polymers selected from drilling fluid additives were tested at low water cut (20%) by using the high-pressure rocking cell for their anti-agglomerating capability. The following conclusions could be drawn:
Two polymers (AAP and HAPS) had been found to be efficient anti-agglomerations according to the experimental results. In the 20% water cut oil–water–gas system, AAP could prevent hydrate agglomeration as hydrate concentration lower than 2.36% and avoid hydrate plug until the concentration lower reached 15.12%. Another level B polymer HAPS could increase Hplug to 16.92% and homogeneously disperse hydrate until hydrate concentration reaches 2.36%. Besides, several C level polymers were efficient at much more hydrate concentration compared with B polymers: MS could disperse hydrate homogeneously at 4.12% hydrate concentration, and SP can disperse hydrate particles effectively at 4.45% hydrate concentration.
It had been found that the number of hydrophilic groups does not directly affect the anti-agglomerating capability performance of the polymer. The influence of functional groups on the anti-agglomerating capability performance is mainly reflected in: 1) hydrogen bonding capability of hydrophilic groups, which will influence the adsorption capability of polymer molecules on the surface of hydrate crystals and the capability to break the cage structure, and 2) the type and length of hydrophobic groups. Longer hydrophobic tail chains have a greater effect on mass transfer but also increase perturbation and promote hydrate formation; 3) the antagonism between different functional chemical groups.
In the future screening work of hydrate inhibitors, drilling fluid additives with strong hydrophilic group should be selected based on their applications in drilling fluids to reduce the cost of hydrate control and improve the screening efficiency.
Data Availability Statement
The original contributions presented in the study are included in the article/Supplementary Material, further inquiries can be directed to the corresponding author.
Author Contributions
Conceptualization, XL; formal analysis, XL; investigation, XL and ZM; writing—review and editing, XL; funding acquisition, XL; supervision, XL; methodology, ZM; writing-original draft preparation, ZM. All authors contributed to manuscript revision, read, and approved the submitted version.
Conflict of Interest
XL was employed by the company Sinopec Shengli Petroleum Engineering Co., Ltd.
The remaining author declares that the research was conducted in the absence of any commercial or financial relationships that could be construed as a potential conflict of interest.
Publisher’s Note
All claims expressed in this article are solely those of the authors and do not necessarily represent those of their affiliated organizations, or those of the publisher, the editors and the reviewers. Any product that may be evaluated in this article, or claim that may be made by its manufacturer, is not guaranteed or endorsed by the publisher.
Acknowledgments
Financial support received from Sinopec Engineering Company Project (SG20-03J) is greatly acknowledged. The authors also thank Cheng Yue for building the rocking cell apparatus and thank Litao Chen for insightful discussions.
References
Bao, L. (2014). Molecular Simulation of Amide Hydrate Kinetic inhibitorsPhD Dissertation. Guangzhou Guangdong province China: South China University of Technology.
Brustad, S., Loken, K. P., and Waalmann, J. G. (2005). “Hydrate Prevention Using MEG Instead of MeOH: Impact of Experience from Major Norwegian Developments on Technology Selection for Injection and Recovery of MEG,” in Proceedings of the Offshore Technology Conference (Houston, USA: OTC). doi:10.4043/17355-ms
Chen, G. J. (2008). “Crystal Structure and Basic Properties of Gas Hydrates & Phase Equilibrium Thermodynamics of Gas Hydrates,” in Gas Hydrate Science and Technology. Editors Y. Y. Zheng, and Y. H. Dai (Beijing, China: Chemical Industry Press), 5–77.
Erfani, A., Varaminian, F., and Muhammadi, M. (2013). “Gas Hydrate Formation Inhibition Using Low Dosage Hydrate Inhibitors,” in Proceedings of the 2nd National Iranian Conference on gas hydrate (NICGH) (Semnan, Iran, 14–15.
Farhadian, A., Varfolomeev, M. A., Kudbanov, A., and Gallyamova, S. R. (2019). A New Class of Promising Biodegradable Kinetic/anti-Agglomerant Methane Hydrate Inhibitors Based on castor Oil. Chem. Eng. Sci. 206, 507–517. doi:10.1016/j.ces.2019.05.055
Farhadian, A., Varfolomeev, M. A., Kudbanov, A., Rezaeisadat, M., and Nurgaliev, D. K. (2020). Waterborne Polymers as Kinetic/anti-Agglomerant Methane Hydrate and Corrosion Inhibitors: A New and Promising Strategy for Flow Assurance. J. Nat. Gas Sci. Eng. 77, 103235. doi:10.1016/j.jngse.2020.103235
Fu, S. B., Cenegy, L. M., and Neff, C. S. (2001). “A Summary of Successful Field Applications of a Kinetic Hydrate Inhibitor,” in Proceedings of the SPE international symposium on oilfield chemistry (Houston, USA. doi:10.2118/65022-ms
Gao, S. Y., Wang, C. B., and He, Y. (2016). Experimental Study on the Formation of Natural Gas Hydrate in Water-Based Drilling Fluids. Sci. Technol. Eng. 16 (17), 27. doi:10.3969/j.issn.1671-1815.2016.17.005
Ke, W., and Chen, D. (2019). A Short Review on Natural Gas Hydrate, Kinetic Hydrate Inhibitors and Inhibitor Synergists. Chin. J. Chem. Eng. 27 (9), 2049–2061. doi:10.1016/j.cjche.2018.10.010
Kelland, M. A., Svartas, T. M., and Anderen, L. D. (2009). Gas Hydrate Anti-agglomerant Properties of Polypropoxylates and Some Other Demulsifiers. J. Pet. Sci. Eng. 64 (1-4), 1–10. doi:10.1016/j.petrol.2008.12.001
Li, W. Z., Pan, Z., and Yang, L. Y. (2015). Research on Natural Gas Hydrate Prevention Technology. Contemp. Chem. Industry 44 (12), 2870
Liu, D. P., and Zhong, D. L. (2007). Research Progress and Application of Gas Hydrate. Standardization Qual. Machinery Industry 12, 36
Park, J., Kim, H., da Silveira, K. C., Sheng, Q., Postma, A., Wood, C. D., et al. (2019). Experimental Evaluation of RAFT-Based Poly(N-Isopropylacrylamide) (PNIPAM) Kinetic Hydrate Inhibitors. Fuel 235, 1266–1274. doi:10.1016/j.fuel.2018.08.036
Pei, C. C., and Kelland, M. A. (2013). Study of the Gas Hydrate Anti-agglomerant Performance of a Series of N-Alkyl-Tri(n-Butyl)ammonium Bromides. Energy & Fuels 27 (3), 1285. doi:10.1021/ef3018546
Seo, Y., Shin, K., Kim, H., Wood, C. D., Tian, W., and Kozielski, K. A. (2014). Preventing Gas Hydrate Agglomeration with Polymer Hydrogels. Energy Fuels 28 (7), 4409–4420. doi:10.1021/ef500613m
Sloan, E. D., Koh, C. A., and Sum, A. (2010). “Where and How Are Hydrate Plugs Formed?,” in Natural Gas Hydrates in Flow Assurance (Burlington, USA: Gulf Professional Publishing), 13–35.
Sun, M., and Firoozabadi, A. (2014). “New Hydrate Anti-agglomerant Formulation for Offshore Flow Assurance and Oil Capture,” in Proceedings of Offshore Technology Conference (OTC), Houston, Texas, May 2014 (Houston, USA, 15–24. doi:10.4043/25439-ms
Wang, R., Sun, J. S., and Sun, H. C. (2021). Effects of Modified Starch, Sodium Carboxymethylcellulose and Xanthan Gum on Hydrate Formation under Different Driving Forces. J. China Univ. Pet. (Natural Sci. Edition) 45 (01), 127. doi:10.3969/j.issn.1673-5005.2021.01.015
Xu, C. H., Shen, K., and Wang, Y. L. (2016). Analysis of Natural Gas Hydrate Prediction Methods and Control Measures. Liaoning Chem. Industry 1, 73. doi:10.14029/j.cnki.issn1004-0935.2016.01.025
Yan, K., Sun, C. Y., and Zhang, H. X. (2016). Experimental Study on Flow Characteristics of Hydrate Slurry Containing Hydrate Polymerization Inhibitor. Sci. Technol. Eng. 16 (15), 72.
Yue, C. (2020). Study on the Inhibiting Effect of Gas Hydrate Anti-agglomerants in Oil-Gas-Water Co-transportation Systems. MA thesisQingdao Shandong province China: China University of petroleum East China.
Keywords: hydrate, anti-agglomerant, polymer, drilling fluid, low water cut
Citation: Li X and Meng Z (2022) Experimental Study on the Potential of Polymeric Drilling Fluid Additives as Hydrate Anti-Agglomerants by Using Rocking Cell. Front. Energy Res. 10:884578. doi: 10.3389/fenrg.2022.884578
Received: 26 February 2022; Accepted: 28 March 2022;
Published: 09 May 2022.
Edited by:
Esmail Lakzian, Hakim Sabzevari University, IranReviewed by:
Nagentrau Muniandy, Taylor’s University, MalaysiaHongsheng Dong, Dalian Institute of Chemical Physics (CAS), China
Copyright © 2022 Li and Meng. This is an open-access article distributed under the terms of the Creative Commons Attribution License (CC BY). The use, distribution or reproduction in other forums is permitted, provided the original author(s) and the copyright owner(s) are credited and that the original publication in this journal is cited, in accordance with accepted academic practice. No use, distribution or reproduction is permitted which does not comply with these terms.
*Correspondence: Xufeng Li, bGl4dWZlbmcxMDEyQDE2My5jb20=
 Xufeng Li
 Zilong Meng