- 1College of Mechanical and Electrical Engineering, Changsha University, Changsha, China
- 2College of Mechanical and Electrical Engineering, Central South University, Changsha, China
- 3Shenzhen Research Institute of Central South University, Shenzhen, China
Through discrete element method-computational fluid dynamics, the internal flow field and particle motion law of a two-stage deep-sea lifting pump at different rotational speeds were analyzed in this work. In addition, the physical phenomena, such as flow field velocity, secondary flow, and particle flow, were studied. The relationship between the rotational speed of the lifting pump and solid–liquid two-phase flow was investigated. An experiment on the hydraulic performance of the lift pump showed that the resulting lift and efficiency were consistent with the numerical simulation data. When the rotational speed was 1,450 rpm, the particles can obtain a higher kinetic energy from the flow field, the flow was more stable, and particle deposition was reduced.
Introduction
Oceans contain many resources, including rich deep-sea mineral resources. For example, the total rare earth reserves in the North Central Pacific and Southeast Pacific Oceans are approximately 88 billion tons, which is more than 800 times the total rare earth resources on land (approximately 110 million tons) (Kato et al., 2011). In deep sea mining, lift pumps are key pieces of equipment for ore transportation. The performance (Chen, 2019) and safety of the lifting pump are important aspects of the operating efficiency of the entire deep-sea mining system. Zou et al. (2013) studied the lifting problem of electric transmission pumps and proposed a two-phase flow model of a homogeneous slurry. Dong et al. (2018) used a two-phase flow model of a homogeneous slurry to divide the solid particle size, thereby promoting the research on solid–liquid two-phase flow in deep-sea mining. However, their research utilized the traditional discrete phase model, whereby the mixture of fine particles and seawater was considered a homogeneous slurry, and the particle size ratio, and collision and aggregation between the particles were ignored. Furthermore, the interaction between the particles and fluid was not considered. He et al. (2018) proposed discrete element method-computational fluid dynamics (DEM-CFD) to study the gas–solid two-phase flow. Ebrahimi and Crapper (2017) studied the dynamic principle of DEM-CFD on a solid–liquid two-phase fluid flow. Hu et al. (2021) studied the internal flow of the pump through DEM-CFD coupling simulation and obtained the results for deep-sea pumps in extreme cases, such as surpassing the rated concentration, transportation of extremely large particles, deviation from the rated flow, and return flow of the slurry in the event of a power failure. For investigating the flow characteristics, Li et al. (2019) studied the external characteristics of the pump at different speeds and return flow rates of the pump based on DEM-CFD. These reports results provide favorable support for the study of solid–liquid two-phase flow in deep-sea mining. Wang et al. (2021) studied the influence of the particle migration characteristics on the pump flow and wear. Yang et al. (2014) analyzed the influence of the rotational speed on the solid–liquid two-phase flow, and pointed out that the volume distribution of the particles on the surface of the space guide vane is less affected by the rotational speed. Hu et al. (2020) used DEM-CFD to study the particle transport problem in Y-shaped elbows, and discussed the flow process of particles and fluids at different transport speeds. Liu et al. (2020) studied the effect of particle volume fraction on the performance of deep-sea electric pumps based on the DEM-CFD method. However, these previous studies ignored the interaction between particles. Moreover, the calculation process assumed that no slip exists between the particles and wall. Although this assumption is rational when the particles are smaller, large particle sizes have stronger interparticle interactions. In addition, the relative slip between the particles and wall affects the flow field and interaction between the particles.
Thus, in deep-sea mining, the solid–liquid two-phase flow in the flow channel of the lifting pump is complicated, which is reflected in the random collisions between particles, interactions between the particles and walls, turbulence of the fluid and particles, and interactions between fluids (Chen et al., 2021). In the exploration of deep-sea lifting pumps, computational fluid dynamics (CFD) methods have been widely used to simulate pumps in clean water conditions. However, CFD methods can only calculate the properties of the fluid. Discrete phase model addresses the dynamics of small particles in liquids. This model ignores the particle volume, reduces the particles to Lagrangian particles, and ignores the collisions between the particles (Safaei et al., 2014); thus, it is not suitable for large-diameter particle dynamics (Rashidi et al., 2017). The DEM involves coupled calculations of CFD and DEM realized by the soft sphere method, inter-particle collision, and particle volume fraction. This approach can obtain the fluid and particle properties of a solid–liquid two-phase flow with high accuracy, which is useful in mud transportation simulation. Chen et al. (2020) used the DEM-CFD coupling method to simulate the working conditions of different shapes and concentrations of horizontal pipeline transportation, and obtained the relationship between the effects of the particle characteristics on the efficiency of slurry transportation and flow characteristics. In this study, the DEM-CFD method was employed to investigate the movement of the fluid and particles in a two-stage pump flow path at different speeds.
Numerical Simulations
Particles move independently from each other, and interactions occur when the particles collide with each other and with the walls. The lifting motion of the particles in the fluid is affected by the drag force, which is calculated as
CD is the drag coefficient, expressed as
where Rep is the Reynolds number, ρf is the solid–liquid two-phase flow density (kg/m3), μf is the solid–liquid two-phase flow viscosity (Pa·s), di is the particle diameter (m), uf is the fluid velocity (m/s), and up is the particle velocity (m/s).
The pressure gradient force is expressed as
The additional mass force is expressed as
The Basset force is expressed as
The Saffman force is expressed as
The Magnus force is expressed as
where ω is the angular velocity of the particles (rad/s) and dp is the particle diameter (m).
A frictional force is developed owing to the difference between the speeds of the solid particles and liquid phase; the frictional force of the liquid phase flow is given by
The interaction between the particles and fluid is expressed as
The equation for the dynamic movement of the particles can be obtained using the collision relationship between the particles, and interaction between the fluid and particles, as follows:
where F is the resultant force of the normal and tangential contact forces, and M is the resultant moment of the particle tangential and rolling frictional moments.
At present, the Verlet and Euler methods are often used to solve the dynamic equation of a particle, and the position, velocity, and acceleration of the particle are superimposed and calculated by Taylor series expansion (Childs, 1991).
The Verlet algorithm was proposed by Loup Verlet in the 1860s. This method is widely used in the field of molecular dynamics and has gradually been applied to solve the Newtonian equations of motion of particles (Gonzalez et al., 2006).
In DEM-CFD, the fluid and particles are considered separately in the coupling calculation. First, the flow field is calculated in Fluent. After the flow field iteration is completed, the data are transmitted to the EDEM solver. The particles are used as discrete phases in EDEM to calculate the flow field information. Parenteau (2010) conducted numerical simulations of a solid–liquid two-phase flow in deep-sea mining using the CFD and DEM-CFD coupling calculation methods. The CFD method did not calculate the interaction between the particles and wall, and the simulation results are different from the experimental results. Meanwhile, the DEM-CFD method considers the interaction between the particles and walls, and has greater calculation accuracy than the CFD method. Thus, the DEM-CFD method has significant advantages in the analysis of a solid–liquid two-phase flow. Compared with the traditional CFD method, the particle movement in the pump can be accurately analyzed.
As a rotating fluid machine, the lifting pump adopts a rotating coordinate system based on the axial direction of the impeller rotating shaft. Under this coordinate system, the continuity equation and Navier–Stokes equation of the relative velocity of the liquid phase are
where
where upi is the solid phase velocity vector.
3D Model and Meshing
In this study, the production capacity of the mining system was set to 30 t/h. The particle volume concentration was set to 6%. The maximum particle size was 20 mm, and the flow rate was 420 m3/h. In the simulation, a single particle size of 20 mm was used according to the project requirements, and the particle concentration was controlled with the mass flow rate of 14 kg/s.
The DEM-CFD coupling was based on the Euler–Lagrange method and implemented on the FLUENT-EDEM platform. The flow field information of the fluid in the computational domain was first computed in Fluent for a time step. When the convergence conditions were reached, the drag and lift forces of the particles were calculated, and the information was transmitted to the EDEM. EDEM calculated the particle position, velocity, volume, etc., and passed this information back to Fluent. Thus, the particle and flow field information for the next time step was cyclically updated.
The impeller and diffuser of the multi-stage pump are composed of duplex stainless steel with a density of 7,850 kg/m3, Poisson’s ratio of 0.33, and shear modulus of 7.744 10+10. The contact force of the particles was calculated by the Hertz–Mindlin no-slip model. The lift model adopted the Saffman and Magnus lift models, and the particle–particle and particle–pump interaction settings are shown in Table 1.
As the consistency of the EDEM and Fluent data at the inlet and outlet promotes stabilization and convergence, it is preferable to use the predefined pressure outlet and velocity inlet as the boundary conditions for the Fluent data. The EDEM particle factory was set to an infinite number model, thereby randomly generating particles on the same inlet plane as that of the Fluent based on the particle mass flow, and setting equal velocities for the particles and fluid. The data between different sub-computing domains were passed through interfaces. The physical properties of water were set to a temperature of 20°C, density of 0.9982 g/cm3, and viscosity of 1.003 × 10⁻³ Pa·s. Renormalization group k–ε was chosen as the turbulence model for the refinement of the swirl effect under turbulence. This refinement enhanced the accuracy of the swirling flow in deep-sea lifting pumps. The standard wall treatment, which can effectively handle most industrial flow at y+ of 15–100 near the solid wall, was set as the wall function.
SIMPLEC was used for the pressure–velocity coupling method, which increased the moment, turbulent kinetic energy, and turbulent dissipation rate to the second-order upwind to improve the accuracy of the simulation. The time step was fixed as the elapsed time per 4° of pump rotation: 4.6 × 10⁻⁴ s for 1,450 rpm, 5.442 × 10⁻⁴ for 1,300 rpm, 6.123 × 10⁻⁴s for 1,100 rpm, and 6.9074 × 10⁻⁴ s for 1,000 rpm. The convergence rule for all residuals was set to 1 × 10⁻⁴.
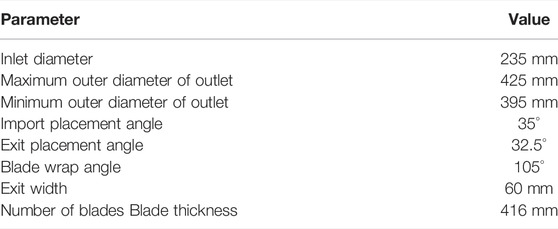
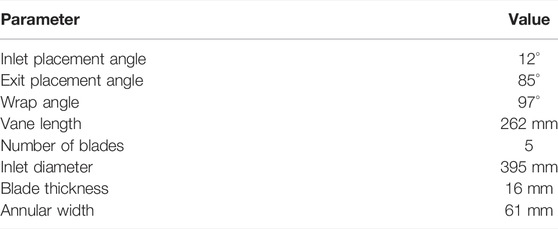
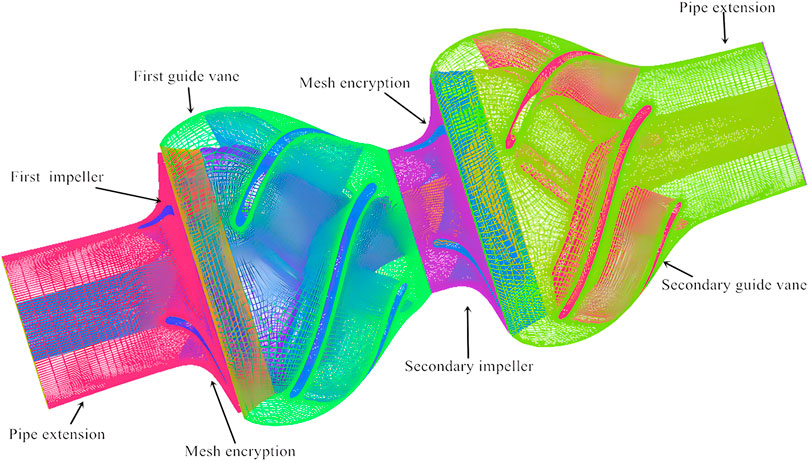
The parameters of the impeller are listed in Table 2. Table 3 shows the space guide vane parameters of the deep-sea lifting pump. Figure 1 shows a grid diagram of the two-stage deep-sea lifting pump. The inlet section of the first-stage impeller and outlet section of the second-stage space guide vane were lengthened for the smooth entry of the flow field. The grid was dense at the turning points of the first-stage and second-stage impellers, which was beneficial for the calculation of the flow field. The computational domain model was divided into five unstructured meshes with different grid qualities in ICEM. The simulation results are shown in Table 4. The grid-independence simulation test showed that a satisfactory result could be guaranteed for 2300000 grids.
Numerical Calculations
The inlet velocity of the fluid and particles were both set to 3.16 m/s. The coarse-grained ore has spherical particles with a volume fraction of 6% for the 20-mm particles. The impeller speed was set to 1,100, 1200,1300, and 1,450 rpm, according to China’s key R&D program—Deep Sea Polymetallic Combined Mining and Test Engineering.
Figure 2 shows the flow lines and particle velocity diagrams of the two-stage deep-sea lifting pump. The velocity of the particles is lower than the velocity of the fluid, indicating that there is no advance phenomenon during the lifting process. The maximum velocity of the particles and streamlines occurred at the end of the blade. At a speed of 1,100 rpm, the maximum velocity of the particles is 10.2 m/s. As the rotational speed increased, the velocity of the particles and fluid increased. As shown in Figure 2D, the particle velocity reached 19.1 m/s. The blade accelerated the particles well, facilitating their easy passage through the deep-sea lifting pump. After the blade accelerated the particles, they entered the space guide vane. When the particles are thrown from the blade, they hit the outer shell of the space guide vane, resulting in substantial energy loss. The pressure surface of the space guide vane is in contact with the suction surface. As shown in Figure 2, the particles on the pressure surface of the space guide vane are larger than those on the suction surface. Therefore, the pressure surface of the space guide vane will undergo more collisions, and its wear will exceed that of the suction surface. In the two-stage deep-sea lifting pump, the number of particles in the first-stage pump is greater than that in the second-stage pump because of the numerous particles that suddenly entered the pump body, resulting in excessive particle concentration at the junction. With the increase in speed, the number of particles in the first-stage pump decreased, resulting in the significant improvement of the flow capacity. In the deep-sea lifting pump, there is a high possibility of blockage of the first-stage pump.
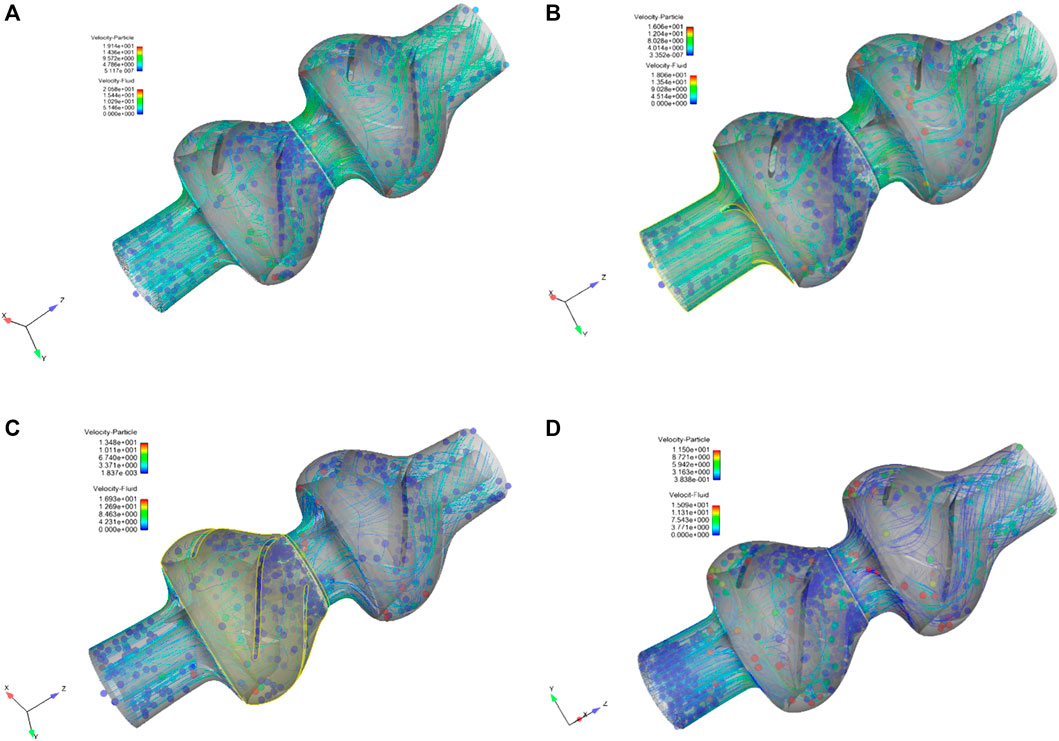
FIGURE 2. Streamline and particle velocity diagrams of the two-stage deep-sea lifting pump: (A) 1,100 rpm, (B) 1,200 rpm, (C) 1,300 rpm, and (D) 1,450 rpm.
The fluid moved spirally along the direction of rotation of the impeller blade and reached the maximum speed at the end of the blade. The maximum speed reaches 14.4 m/s (Figure 2A) and 20.5 m/s (Figure 2D). The fluid flows smoothly in the impeller and space guide vanes, indicating the reasonable design of the impeller and space guide vane, and improved pump efficiency. After the fluid enters the space guide vane, the kinetic energy is gradually converted into pressure, thereby decreasing the speed. Local agglomeration occurred at low speeds and decreased as the speed increased. At a higher rotational speed, the uneven transmission of the particles are weakened, thereby stabilizing the particle transmission, and improving the efficiency and head of the pump.
When the rotational speed increased, the acceleration effect of the impeller on the solid–liquid two-phase flow increased, and the movement of the solid–liquid two-phase flow in the impeller and space guide vane stabilized. This is conducive to the transportation of solid–liquid two-phase flows.
Figure 3 shows the axial velocity cloud diagram of the flow field of the two-stage deep-sea lifting pump. As the deep-sea lifting pump is used for lifting solid particles, the axial velocity directly determines the improvement in the solid–liquid two-phase flow. As shown in Figure 3, the axial velocity at the inlet of the impeller is relatively higher than that at the impeller blades. The speed is relatively small because the rotation of the fluid through the blades changes the direction of the fluid velocity from axial to radial. After flowing out of the impeller, the fluid enters the space guide vane, which turns and stabilizes the flow. Consequently, the axial velocity of the fluid increases, and it enters the second-stage impeller with higher stability. As the speed increases, the axial velocity of the fluid at the outlet of the second-stage space guide vane increases from 4.6 m/s to 6.3 m/s. This also indicates the further increase of the lifting capacity of the deep-sea lifting pump for a solid–liquid two-phase flow.
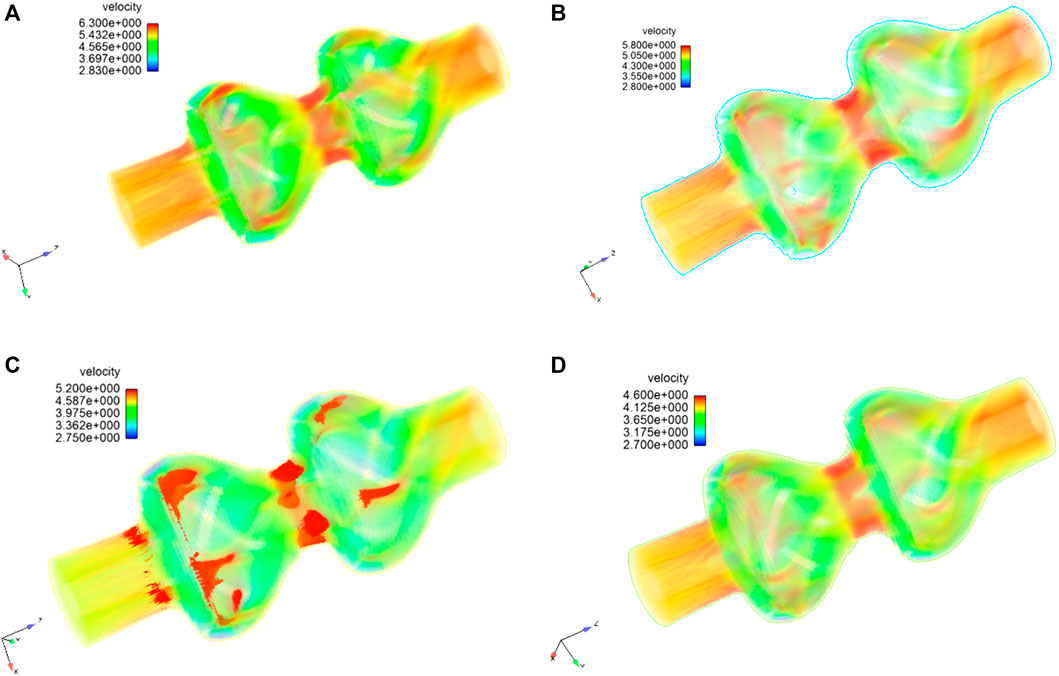
FIGURE 3. Axial velocity cloud diagrams of the flow field of the two-stage deep-sea lifting pump: (A) 1,100 rpm, (B) 1,200 rpm, (C) 1,300 rpm, and (D) 1,450 rpm.
Figure 4 shows the fluid velocity vector diagram of the impeller section at different speeds. A high-speed area, called the “jet area,” appears near the pressure surface of the impeller blade, and a low-speed area, called the “wake area,” is formed near the suction surface of the impeller blade. As shown in Figure 4D, the relative speed in the impeller channel is higher, which suppressed the separation of the boundary layer; thus, no vortex is formed. At the exit of the impeller, the maximum velocity of the jet and wake areas are 25.3 and 20.66 m/s, respectively, and the relative velocity gradient of the jet wake is small.
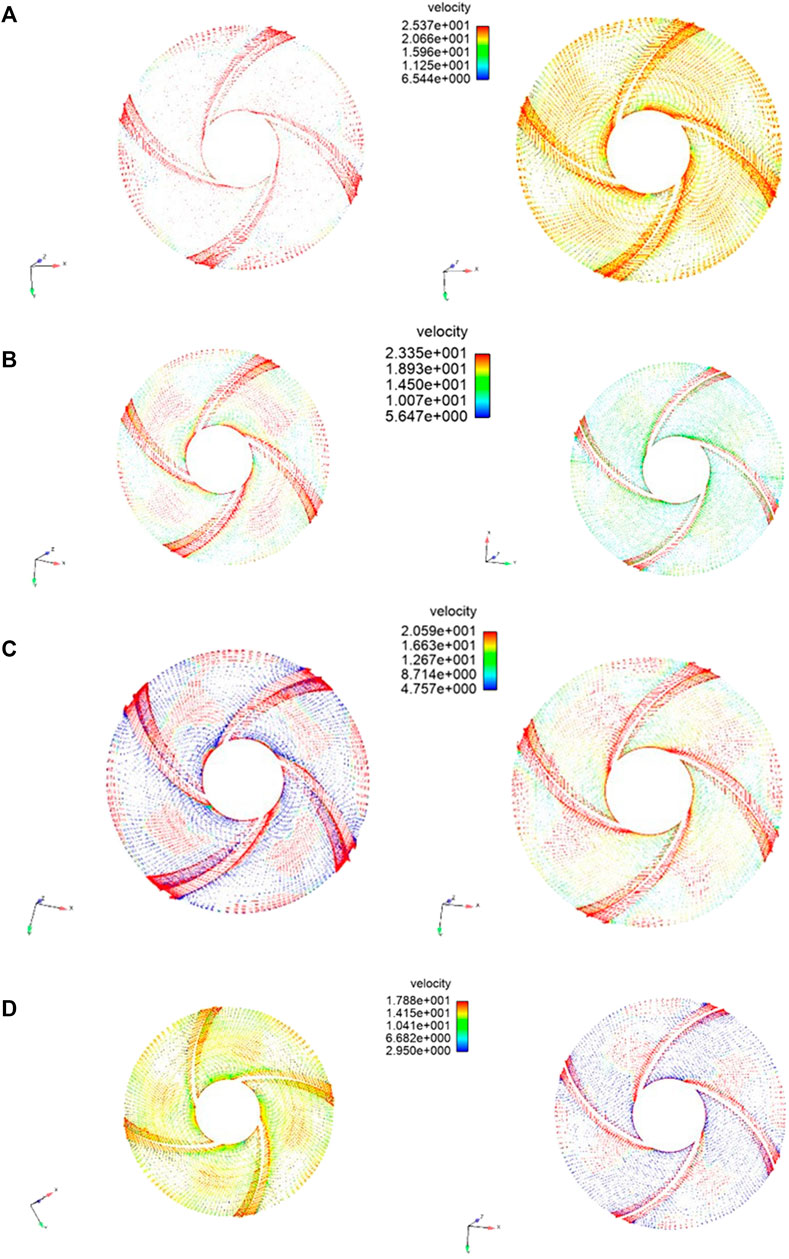
FIGURE 4. Flow velocity vector diagrams of the impeller section: (A) 1,100 rpm, (B) 1,200 rpm, (C) 1,300 rpm, and (D) 1,450 rpm.
At low rotational speeds, the vortex range increased, thereby reducing the hydraulic efficiency, increasing the squeezing effect of the impeller blades, and weakening the flow capacity of the particles. As shown in Figure 4A, the maximum velocity of the jet and wake area are 17.8 and 2.95 m/s, respectively. The relative velocity gradient of the jet wake is large. A larger jet wake structure increased the hydraulic loss of the lifting pump. The jet wake velocity gradient at the first-stage impeller is larger than that at the second-stage impeller because the former has more particles. As the rotating speed of the impeller blades increases, the speed of the fluid on the blades increases, which is beneficial for fluid transportation and reducing the generation of vortices.
The secondary flow is an important parameter for studying the flow field in a flow channel. The generation of a secondary flow has a significant influence on the efficiency of deep-sea pumps. Thus, the secondary flow in the flow channel was studied, and a vector diagram was created. Figures 5, 6 show the distribution of the secondary flow in the connection between the impeller and space guide vane, and that in the space guide vane, respectively.
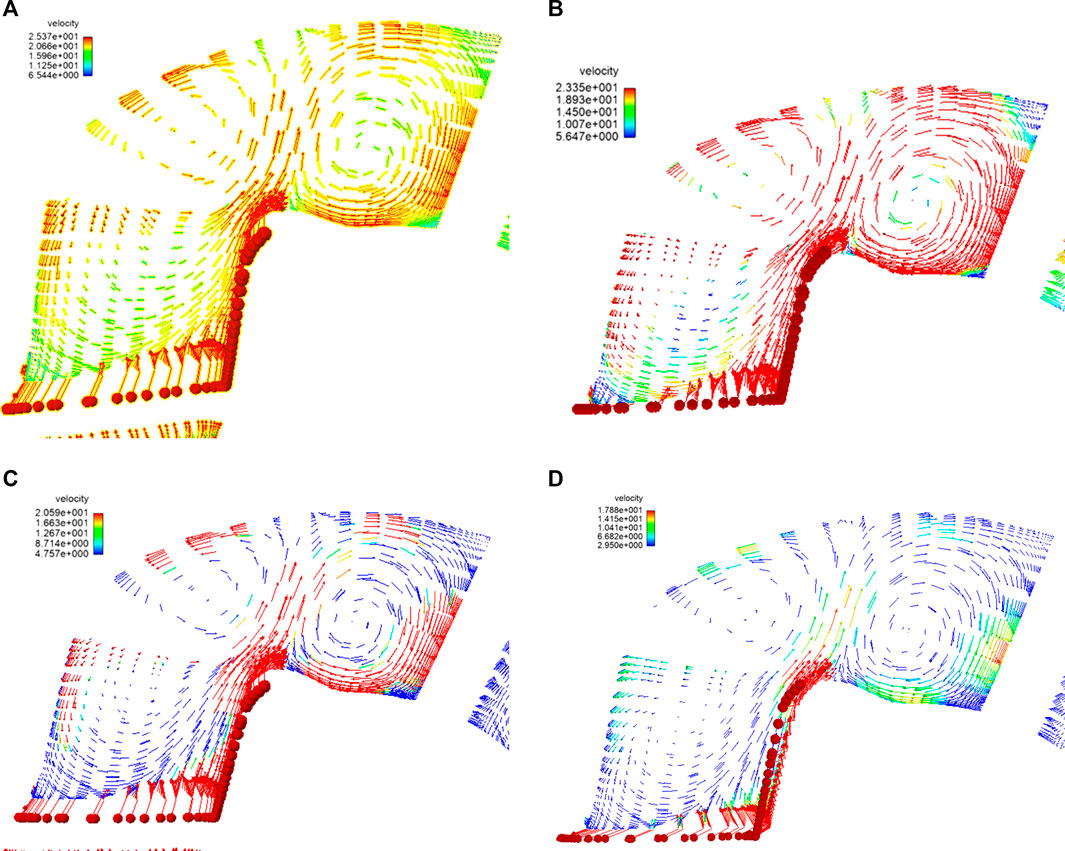
FIGURE 5. Distribution of the secondary flow in the link between the impeller and space guide vane: (A) 1,100 rpm, (B) 1,200 rpm, (C) 1,300 rpm, and (D) 1,450 rpm.
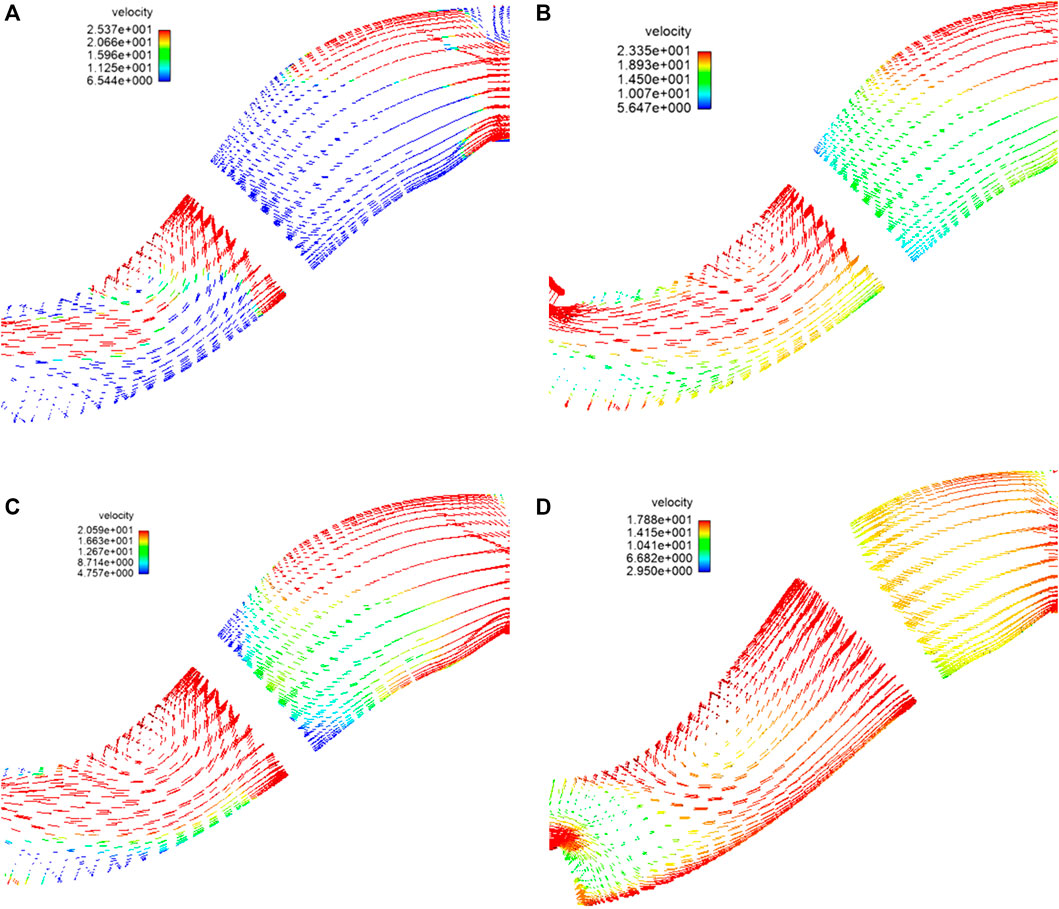
FIGURE 6. Distribution of the secondary flow in the space guide vane: (A) 1,100 rpm, (B) 1,200 rpm, (C) 1,300 rpm, and (D) 1,450 rpm.
When the fluid enters the inlet of the space guide vane from the outlet of the impeller, the velocity changes from radial to axial, and the pressure direction changes. The junction between the impeller and space guide vane has a large curve, where the fluid impacts the impeller and space guide vane. A secondary flow appears in the guide vane shell, forming a pair of vortices in the opposite directions, which are called “basic vortices.” As the rotational speed increases, the outlet flow rate increases, which increases the basic vortex and hydraulic loss. However, from the perspective of the entire lifting process of the deep-sea lifting pump, a speed increase is beneficial to the hydraulic efficiency of the pump. The bend of the runner has a significant influence on the appearance of the basic vortex. In the deep-sea lifting pump, the basic vortex occupies the majority of the flow channel and causes the accumulation of particles.
After the fluid enters the space guide vane, the basic vortex begins to flow to the outer shell of the space guide vane to form a new vortex, called the “curvature vortex,” which gradually became smaller. As the speed of the main flow in the flow channel of the space guide vane increases, the pressure gradient decreases, the curvature vortex begins to decrease, and the flow begins to stabilize, which is conducive to the transportation of the solid–liquid two-phase flow.
The volume concentrations of the particles are listed in Table 5. The particle volume concentration at the first-stage impeller space guide vane is higher than that at the second-stage impeller space guide vane. Owing to its high-speed rotation, the particle volume concentration in the first-stage impeller is slightly lower than that in the second-stage impeller. This is because when the particles enter the first-stage impeller from the extension section of the inlet, the stagnation effect of the particles is stronger, resulting in a higher particle volume concentration. After entering the space guide vane, the particles maintained a high speed. With the turning of the space guide vane and under the effect of steady flow, the kinetic energy of the particles in the space guide vane continuously decreases. When the particles enter the second-stage impeller from the first-stage space guide vane, the collision between the particles increases owing to the gradual narrowing of the vane channel. This results in increased friction between the particles and energy loss. The particle flow is obstructed, resulting in increased volume concentration at the exit of the first-stage space guide vane. This effect increases with decreasing speed.
When the speed is increased from 1,100 to 1,450 rpm, the volume concentrations at the first-stage and second-stage impellers reduced by 0.85 and 0.82%, respectively. The change in the concentration has minimal effect. The volume concentration at the first-stage guide vane is less than 0.36%, whereas that at the second stage is less than 0.7%. The influence of the second-stage space guide vane is higher than that of the first-stage space guide vane. Meanwhile, for the particles at 1,450 rpm, the volume concentrations at the first-stage space guide vane and second-stage impeller are similar; however, the volume concentrations at the first- and second-stage space guide vanes are significantly different, which indicates that the influence of the rotational speed of the latter is greater than that of the former.
As the rotational speed increases, the relative velocity between the particles and fluid decreases, the followability of the particles improves, and the particles can pass through the flow channel easier. Therefore, selecting the optimal operating speed of the pump can ensure efficiency and flow capacity. There may be extensive particle siltation on the blades at the outlet of the first-stage space guide vane and inlet of the second-stage impeller.
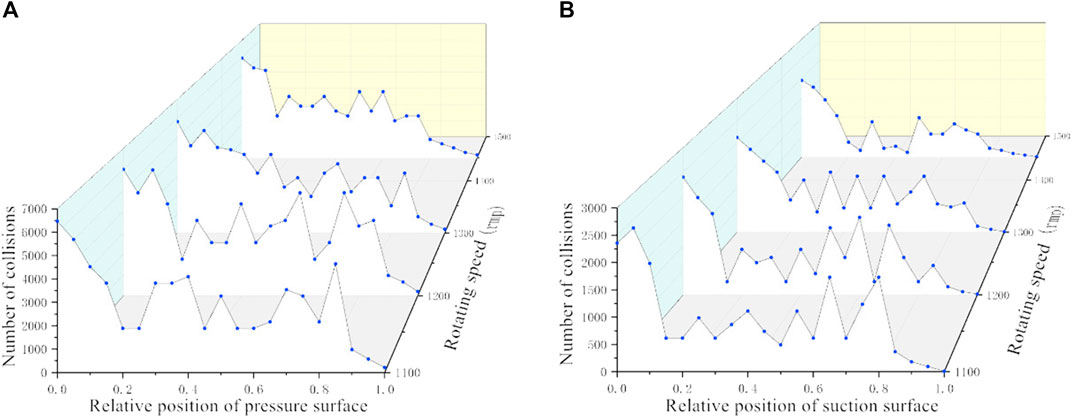
The particle distribution and wear were studied through the particle collisions on the impeller and space guide vane. Figure 7 shows the statistics of the particle collisions on the pressure and suction surfaces of the impeller blade. As the collision between the first-stage and second-stage impellers is similar, the erosion position can be predicted by analyzing the collision of the first-stage impeller.
As the particles in the deep-sea lifting pump are driven by the high-speed rotation of the impeller, they hit the pressure and suction surfaces of the blade, causing erosion and wear of the blade wall. As shown in Figure 7 (1.0 on the horizontal axis denotes the end of the blade), the numbers of particle collision at different speeds are approximately constant. The number of collisions on the pressure surface of the blade is higher than that on the suction surface, indicating that the wear of the pressure surface is stronger than that of the suction surface. When the relative position is less than 0.2, the number of particle collisions on the pressure surface of the blade increases, which intensifies its wear. With the increase in speed, the number of particle collisions gradually decreases, indicating that the flow of the particles tends to stabilize.
Figure 8 shows the statistics of the effect of the particles on the pressure and suction surfaces of the space guide vane blade, where 1.0 on the horizontal axis denotes the end of the space guide vane blade. When the relative position is less than 0.4, the collision of the particles on the suction surface of the space guide vane blade increases. With the movement of the particles in the flow channel, the relative position exceeds 0.6. The pressure surface of the space guide vane has more collisions, indicating that the particles gradually approached this surface during their flow. The rotational speed has minimal effect on the number of particle collisions on the pressure and suction surfaces of the space guide vane.
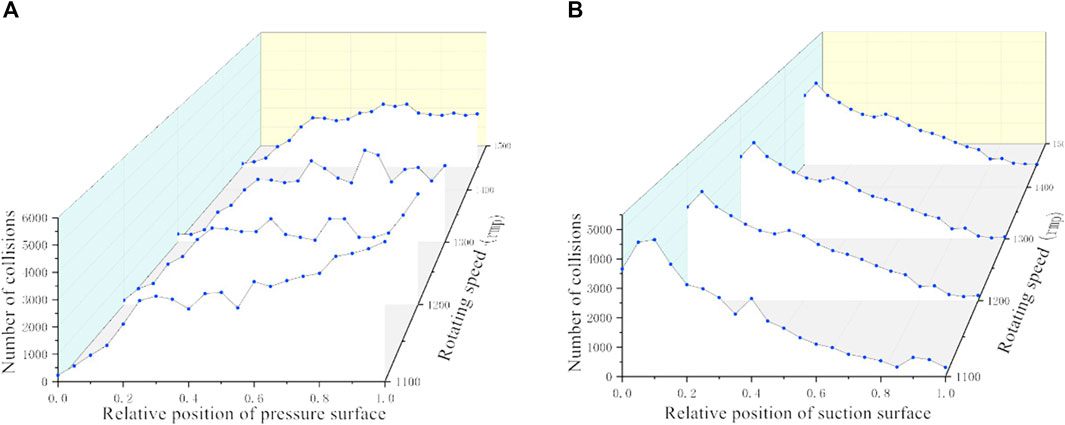
FIGURE 8. Number of particle collisions on the pressure and suction surfaces of the space guide vane blade.
Experiment
The phenomenon of inter-stage matching occurs during the lifting process of the multi-stage pumps. Therefore, to ensure the smooth progress of the sea trial of the deep-sea lifting pump and verify the numerical simulation model developed in this study, a two-stage deep-sea lifting pump was used in the experimental test. The solid–liquid two-phase fluid concentration was equal to 6% in the test. The particles are manganese nodules with a diameter of 20 mm and flow rate of 420 m3/h. The speeds of 1,000, 1,100, 1,200, 1,300, and 1,450 rpm were selected. The two-phase flow tests were done under the aforementioned condition.
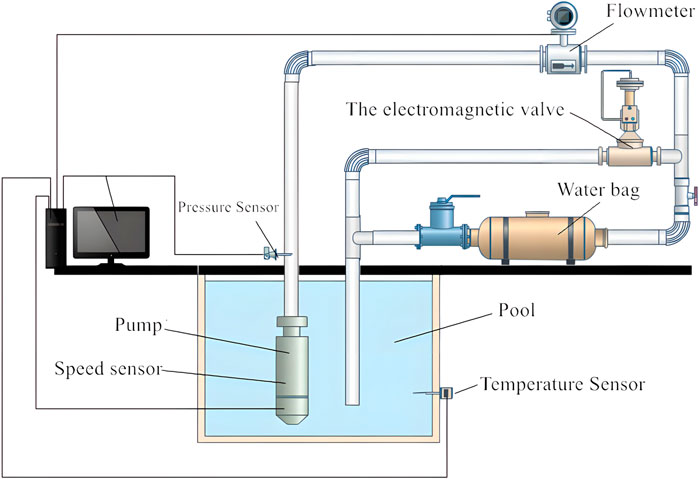
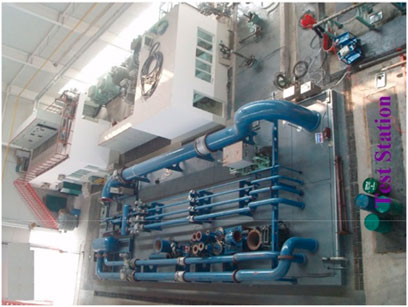
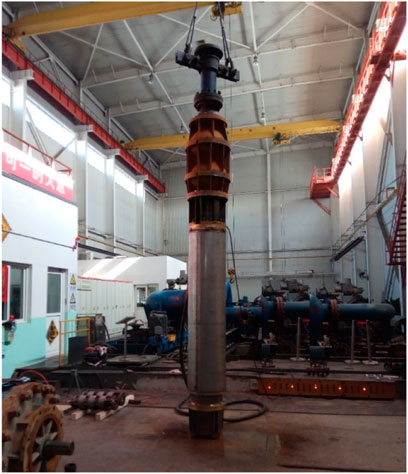
The two-stage pump tests was conducted at Tianjin Bailiyitong Electric Pump Co., Ltd. The company has an advanced high-pressure platform for conducting diving tests. The pump test system included a test pump well with a depth of 9 m in the test pool, pipelines, and valves. The schematic of the test loop is shown in Figure 9. The pump test field is shown in Figures 10, 11. The test instruments include the pump inlet and outlet pressure sensors, electromagnetic flow meters, pump speed sensors, current, voltage, and power factor measuring instruments, as shown in Figure 11. The test parameters were consistent with the simulation parameters.
The test steps include the test preparation and testing. The test preparation was carried out as follows:
1) The structural parameters of the pump under test were verified to ensure that they are within the design error;
2) The surface roughness of the overcurrent parts of the pump under test was recorded;
3) The pump under test was installed, and the pump shaft by hand was tested;
4) The normal rotation of each rotating part without interference was ensured;
5) All sensors were checked;
6) The status of each valve in the required position was checked.
The test process was conducted as follows:
1) The main control power switch (leakage micro-break) of the submersible low-voltage test bench and DK1 main power switch were turned on;
2) The isolating switch of the SD4 cabinet was adjusted to a high voltage;
3) The combination switch of the diving high-pressure table was turned to the T1 (high-pressure table) position;
4) The submersible high-voltage test bench master control power switch (leakage micro-break) was turned on;
5) The high-pressure test bench DK2.VS.1 was turned on;
6) The low-pressure test bench DK4 was turned on;
7) The boost button T1 of the diving high-voltage test bench was pressed to increase the voltage until the monitoring voltmeter showed that KV was approximately 40% of the rated voltage. The motor was started, and the value of the ammeter KA was observed and monitored, as was whether the current was balanced. The voltage was increased, the starting current was observed until the motor turned up, and the rated voltage was adjusted to test according to the test item;
8) The computer was turned on to enter the relevant acquisition program, and the test points were adjusted to collect the relevant data.
Figure 12 shows the control main circuit. Figure 13 shows images of the measurement and control system.
According to Eqs 16, 17, the head H and efficiency η can be calculated, respectively:
where p1 and p2 are the static pressures at the inlet and outlet of the deep-sea lifting pump, respectively; v1 and v2 are the average speeds of the inlet and outlet, respectively; and z1 and z2 are the shaft heights;
where ω3 is the rotational speed and M is the impeller torque; both of which can be obtained in the post-processing of the numerical simulation.
where
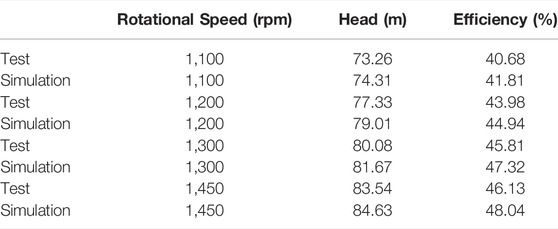
Table 6 lists the test and simulation results. The simulation results are significantly close to the experimental results. The simulated head and efficiency are the same as those in the experiment. The maximum errors of the head and efficiency are 2.14 and 3.12%, respectively, which proves that the numerical simulation model used in this study can reflect the actual situation.
Figure 14 shows a comparison of the flow field velocities obtained using the numerical simulation and experiment. The maximum speed error is 7.61%. With the increase in the rotational speed, the velocity of the flow field increases, indicating that the particles can obtain more kinetic energy from the flow field to sustain their movement, thereby reducing their deposition on the surfaces. The errors between both methods are less than 10%, which can be attributed to the standard spherical particles used in the simulation, even with the existence of other particle shapes in the experiment. The consistency between the experimental and numerical simulation results verifies the credibility of the numerical simulation.
From the experiment, the head and efficiency can satisfy the design requirements. With the deep-sea lifting pump speed of 1,450 rpm, the largest lift, efficiency, and fluid velocity are obtained, indicating that the particles can obtain more energy from the flow field. This confirms that the design of the flow channel is reasonable, which ensures the transportation of particles.
Conclusion
The operation of a deep-sea lifting pump was numerically simulated through DEM-CFD. The results of the model were verified experimentally. The following conclusions were obtained:
1) The test and simulation results were consistent, and the design requirements were met, indicating the excellent slurry transport performance of the pump. Thus, DEM-CFD can accurately predict the head and efficiency of multi-stage centrifugal pumps conveying coarse particle slurry.
2) As the speed increased, the accelerating effect of the impeller on the solid–liquid two-phase flow increased, and the movement of the solid–liquid two-phase flow in the impeller and space guide vane became more stable, which is conducive to the transportation of solid–liquid two-phase flows.
3) At low rotational speeds, the vortex range increased, thereby reducing the hydraulic efficiency. In addition, the squeezing effect of the blades increased, which weakened the flow capacity of the particles. A large jet wake structure increased the hydraulic loss of the lifting pump. Generally, the jet wake velocity gradient at the first-stage impeller was larger than that at the second-stage impeller owing to the presence of numerous particles in the former. When the rotational speed was 1,450 rpm, the outlet flow rate increased, and the hydraulic efficiency of the deep-sea lifting pump became more favorable. As the speed of the main flow in the space guide vane channel increased, the pressure gradient decreased, the curvature vortex began to decrease, and the flow stabilized, which is conducive to the transportation of the solid–liquid two-phase flow.
4) Based on the particle movements, the particle volume concentration at the first-stage impeller space guide vane was higher than that at the second-stage impeller space guide vane. The particles in the deep-sea lifting pump were driven by the high-speed rotation of the impeller, and hit the blades with pressure. The surface and suction surfaces caused the erosion and wear of the blade wall. As the rotational speed increased, the number of particle collisions gradually decreased, indicating the stabilization of the particle flow.
5) Through the experiments and numerical simulations, with the increase in the lift, the efficiency of the core pump and velocity of the flow field increased simultaneously, indicating that the particles can obtain more kinetic energy from the flow field. At a rotational speed of 1,450 rpm, the movement of the particles was ensured, thereby reducing their deposition. The results of the experiment and numerical simulation were consistent, indicating the credibility of the numerical simulation results.
In this study, spherical particles were mainly used to investigate the hydraulic lifting of the solid–liquid two-phase flow. In actual deep-sea mining, the particles crushed by the crusher are expected to have various shapes. Therefore, the influence of the particle shape on the hydraulic lifting should be further explored, and the theory proposed in this article should be further examined.
Data Availability Statement
The original contributions presented in the study are included in the article/Supplementary Material, further inquiries can be directed to the corresponding author.
Author Contributions
All authors listed have made a substantial, direct, and intellectual contribution to the work and approved it for publication.
Funding
This work was supported by the National Key R&D Program of China: Development and Test of Lifting Pump for Deep Sea Mining Test Project (2016YFC0304103-4) and a fund from the National Natural Science Foundation of China: Research on deformation bifurcation and instability mechanism of hyperelastic bilayer circular tube under complex Load (12002067).
Conflict of Interest
The authors declare that the research was conducted in the absence of any commercial or financial relationships that could be construed as a potential conflict of interest.
Publisher’s Note
All claims expressed in this article are solely those of the authors and do not necessarily represent those of their affiliated organizations, or those of the publisher, the editors and the reviewers. Any product that may be evaluated in this article, or claim that may be made by its manufacturer, is not guaranteed or endorsed by the publisher.
References
Brennen, C. E., and Yong, O. L. (2010). Multi-phase Flow Foundations. Rev. Foreign Sci. Tech. Books. 11, 21–22. doi:10.1080/14616701003638418
Chen, H., Liu, W., Chen, Z., and Zheng, Z. (2021). A Numerical Study on the Sedimentation of Adhesive Particles in Viscous Fluids Using LBM-LES-DEM. Powder Technol. 391, 467–478. doi:10.1016/j.powtec.2021.06.031
Chen, Q., Xiong, T., Zhang, X., and Jiang, P. (2020). Study of the Hydraulic Transport of Non-spherical Particles in a Pipeline Based on the CFD-DEM. Eng. Appl. Comput. Fluid Mech. 14, 53–69. doi:10.1080/19942060.2019.1683075
Childs, D. W. (1991). Fluid-structure Interaction Forces at Pump-Impeller-Shroud Surfaces for Axial Vibration Analysis. J. Vib. Acoust. 113, 108–115. doi:10.1115/1.2930144
Dong, Z., Liu, S., and Hu, X. (2018). Study on Calculation Method of Coarse Particle Two-Phase Flow. Mar. Eng. 36, 110.
Ebrahimi, M., and Crapper, M. (2017). CFD-DEM Simulation of Turbulence Modulation in Horizontal Pneumatic Conveying. Particuology 31, 15–24. doi:10.1016/j.partic.2016.05.012
González, J., Parrondo, J., Santolaria, C., and Blanco, E. (2006). Steady and Unsteady Radial Forces for a Centrifugal Pump with Impeller to Tongue Gap Variation. J. Fluids Eng. 128, 454–462. doi:10.1115/1.2173294
He, Y., Bayly, A. E., and Hassanpour, A. (2018). Coupling CFD-DEM with Dynamic Meshing: A New Approach for Fluid-Structure Interaction in Particle-Fluid Flows. Powder Technol. 325, 620–631. doi:10.1016/j.powtec.2017.11.045
Hu, Q., Chen, J., Deng, L., and Liu, S. (2021). CFD-DEM Coupling Simulation and Experimental Research on Deep Sea Lifting Pump under Extreme Conditions. Chin. J. Nonferrous Met. 9, 1–16. doi:10.3390/jmse9090987
Hu, Q., Zou, L., Lv, T., Guan, Y., and Sun, T. (2020). Experimental and Numerical Investigation on the Transport Characteristics of Particle-Fluid Mixture in Y-Shaped Elbow. J. Marine. Sci. Engineer. 8, 675. doi:10.3390/jmse8090675
Kato, Y., Fujinaga, K., Nakamura, K., Takaya, Y., Kitamura, K., Ohta, J., et al. (2011). Deep-sea Mud in the Pacific Ocean as a Potential Resource for Rare-Earth Elements. Nat. Geosci. 4, 535–539. doi:10.1038/ngeo1185
Li, Y.-w., Liu, S.-j., and Hu, X.-z. (2019). Research on Rotating Speed's Influence on Performance of Deep-Sea Lifting Motor Pump Based on DEM-CFD. Mar. Georesources Geotechnol. 37, 979–988. doi:10.1080/1064119x.2018.1514550
Liu, S., Li, Y., and Hu, X. (2020). Effect of Particle Volume Fraction on the Performance of Deep-Sea Mining Electric Lifting Pump Based on DEM-CFD. J. Mech. Eng. 56, 257
Parenteau, T. (2010). “Flow Assurance for Deepwater Mining.” in Proceedings of the 29th International Conference on Ocean, Offshore and Arctic Engineering, 49118. Shanghai, China: ASME, 11–21. doi:10.1115/omae2010-20185
Rashidi, S., Esfahani, J., and Ellahi, R. (2017). Convective Heat Transfer and Particle Motion in an Obstructed Duct with Two Side by Side Obstacles by Means of DPM Model. Appl. Sci. 7, 431. doi:10.3390/app7040431
Safaei, M. R., Mahian, O., Garoosi, F., Hooman, K., Karimipour, A., Kazi, S. N., et al. (2014). Investigation of Micro- and Nanosized Particle Erosion in a 90° Pipe Bend Using a Two-phase Discrete Phase Model. ScientificWorldJournal 2014, 740578–740590. doi:10.1155/2014/740578
Wang, R., Guan, Y., Jin, X., Tang, Z., Zhu, Z., and Su, X. (2021). Impact of Particle Sizes on Flow Characteristics of Slurry Pump for Deep-Sea Mining. Shock Vib. 9, 88–97. doi:10.1155/2021/6684944
Yang, F., Chen, Q., and Zeng, Y. (2014). Research on the Design Method of Deep-Sea Mining Slurry Pump. J. Hefei Univ. Technol. 12, 1413.
Keywords: DEM-CFD, deep-sea mining, pump, particle, solid-liquid two phase
Citation: Yuanwen L, Zhiming G, Liu S and Xiaozhou H (2022) Flow Field and Particle Flow of Two-Stage Deep-Sea Lifting Pump Based on DEM-CFD. Front. Energy Res. 10:884571. doi: 10.3389/fenrg.2022.884571
Received: 26 February 2022; Accepted: 19 April 2022;
Published: 04 May 2022.
Edited by:
Ling Zhou, Jiangsu University, ChinaReviewed by:
Hao Yan, Hefei University of Technology, ChinaXianghui Su, Zhejiang Sci-Tech University, China
Copyright © 2022 Yuanwen, Zhiming, Liu and Xiaozhou. This is an open-access article distributed under the terms of the Creative Commons Attribution License (CC BY). The use, distribution or reproduction in other forums is permitted, provided the original author(s) and the copyright owner(s) are credited and that the original publication in this journal is cited, in accordance with accepted academic practice. No use, distribution or reproduction is permitted which does not comply with these terms.
*Correspondence: Hu Xiaozhou, Y3N1X2h1eGlhb3pob3VAMTYzLmNvbQ==
 Li Yuanwen
 Guo Zhiming1
