 Yan Peng1
 Sheng Chen
- 1State Grid Zhejiang Electric Power Research Institute, Hangzhou, China
- 2The College of Energy and Electrical Engineering, Hohai University, Nanjing, China
With the increasing penetration of new-type loads such as electric vehicles and hydrogen fuel vehicles in urban power grids, the peak-to-valley load difference increases sharply, and a multi-energy coordination model is desirable. This article proposes a day-ahead operation model of an urban energy system considering traffic flows and peak shaving, which can positively contribute to multi-energy complement and low-carbon emission. The proposed model minimizes the total cost of electricity and gas by optimizing the charging and discharging strategies of energy storage, in which the output of the wind turbine and energy management of the energy hub are adaptively adjusted. The urban energy system is represented by a second-order cone (SOC) energy flow model, and hence, the optimization problem is modeled as a mixed integer SOC programming (MISOCP). Finally, test results on an integrated urban energy network indicate that the energy storage and multi-energy coordination can alleviate the peak load cutting and valley filling. The relationship between urban grid operation cost and peak-valley difference is also discussed. The maximum utilization of renewable energy sources using gasoline vehicles has been presented in this study to illustrate cost and emission reductions for a sustainable integrated electricity and transportation infrastructure.
1 Introduction
1.1 Motivation
In recent years, energy consumption and global environmental problems have become increasingly serious, and the energy transition toward a low-carbon energy system is highly desirable (Zhao et al., 2017). The energy internet provides great potential for reliable power supply and an improved energy efficiency by integrating various energy production/conversion components, including renewable energy sources (RESs), energy storage systems (ESSs), hydrogen fuel vehicles (HVs), and electric vehicles (EVs) (Strasser et al., 2015; Meng and Wang, 2017; Yang and Fang, 2017). At the same time, interactions between urban electrical, transportation, and natural gas systems have become increasingly common due to the utilization of coupling components such as microturbines, combined heat and power (CHP), and power to gas units (Mancarella, 2014; Shabanpour-Haghighi and Seifi, 2015). The coupling of urban multi-energy networks positively contributes to the improved energy utilization efficiency, multi-energy complement, and the construction of a low-carbon sustainable energy system (Xu et al., 2020).
Traditionally, coupled energy systems have been operated and optimized independently (Chen et al., 2014). The urban distribution network that is inactive generally has limited ability toregulate power flow, which results in the problem of a large difference between the daily peak and valley of the net load (Uddin et al., 2018). On the other hand, the traditional energy storage has relatively small storage capacity with a high investment cost, and hence, it is difficult to store energy effectively on a large scale and for a long time (Zhao et al., 2020). Considering the fact that the traditional urban distribution network cannot fully meet the electricity demand of new-type loads such as EVs and HVs, the development of day-ahead co-optimization of multi-energy systems is of considerable interest.
Owing to the aforementioned considerations, the present work develops a day-ahead co-optimization strategy for urban energy networks considering traffic flows.
1.2 Literature Review
1.2.1 Research on Power-Transportation Coordination
EVs and HVs have become a promising alternative to gasoline vehicles (GVs) for decarbonizing the transportation sector and combating climate change (IEA, Global EV Outlook, 2020). An integrated demand response framework is designed to regulate flexible resources in both networks through optimal road tolls and electricity tariffs in Lv et al., 2021a. In Rotering and Ilic (2011), the problem of growing peak load and grid overloading is addressed based on a forecast of future electricity prices, and the dynamic programming algorithm is employed to find the economically optimal solution for the vehicle owner. Hu et al. (2016) present an integrated optimization framework for battery sizing, charging, and on-road power management in plug-in hybrid EVs. The maximum utilization of RESs using GVs has been presented in Saber and Venayagamoorthy (2011) to achieve cost and emission reductions, which contributes to a low-carbon integrated electricity and transportation infrastructure. We note that most works consider the coupling between the transportation system and the power grid. However, the coupling between the power, natural gas, and the transportation system has not been well considered.
1.2.2 Coordinated Optimization of Multi-Energy Systems
A day-ahead optimal scheduling of the urban energy system is proposed by Jin et al., 2016, in which the flexible and reconfigurable topology of power distribution networks is considered. The joint and unified optimization decision of coupled power systems and natural gas systems is analyzed in Martínez-Mares et al. (2011). Correa-Posada and Sánchez-Martín (2015) determine the dynamic optimal operation strategy of the electricity–gas integrated energy system, which includes a transient natural-gas flow model. An integrated electricity–gas system with steady-state energy flow models considering the uncertainty of wind power is proposed in Gao and Li (2020). Additionally, a new Benders decomposition-based algorithm is proposed, which improves the solution efficiency for non-convex models (Gao and Li, 2021). A new external dependency model based on the energy hub (EH) is introduced to consider the possible uncertainty in customer decision through stochastic model processing (Neyestani et al., 2015). The stochastic optimal model is investigated with the comprehensive consideration of renewable generation and carbon-capture-based power-to-gas technology (Li et al., 2018). However, we note that most existing works on coordination optimization of integrated energy systems do not consider the existence of new-type loads such as EVs and HVs. Moreover, in most existing studies, a common assumption is that the driving mode of EVs is known. Arrival rates and times as well as the number of charging requests are specified in advance in a deterministic or stochastic manner, which can be determined from data-driven methods or queuing theory or modeled with probabilistic models through Markov decision processes. This assumption is reasonable for set-level research, such as residential parking management or a single CS management. However, it may not be appropriate if the system-level interdependency is under investigation, which is proposed in this article.
1.3 Contribution of This Study
To fill the research gaps summarized above, our model makes the following contributions:
1) We propose a mixed-UE traffic flow model based on an urban transportation system and divide the overall vehicular flows into five categories: GV traffic flow, EV traffic flow, HV traffic flow, HV charging flow, and EV charging flow. Our model, hence, accurately simulates the distribution of EVs and HVs in the urban transportation network.
2) We develop a day-ahead optimal dispatch of an urban energy system considering the transportation-network operation model, which includes the electric–gas co-optimization and the impact of traffic flows. Our model positively contributes to multi-energy complement and low-carbon operation. Moreover, the optimal energy management of EHs reduces the peak-valley difference caused by increasing penetrations of new-type loads such as EVs and HVs.
The remainder of this article is organized as follows: Section 2 elaborates on the mathematical model of day-ahead operation for an urban energy system considering traffic flows. Section 3 presents the performance of the proposed optimization model. Finally, Section 4 presents the conclusions of the work.
2 Day-Ahead Operation of an Urban Energy System Considering Peak Load Shaving
This section first presents the day-ahead electricity–gas co-optimization for urban energy systems, which includes the operating constraint with regard to peak load shaving. Then, the joint optimal dispatch model considers the electricity charging load and hydrogen charging load on the traffic side. Finally, through the optimal control of ESS and energy management of EH, the peak shaving and valley filling of the urban system with high penetrations of wind power are realized. The multi-energy systems are shown in Figure 1. There are many nodes connected to EH in the urban distribution network. EH provides hydrogen for the hydrogen charging station on the traffic side through the internal P2H device, meets the heat load demand through the CHP unit, and provides power for the charging station on the traffic side simultaneously through the converter and CHP unit.
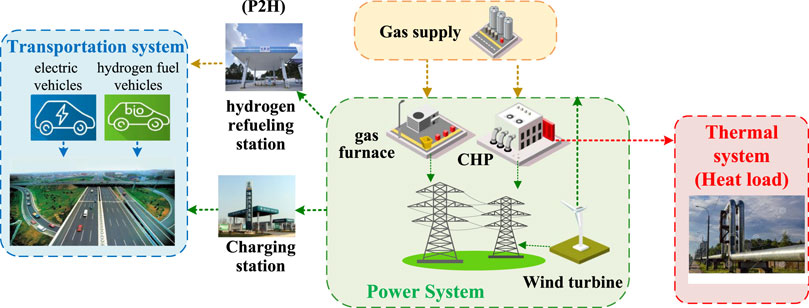
FIGURE 1. Schematic diagram of multi-energy systems.
Five key assumptions are made in our work:
1) We use a nonlinear day-ahead optimal dispatch model of an urban energy system that considers the transportation-network operation model.
2) We use fixed natural gas price information to coordinate the operation of electricity and natural gas systems. Unfixed gas pricing often leads to market inefficiencies.
3) We assume that the wind power output is deterministic, without considering the randomness of wind power output.
4) We use time-of-use price to calculate the cost of purchasing electricity in an urban energy system.
2.1 Branch Flow Model of the Urban Power Distribution Network
Since AC power flow constraints are non-convex, the day-ahead dispatch of the urban energy system is a non-convex optimization problem, which is difficult to solve. The second-order cone (SOC) relaxation based on the branch flow model is implemented to improve its computational tractability. Therefore, we use the branch flow model to replace the nonlinear power flow model of the urban distribution network (Baran and Wu, 1989):
Eqs 1, 2 replace the voltage and current quadratic terms in the original nonlinear power flow equation with new variables. The DistFlow model for radial electricity networks is formulated by 3–7, in which variables of the squared voltage magnitude and squared branch current are employed. Eqs 3–5 represent the active and reactive power flow balance. Eqs 6, 7 represent the injected active and reactive power of the node.
The operation of the urban AC distribution network should satisfy the following security constraints:
Constraint (8) limits the transmission power capacity of the root node. Constraint (9) represents the feeder capacity constraint. Then, curtailment constraints with respect to distributed generation are given in 10, 11. Constraint (12) limits the operating range of the squared voltage magnitude.
ESS operation constraints include charge and discharge state constraints, storage capacity constraints, charge and discharge power constraints, and daily allowable charge and discharge times constraints (Gabash and Li, 2012), which are provided as follows:
Constraint (13) denotes the charging and discharging states of ESS, and constraint (14) represents upper limit of charge and discharge. Eqs 15, 16 are energy constraints of ESS and daily allowable charge and discharge times constraints, respectively. Then, the quadratic equality (5) is further relaxed into the following SOC inequality (Taylor and Hover, 2012; Farivar and Low, 2013):
where
2.2 Model of the Energy Hub
The EH (Chen et al., 2019) depicted in Figure 1A represents the coupling between electricity and gas networks. CHP represents the key component of this EH, which generates electricity and heat simultaneously, and the urban distribution network provides the charging service for EVs through the EH. The energy conversion efficiency between the input and output energy flows of the EH is formulated in 18
Eq. 19 represents the dispatch factor of the EH input gas flow
Then, the EH also needs to satisfy the following operating constraints:
Constraint (20) gives the range of total gas purchases of EH. Constraints (20) and (21) represent the production capacity of CHP units and gas furnaces, respectively.
For a specific case, the nodes of the distribution network are connected to some components of EH, for example, only CHP units or gas furnaces, as shown in Figure 2. On the other hand, the power distribution network converts electric power into hydrogen through P2H devices to provide hydrogen supply services for hydrogen-fueled vehicles on the traffic side (Korpas and Holen, 2006; Pan et al., 2021). The structure of P2H is shown in Figure 3.
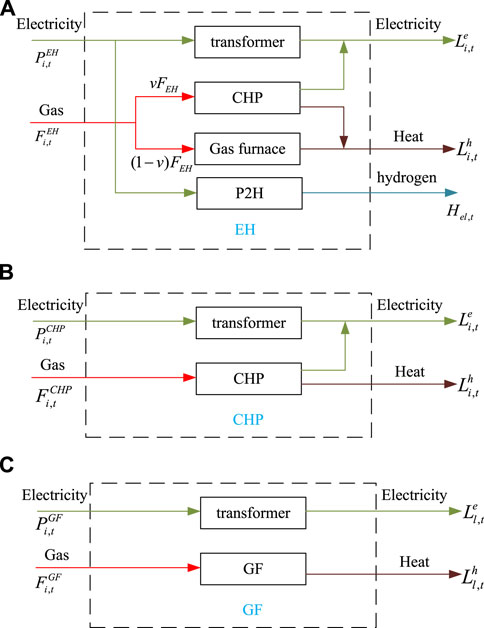
FIGURE 2. Components of the energy hub.
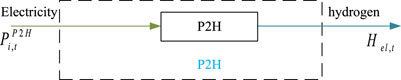
FIGURE 3. Structure of P2H.
The energy conversion efficiency between the input and output energy flows of P2H is given in 23 and 24
Constraint (23) calculates the energy conversion efficiency between the input and output energy flows of P2H. Constraint (24) limits the hydrogen production.
2.3 Transportation System Modeling
The user equilibrium (UE) model has been widely used to describe the urban transportation system in transportation research. In the case of the given traffic network and traffic demand, the UE model can output the current traffic state, namely, the traffic flow distribution on the road. The transportation system model in this article is based on the mixed-UE traffic flow model (Wei et al., 2018). We divide the overall vehicular flows into five categories: GV traffic flow, EV traffic flow, HV traffic flow, HV charging flow, and EV charging flow. The difference between traffic flow and charging flow lies in that the former represents the route choice of EVs and HVs, while the latter represents the charging choice of EVs and HVs. Traffic link has regular link, charging link, and bypass link. The charging links correspond to EV and HV queuing and charging events in EVCSs and HVCSs, and bypass links denote bypass events at EVCSs and HVCSs (Lv et al., 2021b; Teng et al., 2021).
The improved mixed-UE transportation model is a nonlinear complementary problem (NCP) consisting of four constraint sets
where constraint sets are presented as follows:
Cons − Flow:
Cons − Time:
Cons − Cost:
Cons − Cp:
Constraint set Cons − Flow describes flow conservation in the TN. Specifically, constraints (29)–(31) indicate that the traffic flow on each link is equal to the sum of the flows on all paths that pass through the link. Constraints (26)–(28) explain that the traffic flow on all paths connecting each O-D pair is equal to the corresponding traffic demand. Constraint set Cons − Time gives link travel time and estimation of different link types, respectively. For regular link
By changing the electricity price and hydrogen price for each period of time, we calculate the transportation network model 24 times. Then, we can get the load curve of each charging station and hydrogen charging station in a day according to Eqs 42, 43. In addition, the heat load
2.4 The Day-Ahead Optimization Dispatch Model of an Urban Energy System
With the goal of minimizing the sum of gas purchase cost and electricity purchase cost, we established a day-ahead optimization dispatch model of an urban energy system, and the optimization model is summarized below (Lu et al., 2020; Bakeer and Hossam, 2021; Cheng et al., 2021; Lu et al., 2020; Bakeer and Hossam, 2021; Cheng et al., 2021).
The objective function is provided as
The objective function (44) is subject to Day-ahead operation constraints:
Figure 4 shows the framework of the day-ahead optimization dispatch model of an urban energy system, which clarifies the interactions between power and transportation networks from the modeling perspective.
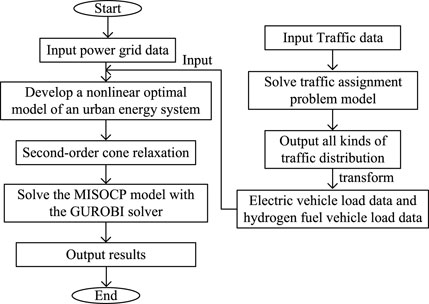
FIGURE 4. Framework of the optimization dispatch model.
3 Case Study
The urban energy system shown in Figure 5 is composed of a transportation network and a 33-node urban electricity network with five EHs located at nodes 6, 16, 18, 21, and 30 and two P2H units at nodes 8 and 10. CS1–CS8 are charging stations which correspond to nodes 6, 16, 12, 27, 18, 25, 21, and 30 in the power network, respectively. HFS1–HFS7 are hydrogen charging stations which correspond to nodes 6, 16, 21, 30, 18, 10, and 8 in the power network, respectively. In addition, two 0.4-MW capacity wind farms are connected at nodes 14 and 33, while two 1.8-MW capacity ESSs are connected at nodes 11 and 29, respectively. The computational tests were conducted on a laptop with Intel Core 1.0 GHz CPU and 16 GB memory, and the MISOCP model was programmed in GAMS and solved with the GUROBI solver.
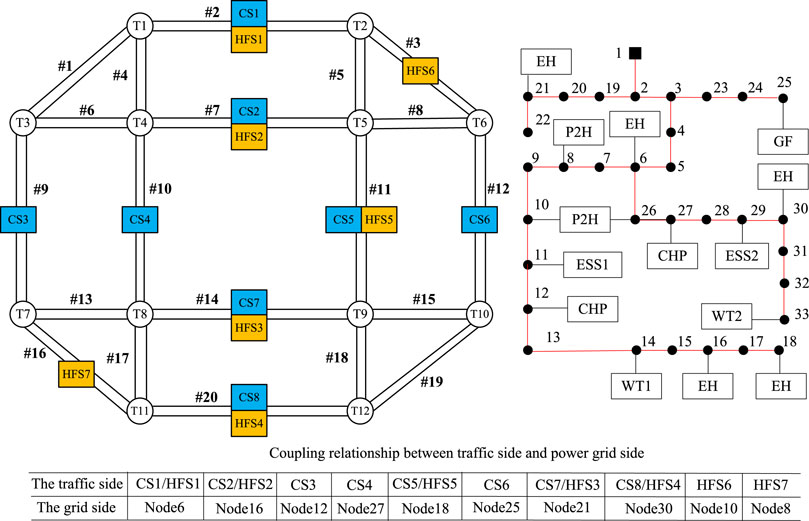
FIGURE 5. Topology of the urban energy system.
3.1 Electric Vehicle Charging Load and Hydrogen Load
Figure 6 shows the daily heat load, the charging load of EVs, and the hydrogen load of HVs on the traffic side. As can be observed from this figure, the charging load curve of EVs has the same trend with the hydrogen load curve of HVs, and both have the characteristic of double peaks. During the morning rush hour from 8:00 to 10:00 and the evening rush hour from 17:00 to 19:00, the electric load and hydrogen load on the traffic side are relatively high, while the heat load is higher during the day and lower at night (Ye et al., 2021). The trend of these three loads is consistent with that of the total load.
3.2 The Anti-Peak-Shaving Characteristic of Wind Power Production
Figure 7 shows the comparison of the wind power output curve, total original load curve, and total net load curve without considering energy storage. In this figure, load 0 represents the total original load curve, and load 1 represents the total net load curve without considering the energy storage. As can be observed from the figure, wind turbines produce more output at night, which results in a lower net load at the valley time. However, the output of wind turbines is less in the daytime, and hence, it cannot significantly reduce the peak load. Consequently, the daily wind power production results in a larger peak-to-valley difference of net load.
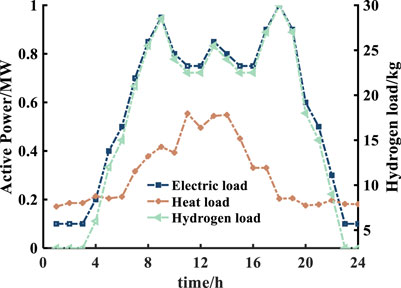
FIGURE 6. Hourly multi-energy load.
3.3 Coordination Between ESS and Wind Power Production
It is noteworthy that when the ESS participates in the power regulation of the power grid, the disadvantages brought by the anti-peak-shaving of wind power can be well compensated. As shown in Figure 8, load 3 represents the total net load considering energy storage and multi-energy regulation, and load 2 represents the total net load without considering multi-energy regulation. ESS charges at night when the power load is low and the wind power output is large and discharges during the day when the load is relatively high and the wind power output is small. As a result, peak cutting and valley filling of the power load are achieved.
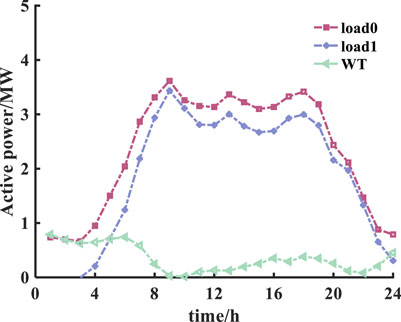
FIGURE 7. Anti-peak-shaving characteristic of wind power production.
3.4 Complementary Operation of Multi-Energy Coupling
Natural gas is simultaneously converted into heat and electricity through CHP units and only into heat through the gas furnace. Figure 9 shows the total purchase of natural gas at each time period, from which we can observe that the amount of gas purchase of gas is larger at the time period when the power load is high than that at the time period when the power load is low. As shown in Figure 8, the difference between curve load 2 and load 3 is mainly due to the multi-energy complement. In addition, the EV load is relatively high at time periods from 7:00 to 17:00. To summarize, increasing the power supply of CHP units can effectively reduce the peak load, but this impact on valley filling is not obvious.
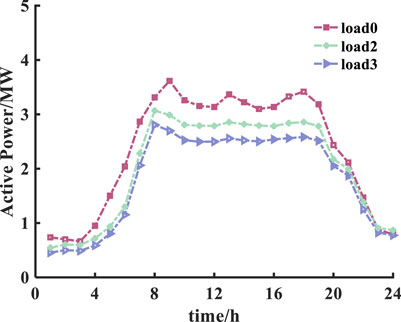
FIGURE 8. Hourly load curves under three scenarios.
3.5 Impact of ESS Strategies on Urban Energy System Operation
As discussed above, ESS can play an important role in power systems. Reasonable ESS scheduling decisions can alleviate the impact of wind power on the distribution network and promote peak shaving and valley filling. Figure 10 and Figure 11 show the charge–discharge curve of ESS and the SOC state of charge of ESS, respectively. We can note that for time periods from 0:00 to 7:00, the net load is relatively with low power consumption and high wind power production, and ESS charges to satisfy the load electricity demand. The SOC state of charge rises in preparation for the next stage of the discharge process. For time periods from 8:00 to 11:00, the electricity price is high and the net load is relatively high. ESS reduces the load peak by discharging. From 16:00 to 19:00, the load reaches the peak again, and ESS continues to discharge, which reduces the power purchase cost from the main grid. At the same time, in order to ensure the normal operation of the next charge and discharge cycle, the ESS charges and returns to the original state of charge at time periods from 20:00 to 24:00.
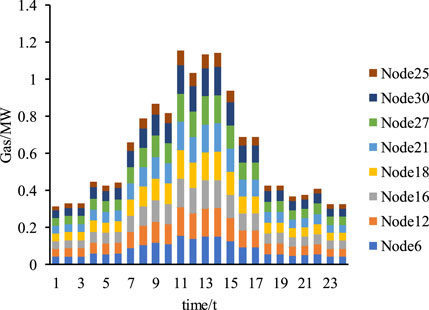
FIGURE 9. Hourly total purchase of natural gas.
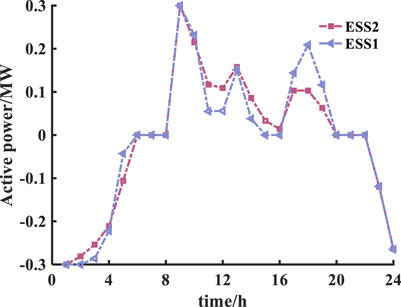
FIGURE 10. Hourly charge–discharge curve of ESS.

FIGURE 11. Hourly SOC state of charge of ESS.
We introduce an index δPa to measure the average peak-valley difference:
Table 1 lists mean peak-valley differences and the total operation costs under different ESS capacities. As shown in this table, the increase in ESS capacity positively reduces the average peak-valley difference of power demands and reduces the total operating costs. This is because a higher energy storage capacity can provide more sufficient charging power in load valley and discharging power in load peak, which also reduces the purchase of power at the peak time, thus reducing the operating cost.

TABLE 1. Average peak-valley difference under different ESS capacities.
3.6 Cost Comparison Under Different Values of Average Peak-Valley Difference
To control the load peak-valley difference to an ideal level, we add an additional linear constraint (46) into the original model. Meanwhile, we set the energy storage capacity to be fixed at the original value
λ denotes the load peak-valley difference which we want to get. By modifying the value of λ, we can obtain the corresponding operating costs under different requirements of average peak-valley difference, and the results are summarized in Table 2.

TABLE 2. Cost comparison under different constraint values of average peak-valley difference.
Generally, a more ideal peak-valley difference increases the total operating cost, which indicates that the operating cost and the requirement of peak shaving and valley filling are contradictory. The reason is that if we set the value of λ to be small, we need to increase the net load during the valley time. Therefore, part of the wind power will be curtailed during the load valley, and additional electricity needs to be purchased from the main grid, which reduces the peak-to-valley difference and inevitably increase the total operating cost.
4 Conclusion
We have presented a day-ahead co-optimization approach of unban energy systems considering traffic flows and peak shaving. Based on the numerical results obtained, we can draw the following conclusions:
• Optimal charging and discharging dispatch strategies of energy storages can alleviate the peak-valley difference caused by the anti-peak-shaving characteristic of wind power production.
• In addition, multi-energy complement can significantly reduce the peak-valley difference and contribute to the improved energy utilization efficiency. However, increasing the supply of natural gas can reduce the peak load, but the effect on valley filling is not obvious.
• When the ESS capacity is fixed, the higher the peak shaving and valley filling requirements, the greater the operating cost.
Our work, hence, might help the operators of urban energy systems to produce operating decisions of multi-energy production sources and satisfy the requirement from multi-energy demands. Our work might also help the design of a future low-carbon energy system. Meanwhile, in future research, we will consider the optimal dispatch model of the transportation system into the day-ahead dispatch model of the urban energy system to further improve social benefits. Reasonable traffic management strategies can give full play to the initiative of the urban distribution network to achieve peak shaving and valley filling and economic optimization.
Data Availability Statement
The original contributions presented in the study are included in the article/Supplementary Materials, further inquiries can be directed to the corresponding author.
Author Contributions
YP: methodology, software, validation, formal analysis, writing—original draft, and visualization. JM: methodology, investigation, and writing—review editing. CL conceptualization, methodology, and writing—review editing. SC conceptualization, resources, and supervision. LP methodology, validation, and writing—review editing.
Funding
This work was supported by State Grid Zhejiang Electric Power Company Project “Steady-state models and parameter identification technology of energy storage stations”.
Conflict of Interest
The authors declare that the research was conducted in the absence of any commercial or financial relationships that could be construed as a potential conflict of interest.
Publisher’s Note
All claims expressed in this article are solely those of the authors and do not necessarily represent those of their affiliated organizations or those of the publisher, the editors, and the reviewers. Any product that may be evaluated in this article or claim that may be made by its manufacturer is not guaranteed or endorsed by the publisher.
References
Bakeer, A., and Hossam, S. (2021). Salama and Istvan Vokony. Integration of PV System with SMES Based on Model Predictive Control for Utility Grid Reliability Improvement. Prot. Control. Mod. Power Syst. 6 (2), 191–203. doi:10.1186/s41601-021-00191-1
Baran, M. E., and Wu, F. F. (1989). Network Reconfiguration in Distribution Systems for Loss Reduction and Load Balancing. IEEE Trans. Power Deliv. 4 (2), 1401–1407. doi:10.1109/61.25627
Bureau of Public Roads (1964). Traffic Assignment Manual. Washington, D.C.: U.S. Department of Commerce.
Chen, S., Wei, Z., Sun, G., Cheung, K. W., Wang, D., and Zang, H. (2019). Adaptive Robust Day-Ahead Dispatch for Urban Energy Systems. IEEE Trans. Ind. Electron. 66 (2), 1379–1390. doi:10.1109/tie.2017.2787605
Chen, Y., Gribik, P., and Gardner, J. (2014). Incorporating Post Zonal Reserve Deployment Transmission Constraints into Energy and Ancillary Service Co-optimization. IEEE Trans. Power Syst. 29 (2), 537–549. doi:10.1109/tpwrs.2013.2284791
Cheng, Yan., Tang, Yi., and Dai, Jianfeng. (2021). Uncertainty Modeling of Wind Power Frequency Regulation Potential Considering Distributed Characteristics of Forecast Errors. Prot. Control. Mod. Power Syst. 6 (3), 276–288.
Correa-Posada, C. M., and Sánchez-Martín, P. (2015). Integrated Power and Natural Gas Model for Energy Adequacy in Short-Term Operation. IEEE Trans. Power Syst. 30 (6), 3347–3355. doi:10.1109/tpwrs.2014.2372013
Farivar, M., and Low, S. H. (2013). Branch Flow Model: Relaxations and Convexification-Part I. IEEE Trans. Power Syst. 28 (3), 2554–2564. doi:10.1109/tpwrs.2013.2255317
Gabash, A., and Li, P. (2012). Active-Reactive Optimal Power Flow in Distribution Networks with Embedded Generation and Battery Storage. IEEE Trans. Power Syst. 27 (4), 2026–2035. doi:10.1109/tpwrs.2012.2187315
Gao, H., and Li, Z. (2021). A Benders Decomposition Based Algorithm for Steady-State Dispatch Problem in an Integrated Electricity-Gas System. IEEE Trans. Power Syst. 36 (4), 3817–3820. doi:10.1109/tpwrs.2021.3067203
Gao, H., and Li, Z. (2020). “Effect of Power to Gas on Integrated Electricity-Gas System with Uncertain Wind Generation,” in IEEE 3rd Student Conference on Electrical Machines and Systems. SCEMS, 164–168. doi:10.1109/scems48876.2020.9352402
Hu, X., Moura, S. J., Murgovski, N., Egardt, B., and Cao, D. (2016). Integrated Optimization of Battery Sizing, Charging, and Power Management in Plug-In Hybrid Electric Vehicles. IEEE Trans. Contr. Syst. Technol. 24 (3), 1036–1043. doi:10.1109/tcst.2015.2476799
Jin, X., Mu, Y., Jia, H., Wu, J., Xu, X., and Yu, X. (2016). Optimal Day-Ahead Scheduling of Integrated Urban Energy Systems. Appl. Energ. 180, 1–13. doi:10.1016/j.apenergy.2016.07.071
Korpas, M., and Holen, A. T. (2006). Operation Planning of Hydrogen Storage Connected to Wind Power Operating in a Power Market. IEEE Trans. Energ. Convers. 21 (3), 742–749. doi:10.1109/tec.2006.878245
Li, Y., Zou, Y., Tan, Y., Cao, Y., Liu, X., Shahidehpour, M., et al. (2018). Optimal Stochastic Operation of Integrated Low-Carbon Electric Power, Natural Gas, and Heat Delivery System. IEEE Trans. Sustain. Energ. 9 (1), 273–283. doi:10.1109/tste.2017.2728098
Lu, S., Gu, W., Meng, K., Yao, S., Liu, B., and Dong, Z. Y. (2020). Thermal Inertial Aggregation Model for Integrated Energy Systems. IEEE Trans. Power Syst. 35 (3), 2374–2387. doi:10.1109/tpwrs.2019.2951719
Lv, S., Chen, S., Wei, Z., and Zhang, H. (2021). Power Transportation Coordination: toward a Hybrid Economic-Emission Dispatch Model. IEEE Trans. Power Syst. doi:10.1109/tpwrs.2021.3131306
Lv, S., Wei, Z., Chen, S., Sun, G., and Wang, D. (2021). Integrated Demand Response for Congestion Alleviation in Coupled Power and Transportation Networks. Appl. Energ. 283, 116206. doi:10.1016/j.apenergy.2020.116206
Mancarella, P. (2014). MES (Multi-energy Systems): An Overview of Concepts and Evaluation Models. Energy 65, 1–17. doi:10.1016/j.energy.2013.10.041
Martínez-Mares, A., Fuerte-Esquivel, C. R., and de Ingeniería, I. (2011). Integrated Energy Flow Analysis in Natural Gas and Electricity Coupled Systems. North American Power Symposium, 1–7.
Meng, W., and Wang, X. (2017). Distributed Energy Management in Smart Grid with Wind Power and Temporally Coupled Constraints. IEEE Trans. Ind. Electron. 64 (8), 6052–6062. doi:10.1109/tie.2017.2682001
Neyestani, N., Yazdani-Damavandi, M., Shafie-khah, M., Chicco, G., and Catalao, J. P. S. (2015). Stochastic Modeling of Multienergy Carriers Dependencies in Smart Local Networks with Distributed Energy Resources. IEEE Trans. Smart Grid 6 (4), 1748–1762. doi:10.1109/tsg.2015.2423552
Pan, G., Hu, Q., Gu, W., Ding, S., Qiu, H., and Lu, Y. (2021). Assessment of Plum Rain's Impact on Power System Emissions in Yangtze-Huaihe River basin of China. Nat. Commun. 12, 6156. doi:10.1038/s41467-021-26358-w
Rotering, N., and Ilic, M. (2011). Optimal Charge Control of Plug-In Hybrid Electric Vehicles in Deregulated Electricity Markets. IEEE Trans. Power Syst. 26 (3), 1021–1029. doi:10.1109/tpwrs.2010.2086083
Saber, A. Y., and Venayagamoorthy, G. K. (2011). Plug-in Vehicles and Renewable Energy Sources for Cost and Emission Reductions. IEEE Trans. Ind. Electron. 58 (4), 1229–1238. doi:10.1109/tie.2010.2047828
Shabanpour-Haghighi, A., and Seifi, A. R. (2015). Energy Flow Optimization in Multicarrier Systems. IEEE Trans. Ind. Inf. 11 (5), 1067–1077. doi:10.1109/tii.2015.2462316
Sheffi, Y. (1985). Urban Transportation Networks: Equilibrium Analysis with Mathematical Programming Methods. Englewood Cliffs, NJ, USA: Prentice-Hall.
Strasser, T., Andren, F., Kathan, J., Cecati, C., Buccella, C., Siano, P., et al. (2015). A Review of Architectures and Concepts for Intelligence in Future Electric Energy Systems. IEEE Trans. Ind. Electron. 62 (4), 2424–2438. doi:10.1109/tie.2014.2361486
Taylor, J. A., and Hover, F. S. (2012). Convex Models of Distribution System Reconfiguration. IEEE Trans. Power Syst. 27 (3), 1407–1413. doi:10.1109/tpwrs.2012.2184307
Teng, W., Wang, Y., and Sun, S. (2021). Robust Stability Control for Electric Vehicles Connected to DC Distribution Systems. Front. Energ. Res. 9. doi:10.3389/fenrg.2021.740698
Uddin, M., Romlie, M. F., Abdullah, M. F., Abd Halim, S., Abu Bakar, A. H., and Chia Kwang, T. (2018). A Review on Peak Load Shaving Strategies. Renew. Sustain. Energ. Rev. 82, 3323–3332. doi:10.1016/j.rser.2017.10.056
Wei, W., Wu, L., Wang, J., and Mei, S. (2018). Network Equilibrium of Coupled Transportation and Power Distribution Systems. IEEE Trans. Smart Grid 9 (6), 6764–6779. doi:10.1109/tsg.2017.2723016
Xu, D., Wu, Q., Zhou, B., Li, C., Bai, L., and Huang, S. (2020). Distributed Multi-Energy Operation of Coupled Electricity, Heating, and Natural Gas Networks. IEEE Trans. Sustain. Energ. 11 (4), 2457–2469. doi:10.1109/tste.2019.2961432
Yang, Q., and Fang, X. (2017). Demand Response under Real‐time Pricing for Domestic Households with Renewable DGs and Storage. IET Generation, Transm. Distribution 11 (8), 1910–1918. doi:10.1049/iet-gtd.2016.1066
Ye, J., Zhao, D., and Zhang, L. (2021). Research on Combined Electricity and Heating System Scheduling Method Considering Multi-Source Ring Heating Network. Front. Energ. Res. 9. doi:10.3389/fenrg.2021.800906
Zhao, G. Y., Liu, Z. Y., He, Y., Cao, H. J., and Guo, Y. B. (2017). Energy Consumption in Machining: Classification, Prediction, and Reduction Strategy. Energy 133, 142–157. doi:10.1016/j.energy.2017.05.110
Zhao, J., Ma, Y., Liu, Q., Wen, L., Jia, C., and Fang, Y. (2020). A Multi-Source Coordinated Optimal Operation Model Considering the Risk of Nuclear Power Peak Shaving and Wind Power Consumption. IEEE Access 8, 189702–189719. doi:10.1109/access.2020.3027705
Glossary
Indices and sets
i, j Subscript indices of nodes in electricity networks
t Subscript indices of time periods
min Superscript index of minimum value
max Superscript index of maximum value
Ωnode Set of electrical nodes
Ωline Set of branches
Ωsub Set of root nodes
ΩESS Set of (energy storage system) ESS nodes
ΩDGN Set of DG nodes
T Operational cycle.
TRS Set of origin–destination (O-D) pairs
TR Set of origin nodes
TS Set of destination nodes.
Variables
Ui,t Voltage of electrical nodes
Iij,t Current magnitude through branch ij
Pij,t, Qij,t Active and reactive power flow through branch ij
v Percentage of gas fed into combined heat and power
Hel,t Hydrogen production
Parameters
Rij,t The resistance of branch ij
Xij,t The reactance of branch ij
tan φ Power factor of DG output
α, β Charge and discharge efficiency coefficient of ESS
ηee Transformer efficiency of the energy hub
ηCHP,e Electrical efficiency of combined heat and power
ηCHP,h Thermal efficiency of combined heat and power
ηgh Gas furnace efficiency
ηe2hy Electrical efficiency of P2H
Hc The higher heating value of hydrogen
πg, πe, πh Ratio of GV/EV/HV traffic demand
pser,e, pser,h Average service rate at charging stations
Ee, Eh Charging demand of unit traffic flow.
qrs,t Trip rate (traffic demand) between O-D pair r-s
ω Monetary cost of travel time.
μe,t Time of use price
μg,t Unit price of natural gas
Npeak, Nvalley Number of peak and valley periods
Keywords: an urban energy system, peak shaving, traffic flows, multi-energy complement, low-carbon operation
Citation: Peng Y, Ma J, Lu C, Chen S and Pei L (2022) Day-Ahead Operation of an Urban Energy System Considering Traffic Flows and Peak Shaving. Front. Energy Res. 10:883598. doi: 10.3389/fenrg.2022.883598
Received: 25 February 2022; Accepted: 28 March 2022;
Published: 03 May 2022.
Edited by:
Qinran Hu, Southeast University, ChinaReviewed by:
Hossam A. Gabbar, Ontario Tech University, CanadaChuan He, Sichuan University, China
Shuai Lu, Southeast University, China
Copyright © 2022 Peng, Ma, Lu, Chen and Pei. This is an open-access article distributed under the terms of the Creative Commons Attribution License (CC BY). The use, distribution or reproduction in other forums is permitted, provided the original author(s) and the copyright owner(s) are credited and that the original publication in this journal is cited, in accordance with accepted academic practice. No use, distribution or reproduction is permitted which does not comply with these terms.
*Correspondence: Sheng Chen, Y2hlbnNoZW5naGh1QDE2My5jb20=