 Yali Liu
 Chao Zhang1,2
- 1Key Laboratory of Unconventional Oil and Gas Development China University of Petroleum (East China), Ministry of Education, Qingdao, China
- 2School of Petroleum Engineering, China University of Petroleum (East China), Qingdao, China
- 3PetroChina Tarim Oilfield Company, Korla, China
Investigation of methods to effectively block the high-permeability channel and displace the residual oil in the small pores in the old oilfields is an urgent research hotspot. The heat-resistant carbon dioxide (CO2) foam with high viscoelasticity and low interfacial tension, which is suitable for improving the oil recovery of old oilfields, and at the same time aids in carbon sequestration. In this study, a suitable heat-resistant foaming agent was selected by considering the temperature resistance, plugging, and profile control as the evaluation indicators, and the heat-resistant CO2 foam was prepared. Then, the two-dimensional (2D) plate model experiment was designed to verify the feasibility of the heat-resistant CO2 foam profile control process in order to solve the problems of small sweep range and uneven sweep degree in the reservoir. The results show that the selected foaming agent (RSB-IV) still maintained a foaming volume of 375 ml at 300°C, and the interfacial tension was only 0.008 mNm−1. The prepared heat-resistant CO2 foam exhibited the best profile control effect when the gas and liquid mixed injection, the gas-liquid ratio was 1:1, and the injection volume was 4.5–5.5 PV. In the 2D plate experiment, heat-resistant CO2 foam flooding promoted the recovery of the remaining oil in the matrix, and the oil recovery was increased to 61.01%. Furthermore, by designing the CO2 gas cap, it was verified that when the volume of the gas cap was large (above 1.5 PV), the injection of the CO2 gas cap could not only effectively improve the recovery rate, but also achieve effective CO2 capture.
Introduction
The development of most oilfields in China has recently entered a period of high-water saturation, with an overall water saturation as high as 85.5% and the oil recovery as low as 24.6% (Zhengxiao et al., 1013). Low single-well production, low porosity and permeability, strong heterogeneity, rapid production decline, low recovery rate, reduced express delivery, and difficulty in water injection are common problems encountered in low-permeability reservoirs that have been developed recently. Noteworthy, conventional primary and secondary oil recovery methods can generally recover only 1/3 of the crude oil in place (Wang et al., 2018). With the continuous growth of global energy demand due to industrial activities and advances, higher requirements have been forward for improving oil and gas development. Therefore, how to use tertiary oil recovery technology to increase the production in domestic old oilfields and maintain sustainable development is the scientific and technological research focus in the process of oilfield development.
Foam flooding is a tertiary oil recovery technology that uses foam fluid formed by gas-liquid mixture as injection fluid to control gas mobility, improve gas flooding effect, and increase oil recovery (Zhang et al., 2020a; Kang et al., 2021; Songyan et al., 2022a). After the foam is injected into the formation, it first enters the high-permeability channels with small flow resistance, and the subsequent injection of foam leads to the increase in the flow resistance in the formation. The foam enters the medium-and low-permeability channels with high flow resistance (Yu et al., 2014). At the same time, it also reduces the gas mobility, and the higher apparent viscosity of the foam enables it to have a high mobility control capability similar to polymer flooding. Moreover, the bubbles in the foam can also change their shape and enter the pores of various structures, and drive out the oil in the small pores through extrusion and cleaning, thereby improving the microscopic oil washing efficiency (Farzaneh and Sohrabi, 2015; Zhang et al., 2020b; Wang et al., 2020).
The gas phase in foam flooding is dominated by air, nitrogen (N2), flue gas, and carbon dioxide (CO2) (Guo and Aryana, 2016). Unfortunately, the greenhouse gases emitted into the atmosphere through human activities have been increasing year by year. CO2 is an important part of greenhouse gases that drives global climate change, and its content is as high as 65%. Global warming and other harsh environmental problems have attracted significant research attention at the international level. The application of CO2 foam in the process of oilfield development can not only reduce the environmental pollution, but also significantly improve the recovery of crude oil, and the production increase benefit is expected to be far greater than the injection cost (Aarra et al., 2014; Zhang et al., 2016; Davarpanah and Akbari, 2019; Pandey et al., 2021). Based on the chemical properties of CO2, when the CO2 foam breaks up in the formation, the precipitated CO2 leads to the expansion of the volume of oil, dissolution of gas, and reduction in velocity. Under appropriate conditions, CO2 can also gradually diffuse into the oil phase and form a miscible phase with the heavy oil in the reservoir, further enhancing the recovery (Songyan et al., 2022b). Therefore, CO2 foam flooding has received extensive attention, and CO2 foam flooding has also been developed into an important part of enhanced oil recovery (EOR) technology at the global scale. CO2 was injected into the Weyburn oilfield, Saskatchewan, Canada for 4 years, which led to the increase in the oilfield production by 1800 × 104 t, a 50% increase compared to previous years (Songyan et al., 2021).
Till date, significant research efforts have been devoted to the optimization of the application effect of CO2 foam flooding (Zhang et al., 2018; Shan et al., 2021; Sun et al., 2021; Zhang and Schechter, 2021). For instance, Liu et al. measured the stability of CO2 foam at high temperature and high pressure, and verified that with the increase of surfactant concentration, the oil–water interfacial tension decreased, and it became stable when the concentration was higher than the critical micelle concentration (Rezania et al., 2021). It shows that the concentration of surfactant seriously influences the stability of CO2 foam. Li et al. studied the plugging ability of CO2 foam in the low-permeability channel model (Songyan et al., 2022c). The experiments showed that foam could effectively reduce the mobility of gas and liquid in fractures, and the recovery was improved by about 20% based on water flooding or gas flooding.
Noteworthy, in conventional foaming agent selection, more attention has been paid to the stronger foaming ability, while ignoring its oil washing ability, which effects the performance improvement of old oilfield (Princen and Kiss, 1986; Dollet and Raufaste, 2014; Ji et al., 2014). At the same time, understanding of the mechanism of CO2 foam flooding to promote carbon capture is still insufficiently clear, which greatly limits the development of CO2-EOR technology.
Therefore, in this study, interfacial tension, foaming volume, and half-life were first used as the research parameters to screen the concentration and evaluate the stability of conventional heat-resistant foaming agents in oil fields. Then, the profile control and plugging capacity of the heat-resistant CO2 foam was determined by using the sandpack model. Based on the characteristics of the old oilfield with high water saturation, low permeability, and strong heterogeneity, the effectiveness of heat-resistant CO2 foam was verified from the two aspects, namely, EOR and promotion of carbon capture, which is the follow-up study of CO2 foam providing technical reference and basis.
Experimental
Apparatus
Screening and Evaluation of Heat-Resistant Foaming Agents
Figure 1 exhibits a visual foam performance test device used in this study. According to the experimental protocol, certain concentration of foaming agent solution was pre-configured, and the foam was prepared by the Waring Blender experimental method (Aleksandrov et al., 2018). The air tightness of the experimental equipment was first evaluated, and then the foam evaluation device (Model: Foam Evaluator, China MSC Group, pressure range <32 MPa and temperature range <300°C) was put into an oven thermostat (temperature range <300°C). Further, the stability of the foaming agent was determined by measuring the liquid elution half-life at a temperature of 100–300°C. Next, the oil washing efficiency of foam was calculated.
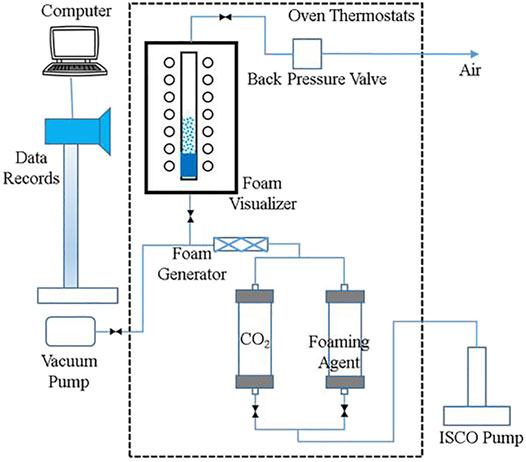
FIGURE 1. Schematic illustration of the apparatus used for foam evaluation.
Dual-Sandpacks Model Flooding Experiment
Two sandpacks with high and low permeability were, respectively, used to form a dual-sandpack model, which was used to evaluate the plugging capacity and profile control capacity of the prepared heat-resistant CO2 foam. The experimental apparatus is shown in Figure 2.
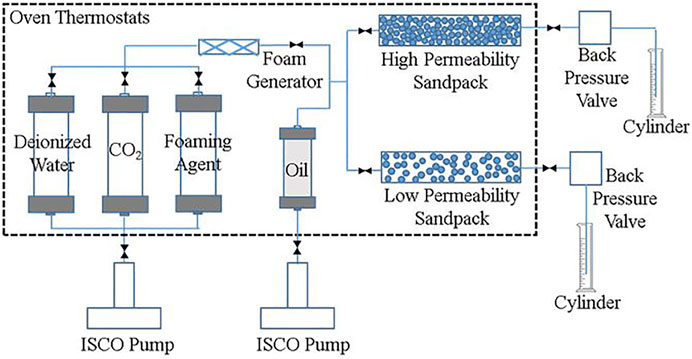
FIGURE 2. Schematic illustration of dual-sandpack experimental apparatus.
Sandpack is a stainless tube packed with silica powder with varying particle size distributions as a model for a reservoir. The length of the sandpack was 30.0 cm and its internal diameter was 2.5 cm. The apparatus shown in Figure 2 can be used to study the foam plugging performance of a single sandpack and the foam profile control performance of dual-sandpack, respectively. The ISCO pump (Model 100DX, Teledyne Technologies, United States) with flow accuracy <0.25 μL min−1 and pressure accuracy < ±0.5% was used herein. The pressure difference between the inlet and outlet of the sandpack was measured with a differential pressure sensor (model: 3210PD, China MSC Group, measuring range <50 MPa, accuracy <0.1%FS). The measuring range of the graduated cylinder was <50 ml, and the accuracy was <0.01 ml. The temperature was controlled using the oven thermostats to achieve the desired reservoir temperature.
Heat-Resistant CO2 Foam Flooding Test Using a Two-Dimensional Visualization Plate Model
In the experiment, the two-dimensional (2D) visualization plate model mainly composed of two tempered glass sheets and a metal frame was used. The length, width, and thickness of the tempered glass were 25, 25, and 2 cm, separately. First, two tempered glass sheets were put into metal frame and a ring was installed between them for sealing. A space of 25.0 cm × 25.0 cm × 0.6 cm was left between the two tempered glass for filling silica sand. Two mental frames with the same size cutting window were then bolted together to fix the glass, and a ring was also placed between them to prevent leakage. Some holes were present at the edge of metal frame to simulate oil well, which connected with the space between the two glasses. The apparatus used in visual oil displacement experiment is shown in Figure 3.
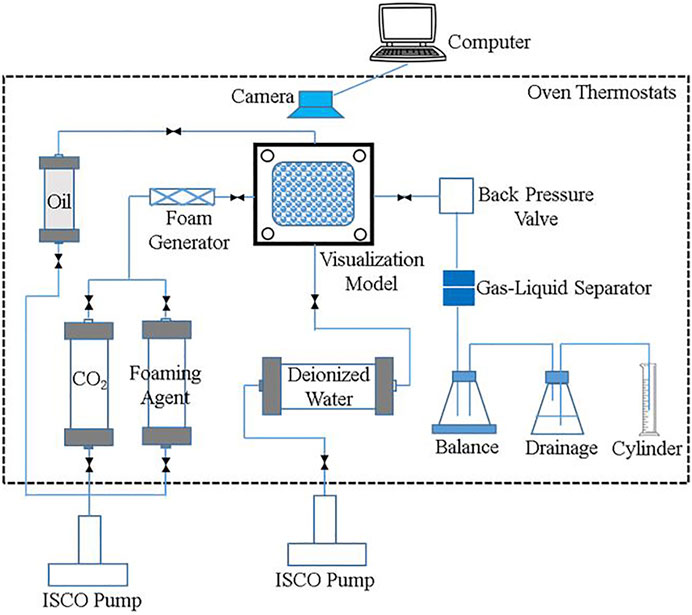
FIGURE 3. Schematic of the experimental setup for visual oil displacement experiment.
Silica sand containing particles with different diameters was used to pack the 2D visualization plate model to obtain the anticipated permeability and porosity. The crude oil, CO2, and surfactant were placed inside the container. The oil was delivered to the 2D visualization plate model at a constant volumetric flow rate using a piston pump (model 100DX, with flow accuracy <0.25 μL min−1 and pressure accuracy < ±0.5%). Complete the oil saturation process. Then a foam generator was connected to the model. Foam was generated by injecting the surfactant and CO2 simultaneously through the foam generator. The produced oil and gas were separated with the separator, and they were measured using a balance (accuracy <0.001 g) and cylinder (accuracy <10 ml), separately.
Materials
The crude oil, with a viscosity of 13,466 mPas and a density of 939.7 kgm−3 at 50°C was collected from Shengli Oilfield, China. In the sandpack experiment, the viscosity of oil was 76.6 mPas at 200°C, and in the two-dimensional visualization experiment, the viscosity of oil was 777.1 mPas at 90°C.
The foaming agent (DHF-1/B2/XJ-1/CNS/RSB-Ⅳ) was selected from several surfactants commonly used in oilfield for EOR. The concentration of foaming agent used in the experiment was 0.5 wt%. In order to simulate the strata salinity influence on foam performance, sodium chloride solution (NaCl, 17,435 mgL−1) and calcium chloride solution (CaCl2, 475 mgL−1) were used in the experiments. The CaCl2 fluid and NaCl fluid, both with purity of >99.5%, were provided by Sigma (United States). Deionized water was used in all the experiments. The CO2 used in this experiment was provided by Tianyuan Inc (China), with a purity of 99.9 wt%.
In the 2D visualization experiment, the simulated oil was prepared in proportion of 1:4 with the paraffin oil and the dehydrated crude oil. The size of silica sand that was used to simulate the matrix of 2D visualization plate model was 120 mesh, 100 mesh, and 70 mesh.
Experimental Procedure
Selection of Foaming Agents
(1) Evaluation of foaming ability and high temperature resistance
The commonly used foaming agents in oil fields (DHF-1/B2/XJ-1/CNS/RSB-IV) were selected, and foaming agent (0.5 wt%) solutions were prepared to measure the interfacial tension of different types of foaming agents. Then, the foaming agent was placed on a stirrer with a rotating rate of 1,000 rpmmin−1, stirred for 5 min, and filled with CO2 to obtain heat-resistant CO2 foam. The CO2 foam was placed in a foam evaluation device, and the initial foam volume was recorded as an indicator of foaming ability. Then the temperature of oven thermostats was set to increase from 100 to 300°C, and the time for which the volume of CO2 foam decreased to half the initial volume was recorded as the half-life, which is an indicator of foam stability. Each sample was tested three times, and the average of the measured values was taken as the final result.
(2) Evaluation of oil washing ability
The crude oil was mixed with 120 mesh sand at a mass ratio of 1:49 and aged for 120 h in the oven thermostats at 80°C. Then the aged mixture (3 g) was added to the foaming agent (0.5 wt%) and the contents were stirred to make them react fully for 48 h, during which the contents were shaken again every 6 h. Finally, the washed liquid was taken out and dried in the oven thermostats at 90°C for 24 h to obtain the amount of washed oil, and then the oil washing efficiency was calculated according to Eq. 1 as follows:
where
Plugging and Profile Control Ability of Heat-Resistant CO2 Foam
The dried 80 and 120 mesh sand were mixed uniformly in a ratio of 1:4, and filled into two sandpacks, respectively. The sandpack was monitored to find out whether the air tightness of the sandpack was qualified, and the sandpack was vacuumed after ensuring that the air tightness was qualified. Subsequently, the porosity and permeability of the sandpack were measured with saturated water. The high-permeability sandpack and the low-permeability sandpack were prepared, respectively. The final permeability gradient of the two sandpacks was 5.9. The physical parameters of dual-sandpacks are presented in Table 1.
(1) Plugging ability of heat-resistant CO2 foam

TABLE 1. The parameters for dual-sandpacks model.
The high-permeability sandpack was used to evaluate the plugging ability of heat-resistant CO2 foam. First, the oil was saturated into the high-permeability sandpack at a constant rate of 3 mlmin−1 at 90°C until no more water emerged from the sandpack outlet. Then, at the experiment temperature of 200°C, the 0–6 PV volume of heat-resistant CO2 foam was injected into the sandpack. Since the goal of foam application is profile control and water plugging, the difference in water flooding seepage resistance before and after foam injection is used to characterize the plugging effect of foam. After foam slug was injected, the pressure difference between the inlet and the outlet of the sandpack during the water flooding injection was recorded as P1. Then, the parameters such as gas-liquid ratio, foam injection amount, and oil content were changed, respectively, re-inject foam slug and water flooding, the pressure difference of water flooding process after changing parameters was recorded as P2. The resistance factor (RF) of foam was defined as P2/P1. By comparing the changes in the RF, the optimal foam injection scheme was designed to achieve the best plugging effect.
(2) Heat-resistant CO2 foam profile control ability
The prepared dual-sandpacks were recorded for porosity and saturated with oil. The water flooding experiment was carried out at 200°C and injection rate of 3.5 mlmin−1, and the produced liquid at the outlet of the dual-sandpacks was collected separately. The volume of produced liquid of the low-permeability sandpack was recorded as Q1, and that of the high-permeability sandpack was recorded as Q2. The liquid production ratio of the dual-sandpacks was recorded as Q2/Q1. After the water flooding, 0–6 PV volume of heat-resistant CO2 foam was injected into the dual-sandpacks, and the water flooding of 3 mlmin−1 was carried out via continuous injection after the CO2 foam slug injection. The produced fluid at the outlet of the dual-sandpacks was collected and recorded again as Q1’ and Q2’, respectively. By comparing the liquid production ratio of the dual-sandpacks before and after the addition of heat-resistant CO2 foam, the profile control ability of the foam was verified.
Visualized Two-Dimensional Plate Model for Oil Displacement and Carbon Capture Experiments
The experimental steps are as follows:
(1) The 2D visualization plate model was washed with distilled water and absolute ethanol to ensure the complete removal of dirt. The pipeline was installed to simulate the injection well in the upper and lower center of the model, and to simulate the production well on the right side of the model. It was ensured that the production well outlet was higher than the model to avoid oil flow. The model was sealed as a whole and exhibited good air tightness.
(2) The sand samples with different particle sizes were dried and mixed uniformly, and then filled into the model to simulate the reservoir with high-permeability channels. All the valves on the filled 2D plate model were closed and the model was placed vertically for 2 h.
(3) The experimental temperature was maintained at 90°C, and the model was filled with water from the bottom at a rate of 1.5 mlmin−1 until water reached the top of the model. The oil was then saturated at a rate of 3.0 mlmin−1 from the top until no water was produced at the bottom of the model, thus completing the oil saturation.
4) Visualization experiment of heat-resistant CO2 foam is briefly described as follows: CO2 (0.3 PV) was injected into the intermediate container to simulate the gas cap formed by capturing CO2 in the reservoir, the gas cap pressure was controlled at 1 MPa, and stabilized for 1 h. The simulated gas cap (intermediate container) was connected to the top of the 2D visualization plate model, then the production valve on the right side of the model was opened, and the back pressure was set to 0.5 MPa. At the inlet of the model, gas cap flooding and foam flooding were carried out until almost no heavy oil was produced. The production parameters such as gas cap pressure and oil production were recorded. The distribution of remaining oil in the 2D visualization plate model was observed.
Results and Discussion
Evaluation of Heat-Resistant Foaming Agent
The variation of foaming ability and change in half-life of foam with temperature are shown in Figure 4 and Figure 5, respectively.
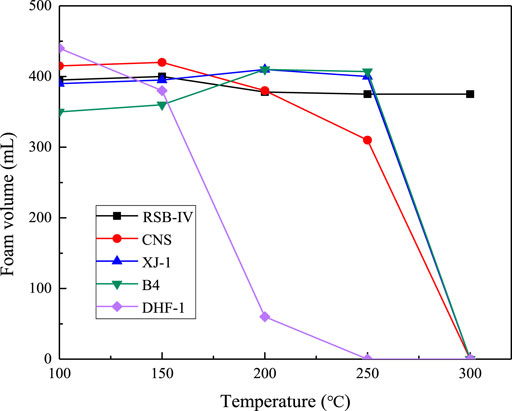
FIGURE 4. Variation of foaming volume with temperature (Concentration was 0.5 wt%).
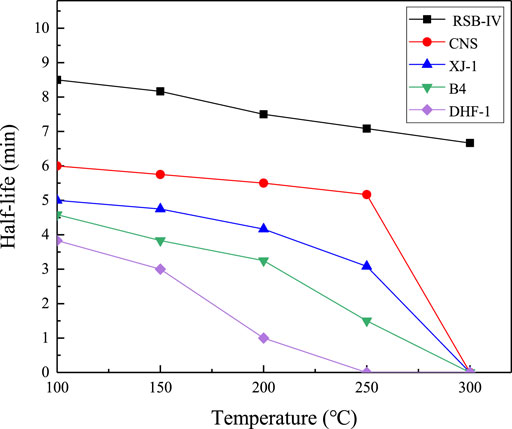
FIGURE 5. Variation of half-life with temperature (Concentration was 0.5 wt%).
Figure 4 demonstrates that the temperature exhibits a significant influence on the foaming ability. At 100°C, the foaming volume of the five foaming agents was up to 440 ml and the lowest was 350 ml. When the temperature was increased from 100 to 250°C, the foaming ability of DHF-1 foaming agent gradually disappeared. When the temperature continued to increase to 300°C, the foaming ability of CNS, XJ-1, and B4 foaming agents failed. At high temperature of 300°C, RSB-IV foaming agent still exhibited high foaming ability, and th foaming volume remained at 375 ml, which is only 6.25% lower than the initial foaming volume.
Figure 5 illustrates that the half-life of foam decreases with increasing temperature.
The initial half-life of RSB-Ⅳ foaming agent at 100°C was relatively high, i.e., 8.5 min. With the increase in the temperature to 300°C, the half-life of RSB-Ⅳ foaming agent remained at about 6.67 min, which proves that its temperature resistance is good.
According to several literature studies, stability of the foam can be significantly affected when it comes in contact with the remaining oil in the formation (Li et al., 2021; Chuaicham and Maneeintr, 2017; Hamouda and Tabrizy, 2013). Therefore, besides screening high foaming performance and half-life, low interfacial tension should also be used as the selection criterion to facilitate the stripping of the remaining oil to achieve higher recovery (Zhang et al., 2019). Furthermore, the surface tension of the five high-temperature resistant foaming agents was measured, and the oil-washing ability of the foam was calculated according to the method described in Equation 1. During the surface tension measurement, a pendant drop of the aqueous dispersion was formed at the end of a stainless steel needle first, then the nanoparticles and surfactant molecules would diffused to the surface layer. The droplet was produced by pushing the piston of a gas-tight syringe, so the energy was provided by the tensiometer (Ravera et al., 2006; Wang et al., 2008; Stocco et al., 2009; Xu et al., 2020). The corresponding results are presented in Table 2.
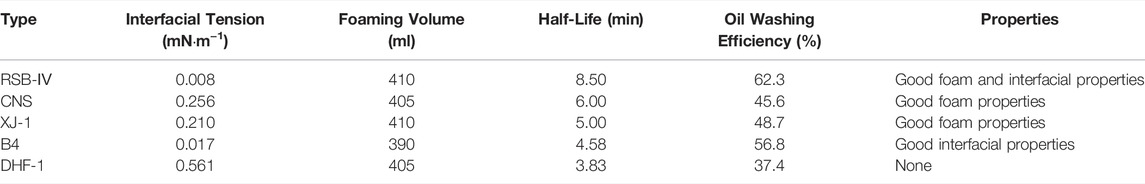
TABLE 2. Performance of high-temperature resistance foaming agent.
Based on the comparative analysis of the foaming ability and oil washing efficiency, the RSB-IV foaming agent was selected for the preparation of heat-resistant CO2 foam. It could still maintain a high foaming ability at a high temperature of 300°C, the interfacial tension was as low as 0.008 mNm−1, and the oil washing ability was 62.3%.
Heat-Resistant CO2 Foam Flooding in Dual-Sandpack Model
Plugging Ability of Heat-Resistant CO2 Foam in High-Permeability Sandpack
Owing to its high apparent viscosity, foam bursts in oil, stabilizes in water, and exhibits high impermeability in areas with high water saturation (Ahmed et al., 2021). Moreover, the larger surface tension allows the foam to block the higher-permeability channel and promote the displacement range in the low- and medium-permeability channel. According to the research, parameters such as gas-liquid ratio, foam injection volume, foam injection rate, and oil content are important factors that affect the RF of foam (Charlier et al., 1995). Therefore, the plugging experiment of heat-resistant CO2 foam in the high-permeability sandpack under the influencing factors was carried out, and the experimental results are presented in Figure 6 and Figure 7.
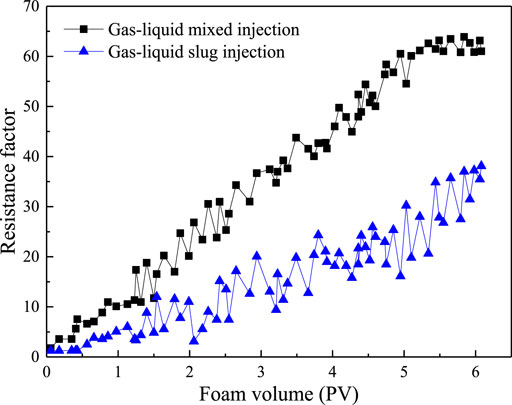
FIGURE 6. Variation of RF with foam injection amount under different injection methods (Temperature was 200°C, injection rate was 3.5 ml min−1, gas liquid ratio was 1:1).
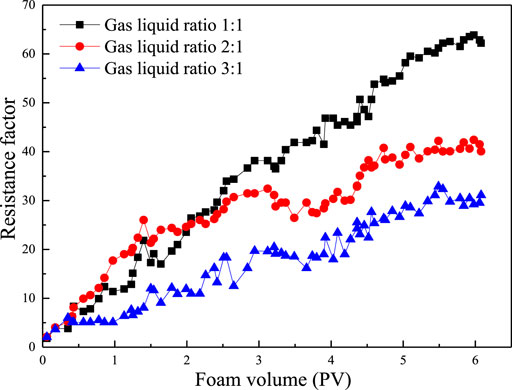
FIGURE 7. Influence of gas-liquid ratio on RF (Temperature was 200°C, injection rate was 3.5 ml min−1, gas-liquid mixed injection).
Figure 6 shows that the foam generated by the mixed gas-liquid injection exhibits higher resistance and better plugging effect. Moreover, with the increase of the foam injection volume, the RF gradually increased. However, when the foam injection volume was increased to 5.4 PV, the RF growth slowed down. With the increase in the injection rate, the RF of the foaming agent increases.
Figure 7 shows the growth of the RF under the influence of different gas-liquid ratios, revealing that when the gas-liquid injection ratio is 1:1, the plugging effect of the foam is the best.
Therefore, it is recommended to adopt the injection method with the high volume of foaming agent, the gas-liquid injection ratio was 1:1, and gas-liquid mixed injection in the oil development. After adding heat-resistant CO2 foam, the oil recovery in the high-permeability sandpack was obtained as shown in Figure 8.
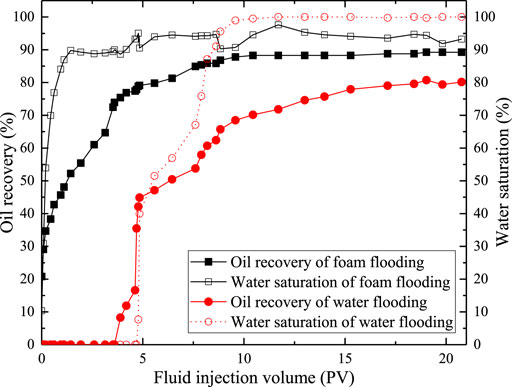
FIGURE 8. Oil displacement in high-permeability sandpack (Temperature was 200°C, gas-liquid ratio was 1:1, gas-liquid mixed injection).
Notably, the added heat-resistant CO2 foam improves the oil recovery of the high-permeability sandpack through the foam plugging ability. When only water flooding occurs, the oil recovery is only 80.15%, and the water saturation increases rapidly. In contrast, when heat-resistant CO2 foam is added, the start-up pressure of heavy oil is reduced, the recovery is increased to 89.26%, and the water saturation is reduced by 6.78%. The comprehensive experimental results show that the heat-resistant CO2 foam exhibits good plugging performance. The optimal RF is as high as 63.48, and the effect of improving oil recovery of the high-permeability sandpack is obvious.
The Profile Control Ability of Heat-Resistant CO2 Foam in Dual-Sandpacks
The profile control ability of foam is reflected in the following way: When both the high-permeability channels and low-permeability channels are present at the same time, the foam preferentially enters the high-permeability channels, increases the flow resistance of the high-permeability channels, and promote the subsequent injection of fluid into the low-permeability channels (Lopes et al., 2021). Consequently, the sweep degree between the high-permeability and low-permeability channels gets balanced. The results of the high-resistant CO2 foam balancing the fluid flow rate between the high-permeability sandpack (3,975 mD) and the low-permeability sandpack (673 mD) according to the dual sandpack model are presented in Figure 9.
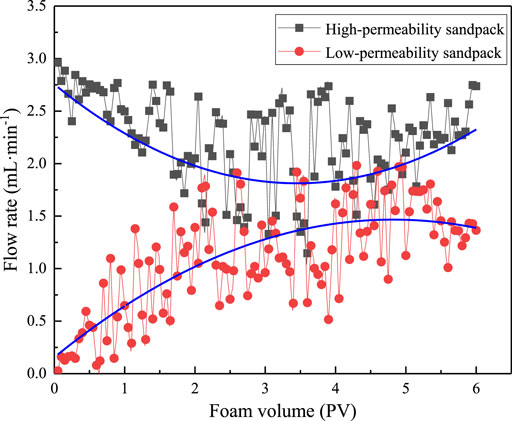
FIGURE 9. Heat-resistant CO2 foam profile control ability. (Temperature was 90°C, back pressure was 0.5MPa, foam injection rate was 5 mlL ·min−-1).
Figure 9 illustrates that the permeability gradient of two sandpacks was 5.9. In the range of 0–6 PV foam injection volume, the liquid production rate of high-permeability sandpack is always greater than that of low-permeability sandpack. However, under the action of heat-resistant CO2 foam, the liquid production rate difference gradually shrinks between two sandpacks. At this time, the fluid flow rate of high-permeability sandpack is 1.81 mlmin−1, and that of low-permeability sandpack is 1.47 mlmin−1.
Figure 10 presents the comparative analysis of the ratio of the produced fluid of the sandpack to the total produced fluid after adding the heat-resistant CO2 foam with different injection volume in the range of 0–6 PV.
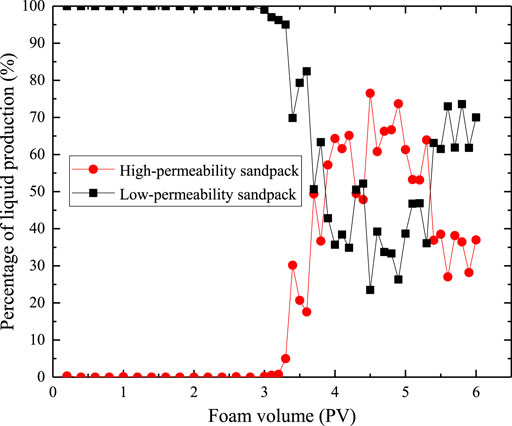
FIGURE 10. Comparison of the ratio of liquid production of high-permeability/low-permeability sandpack to total liquid production.
Figure 10 demonstrates that at the beginning of the oil displacement, the high-permeability sandpack was the first to produce fluid, while the low-permeability sandpack produced almost no fluid. With the increase of the amount of foam injected, the foam gradually blocked the high-permeability channel, which led to the adjustment of the permeability profile of the two sandpacks. This resulted in the gradual increase in the liquid production of the low-permeability sandpack, and the liquid production difference gradually decreased between the two sandpacks. When the amount of foam injected reached 4.5–5.5 PV, the profile control effect of foam was found to be the best, and the difference of liquid production value of the two sandpacks was reduced to 22.64%. The experimental results show that heat-resistant CO2 foam has good profile control ability.
Oil Displacement and CO2 Capture Experiments via Two-Dimensional Visualization Plate Model
Visualization Experiment of Oil Displacement
The oil displacement effect of heat-resistant CO2 foam injection was studied through the 2D visualization plate model. First, the CO2 gas cap drive was adopted. When serious gas channeling occurred, the injection of heat-resistant CO2 foam started plugging the channels.
Figure 11 shows that the oil recovery in the 2D visualization model is only 37.16% when the oil is displaced only by the gas cap drive. Subsequent injection of heat-resistant CO2 foam and continued production lead to the increase in the oil recovery to 61.01%.
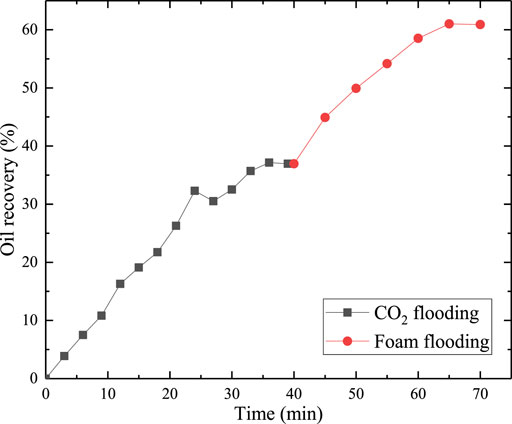
FIGURE 11. Recovery of gas cap drive and foam flooding (Temperature was 90°C, CO2 flooding injection rate was 3 ml min−1, foam injection rate was 5 ml min−1).
Figure 12 shows the variation of the remaining oil distribution with the development time. Panels (A-D) show the distribution of the remaining oil when the production time was 20 min, 40 min, 60 min, and 80 min, respectively. The black area is the remaining oil distribution area, the white area indicates the foam flooding area, and the red frame shows the as-formed high-permeability channels.
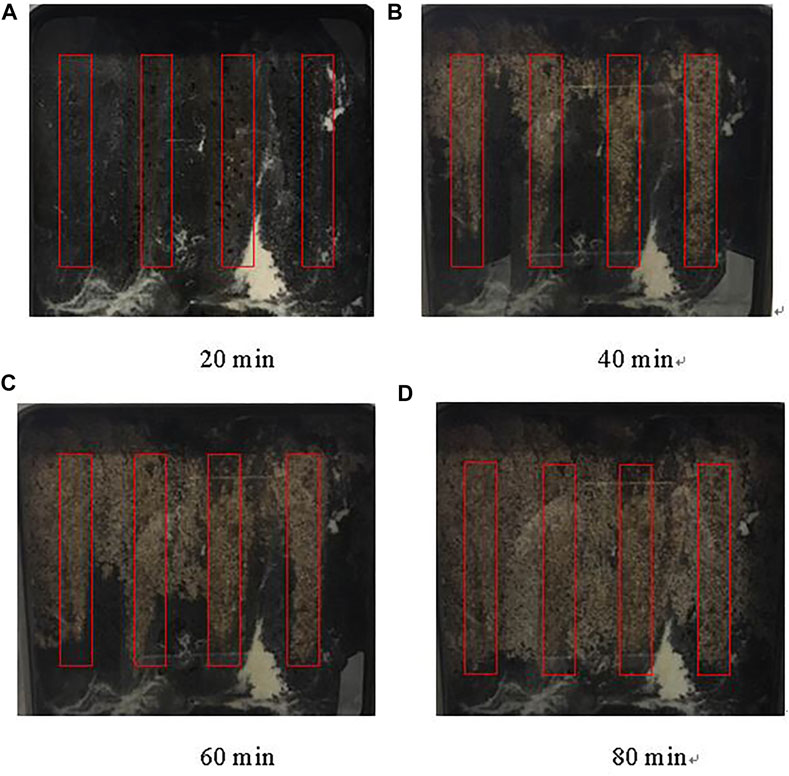
FIGURE 12. Remaining oil distribution as a function of development time.
Figure 12 exhibits that when CO2 is injected from the gas cap, gas channeling occurs in about 20 min of production. The gas first flows through the high-permeability channel to displace the oil in the channel, and the speed of oil displacement in the four channels basically remains consistent. When the production time reaches 40 min, the gas channeling becomes very serious. At this time, there is still a large amount of remaining oil in the matrix. Thus, heat-resistant CO2 foam is injected, which preferentially increases the flow resistance in the simulated fracture and inhibits gas channeling; as a result, more CO2 enters the low-permeability area and improves the sweep area. At the same time, after the foam bursts, the released gas enters the top of the model under the action of gravity differentiation. Moreover, the accumulated gas forms a secondary gas cap, which continues to displace the remaining oil and increases the sweep coefficient. The surfactant in the foam system can lead to significant reduction in the oil-water interfacial tension, so that the oil washing efficiency gets improved. Eventually, the remaining oil at the bottom of model stays near the production well location. When the production time is 80 min, most of the remaining oil in the matrix is produced, and the oil displacement process completed.
Simulation of the Carbon Capture via Gas Cap
The intermediate container is filled with certain amount of CO2 and connected to the 2D visualization plate model to simulate the process of injecting CO2 as a gas cap to assist heavy oil recovery, which is also an important way to realize carbon capture (Karzina et al., 2019). The results of the oil recovery affected by gas cap volume are shown in Figure 13.
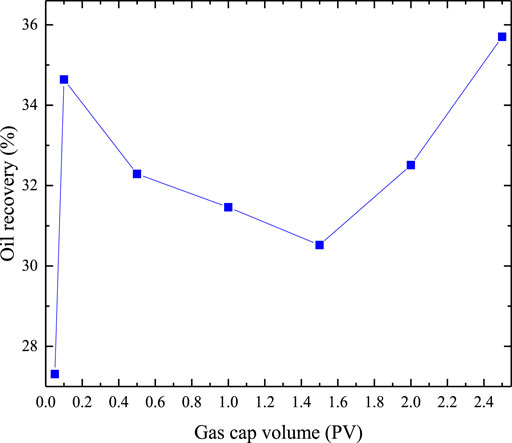
FIGURE 13. Effect of gas cap on recovery factor.
Figure 13 shows that when the gas cap volume is small, the CO2 in the gas cap remains relatively stable, and the recovery rate is low. With the increase in the gas cap volume from 0.05 to 0.1 PV, the CO2 volume participating in the driving of heavy oil increases. The increase in gas volume makes gas channeling more likely to occur, thus forming high-permeability channels, providing oil flow channels, and increasing oil recovery. With the continuous increase in the gas cap volume to 1.5 PV, the high-permeability channel gets completely broken through, CO2 is discharged through the channel, serious gas channeling occurs, and it hardly participates in oil displacement, resulting in a substantial decrease in oil recovery. The gas cap volume is further increased to 2.5 PV. With the increase of gas flow rate, the pressure difference between the inlet and the outlet of the 2D visualization plate model increases, providing a larger driving pressure difference, thereby increasing the oil recovery. Therefore, with the increase of the gas cap volume, the recovery factor shows a trend of first increasing, then decreasing, and then increasing, which proves that the oil recovery can be enhanced by capturing CO2 to form a gas cap.
Conclusion
(1) The heat-resistant foaming agent RSB-IV was selected from the foaming agents commonly used in oil fields. The foaming volume remains at 375 ml at 300°C, with a half-life of about 6.67 min. It exhibits a low interfacial tension of only 0.008 mNm−1, the oil washing efficiency is as high as 62.3%, and the foam performance and interface performance are both good, which make it a suitable candidate for the subsequent preparation of heat-resistant CO2 foam.
(2) According to the dual-sandpack flooding experiment, it is recommended to adopt the injection method with high injection rate, high volume of foaming agent, and gas-liquid mixed injection in the oil displacement process. In the high-permeability sandpack, the oil recovery of heat-resistant CO2 foam is increased by 9.11% compared with that of water flooding. In the oil flooding experiment with dual-sandpack, the permeability gradient between the two sandpacks is 5.9, and the profile control ability is the best when the injection volume of foam is 4.5–5.5 PV.
(3) In the 2D visualization plate model flooding experiment, the oil recovery of heat-resistant CO2 foam increases to 61.01%. According to the observed distribution of the remaining oil, after CO2 injection from the gas cap, gas channeling occurs in about 20 min of production, and the gas displaces the oil in the high-permeability channel. When the production reaches 40 min, the gas channeling becomes very serious, and there is still a lot of remaining oil in the matrix. At this point, heat-resistant CO2 foam is injected, which increases the sweep coefficient and improves the oil washing efficiency. Finally, when the production time is 80 min, most of the remaining oil in the matrix is produced, and the oil displacement process ends.
(4) Simulation results of CO2 gas cap drive when the gas cap volume increases from 0 to 2.5 PV, indicate that the oil recovery shows a trend of first increasing, then decreasing, and then increasing. When the gas cap volume is large (above 1.5 PV), with the increase of gas flow, the pressure difference between the inlet and the outlet of the 2D visualization plate model increases, providing a large driving pressure difference, which enhances the oil recovery. Therefore, this study proves that the method of injecting CO2 gas cap can not only effectively improve the oil recovery, but also realize the effective carbon capture.
Data Availability Statement
The original contributions presented in the study are included in the article/Supplementary Material, further inquiries can be directed to the corresponding author.
Author Contributions
YL: Write manuscripts and participate in experiment; CZ: Theoretical guidance; QW: Participate in the experiment; ZL: Theoretical guidance; MS Contribution is article revise.
Funding
The authors appreciate the financial support of the National Nature Science Foundation of China (Grant No. U20B6003) and the Natural Science Foundation of Shandong Province, China (ZR2020QE106).
Conflict of Interest
Author MS was employed by PetroChina Oilfield Company.
The remaining authors declare that the research was conducted in theabsence of any commercial or financial relationships that could be construed as apotential conflict of interest.
Publisher’s Note
All claims expressed in this article are solely those of the authors and do not necessarily represent those of their affiliated organizations or those of the publisher, the editors, and the reviewers. Any product that may be evaluated in this article, or claim that may be made by its manufacturer, is not guaranteed or endorsed by the publisher.
References
Aarra, M. G., Skauge, A., and Solbakken, J. (2014). Properties of N2-And CO2-foams as a Function of Pressure[J]. J. Pet. Sci. Eng. 116, 72–80. doi:10.1016/j.petrol.2014.02.017
Ahmed, S., Alameri, W., and Ahmed, W. W. (2021). Rheological Behavior of scCO2-Foam for Improved Hydrocarbon Recovery: Experimental and Deep Learning Approach[J]. J. Pet. Sci. Eng. 203 (2), 108646. doi:10.1016/j.petrol.2021.108646
Aleksandrov, V., Kadyrov, M., and Markov, A. (2018). Selecting a Technology to Increase Well Capacity and Enhance Oil Recovery of the YUS11 Formation of the Fainsk Oil Field[J]. Key Eng. Mater. 785, 146–152. doi:10.4028/www.scientific.net/kem.785.146
Charlier, Y., Hedrick, J. L., and Russell, T. P. (1995). High Temperature Polymer Nanofoams Based on Amorphous, High Tg Polyimides[J]. Polymer 36 (5), 987–1002. doi:10.1016/0032-3861(95)93599-h
Chuaicham, C., and Maneeintr, K. (2017). Interfacial Tension Measurement of Light Oil from Thailand to Enhance Oil Recovery for Surfactant Flooding Application[J]. Mater. Sci. Forum 890, 235–238. doi:10.4028/www.scientific.net/msf.890.235
Davarpanah, A., and Akbari, E. (2019). Simultaneous Feasible Infectivity of Foam and Hydrolyzed Polyacrylamide to Optimize the Oil Recovery Enhancement[J]. Energy Exploration & Exploitation 37 (1), 44–59. doi:10.1177/0144598718786022
Dollet, B., and Raufaste, C. (2014). Rheology of Aqueous Foams[J]. Comptes rendus- Physique 15 (8-9), 731–747. doi:10.1016/j.crhy.2014.09.008
Farzaneh, S. A., and Sohrabi, M. (2015). Experimental Investigation of CO2-foam Stability Improvement by Alkaline in the Presence of Crude Oil[J]. Chem. Eng. Res. Des. 94, 375–389. doi:10.1016/j.cherd.2014.08.011
Gudi, E. J., Pereira, J., and Costa, R. (2013). Biosurfactant-producing and Oil- Degrading Bacillus Subtilis Strains Enhance Oil Recovery in Laboratory Sand-Pack Columns[J]. J. Hazard. Mater. 261 (15), 106–113. doi:10.1016/j.jhazmat.2013.06.071
Guo, F., and Aryana, S. (2016). An Experimental Investigation of Nanoparticle-Stabilized CO2 Foam Used in Enhanced Oil Recovery[J]. Fuel 186 (dec.15), 430–442. doi:10.1016/j.fuel.2016.08.058
Hamouda, A. A., and Tabrizy, V. A. (2013). The Effect of Light Gas on Miscible CO2 Flooding to Enhance Oil Recovery from sandstone and Chalk Reservoirs[J]. J. Pet. Sci. Eng. 108, 259–266. doi:10.1016/j.petrol.2013.04.013
Ji, H., Sellan, D. P., and Pettes, M. T. (2014). Enhanced thermal Conductivity of Phase Change Materials with Ultrathin-Graphite Foams for thermal Energy Storage[J]. Energ. Environ. Sci. 7 (3), 1185–1192. doi:10.1039/c3ee42573h
Kang, Y., Songyan, L., and Kaiqiang, Z. (2021). Synergy of Hydrophilic Nanoparticle and Nonionic Surfactant on Stabilization of Carbon Dioxide-In-Brine Foams at Elevated Temperatures and Extreme Salinities[J]. Fuel 288, 119624. doi:10.1016/j.fuel.2020.119624
Karzina, J. S., Zamozdra, M. Y., and Hootak, M. (2019). Research of the Possibility of Obtaining a Foam System of Aluminum-Carbon Nanotubes Using a High- Temperature Foam Agent[J]. Key Eng. Mater. 822, 239–243. doi:10.4028/www.scientific.net/kem.822.239
Li, S., Wu, P., and Zhang, K. (2021). Complex Foam Flow in Series and Parallel through Multiscale Porous media: Physical Model Interpretation[J]. Int. J. Heat Mass Transfer 164, 120628. doi:10.1016/j.ijheatmasstransfer.2020.120628
Lopes, L. F., Faanha, J., and Maqueira, L. (2021). Coarsening Reduction Strategies to Stabilize CO2-foam Formed with a Zwitterionic Surfactant in Porous Media[J]. J. Pet. Sci. Eng., 109141. doi:10.1016/j.petrol.2021.109141
Pandey, A., Sinha, A., and Chaturvedi, K. R. (2021). Experimental Investigation on Effect of Reservoir Conditions on Stability and Rheology of Carbon Dioxide Foams of Nonionic Surfactant and Polymer: Implications of Carbon Geo-Storage. J. Energ., 235. doi:10.1016/j.energy.2021.121445
Princen, H. M., and Kiss, A. D. (1986). Rheology of Foams and Highly Concentrated Emulsions[J]. J. Colloid Interf. Sci. 112 (2), 427–437. doi:10.1016/0021-9797(86)90111-6
Ravera, F., Santini, E., and Loglio, G. (2006). Effect of Nanoparticles on the Interfacial Properties of Liquid/liquid and Liquid/air Surface Layers[J]. J. Phys. Chem. B 110 (39), 19543–19551. doi:10.1021/jp0636468
Rezania, S., Korrani, Z. S., and Gabris, M. A. (2021). Lanthanum Phosphate Foam as Novel Heterogeneous Nanocatalyst for Biodiesel Production from Waste Cooking oil[J]. Renewable Energy 176, 228–236. doi:10.1016/j.renene.2021.05.060
Shan, W., Du, J., and Yang, K. (2021). Superhydrophobic and Superoleophilic Polystyrene/carbon Nanotubes Foam for Oil/water Separation[J]. J. Environ. Chem. Eng., 106038. doi:10.1016/j.jece.2021.106038
Songyan, L., Lin, W., Lina, S., Zhaomin, L., and Kaiqiang, Z. (2022b). Carbon Dioxide Diffusions in Methane-Dissolved Pore Fluids: Implications for Geological Carbon Storage and Utilization in Tight Formations[J]. Chem. Eng. J. 429, 132147. doi:10.1016/j.energy.2021.121882
Songyan, L., Lu, S., Lei, W., and Zhaomin, L. (2022a). Hybrid CO2-N2 Huff-N-Puff Strategy in Unlocking Tight Oil Reservoirs[J]. Fuel 309, 122198. doi:10.1016/j.fuel.2021.122198
Songyan, L., Rui, H., Peng, W., and Zijian, C. (2022c). Experimental Investigation of Innovative Superheated Vapor Extraction Technique in Heavy Oil Reservoirs: a Two-Dimensional Visual Analysis[J]. Energy 238, 121882. doi:10.1016/j.cej.2021.132147
Songyan, L., Zhiheng, H., and Chen, L. (2021). Microscopic Visualization of Greenhouse- Gases Induced Foamy Emulsions in Recovering Unconventional Petroleum Fluids with Viscosity Additives[J]. Chem. Eng. J. 411, 128411.
Stocco, A., Drenckhan, W., and Rio, E. (2009). Particle-stabilised Foams: an Interfacial Study[J]. Soft Matter 5 (11), 2215–2222. doi:10.1039/b901180c
Sun, J., Guo, L., and Jing, J. A Comparison of Numerical Simulations with Experimental and Theoretical Investigations of Highly-Viscous Oil-Aqueous Foam Horizontal Flow[J]. J. Pet. Sci. Eng. 2021 (4), 108507. doi:10.1016/j.petrol.2021.108507
Wang, H., Lun, Z., and Lv, C. (2020). Nuclear-magnetic-resonance Study on Oil Mobilization in Shale Exposed to CO2[J]. SPE J. 25 (01), 432–439. doi:10.2118/190185-pa
Wang, H., Lun, Z., and Lv, C. (2018). Nuclear-magnetic-resonance Study on Mechanisms of Oil Mobilization in Tight sandstone Reservoir Exposed to Carbon Dioxide[J]. Spe J. 23 (03), 750–761. doi:10.2118/179554-pa
Wang, H. R., Gong, Y., and Lu, W. C. (2008). Influence of Nano-SiO2 on Dilational Viscoelasticity of Liquid/air Interface of Cetyltrimethyl Ammonium Bromide[J]. Appl. Surf. Sci. 254 (11), 3380–3384. doi:10.1016/j.apsusc.2007.11.020
Xu, Z. X., Li, S. Y., and Li, B. F. (2020). A Review of Development Methods and EOR Technologies for Carbonate Reservoirs[J]. Pet. Sci. 17, 990–1013. doi:10.1007/s12182-020-00467-5
Yu, J., Khalil, M., and Ning, L. (2014). Effect of Particle Hydrophobicity on CO2 Foam Generation and Foam Flow Behavior in Porous Media[J]. Fuel 126, 104–108. doi:10.1016/j.fuel.2014.02.053
Zhang, C., Li, Z., and Li, S. (2018). Enhancing Sodium Bis (2-ethylhexyl) Sulfosuccinate Injectivity for CO2 Foam Formation in Low-Permeability Cores: Dissolving in CO2 with Ethanol[J]. Energy & Fuels 32 (5), 5846–5856. doi:10.1021/acs.energyfuels.8b00741
Zhang, C., Li, Z., and Sun, Q. (2016). CO2 Foam Properties and the Stabilizing Mechanism of Sodium Bis (2-ethylhexyl) Sulfosuccinate and Hydrophobic Nanoparticle Mixtures[J]. Soft matter 12 (3), 946–956. doi:10.1039/c5sm01408e
Zhang, C., Wu, P., and Li, Z. (2020). Ethanol Enhanced Anionic Surfactant Solubility in CO2 and CO2 Foam Stability: MD Simulation and Experimental Investigations[J]. Fuel 267, 117162. doi:10.1016/j.fuel.2020.117162
Zhang, C., Xi, L., and Wu, P. (2020). A Novel System for Reducing CO2-crude Oil Minimum Miscibility Pressure with CO2-soluble Surfactants[J]. Fuel 281, 118690. doi:10.1016/j.fuel.2020.118690
Zhang, F., and Schechter, D. S. (2021). Gas and Foam Injection with CO2 and Enriched NGL's for Enhanced Oil Recovery in Unconventional Liquid Reservoirs[J]. J. Pet. Sci. Eng. 202 (1), 108472. doi:10.1016/j.petrol.2021.108472
Zhang, P., Ren, S., and Yu, S. (2019). Enhanced Stability and High Temperature-Tolerance of CO2 Foam Based on a Long-Chain Viscoelastic Surfactant for CO2 Foam Flooding[J]. RSC Adv. 9 (15), 8672–8683. doi:10.1039/c9ra00237e
Keywords: carbon dioxide, foam flooding, heat-resistant, plugging, profile control
Citation: Liu Y, Zhang C, Wen Q, Li Z and Song M (2022) Heat-Resistant CO2 Foam for Promoting Carbon Capture and Enhanced Oil Recovery. Front. Energy Res. 10:883214. doi: 10.3389/fenrg.2022.883214
Received: 24 February 2022; Accepted: 28 March 2022;
Published: 27 April 2022.
Edited by:
Mehdi Ostadhassan, Northeast Petroleum University, ChinaReviewed by:
Xiaodong Han, China University of Petroleum, ChinaKang Zhou, Shandong University of Science and Technology, China
Copyright © 2022 Liu, Zhang, Wen, Li and Song. This is an open-access article distributed under the terms of the Creative Commons Attribution License (CC BY). The use, distribution or reproduction in other forums is permitted, provided the original author(s) and the copyright owner(s) are credited and that the original publication in this journal is cited, in accordance with accepted academic practice. No use, distribution or reproduction is permitted which does not comply with these terms.
*Correspondence: Zhaomin Li, bGl6aG1AdXBjLmVkdS5jbg==