 Zhou Dai
 Gang Wang1*
- 1School of Electric Power Engineering, South China University of Technology, Guangzhou, China
- 2China Southern Power Grid Materials Co., Ltd, Guangzhou, China
The demand projection of power grid materials can furnish an effective support for the management of power grid materials. Due to variations in the data distribution of individual districts and diversity of materials, a single forecasting model is incapable of accurately predicting the demand for all types of materials. Moreover, for the data-driven network model, the effect of the model has a strong correlation with the quality of its input parameters. To address these problems, this study proposes a power grid material demand forecasting model based on feature selection and multi-model fusion. The first step in this regard is the usage of Pearson coefficient in the selection of main characteristic parameters from original parameters and using them as the input of the network model. Then, stacking fusion algorithm is used to fuse multiple basic models. At last, the proposed method mentioned in this study is tested on a real dataset. The results depict that the proposed method can fully integrate the advantages of various basic models with higher accuracy and generalization ability.
Introduction
A power grid system is one of the preeminent pillars for national economic development. Any sort of issue in power equipment might cause large-scale power outage of the power grid, thus leading to huge negative impacts. At present, the material management of power grid has several problems including “the material data fragmentation, material reserves mechanization, and main responsibility ambiguity.” The accuracy, correctness, and integrity problems existing in most of the historical demand data of electric power materials, which leads to the demand of material, cannot be predicted (Lai et al., 2016; Oliveira et al., 2021),. thereby causing inadequate refinement of material management. Therefore, in order to achieve higher efficiency and precision of material management, the material demand forecasting has been researched deeply throughout the world.
According to the references (Pan et al., 2016; Wang and Gu, 2016; Zhao et al., 2017; Wang et al., 2019; Dong et al., 2020; Ming et al., 2021), most of the prediction models for power grid materials are presently using a single model structure having the problem of either over-fitting or under-fitting and also have poor generalization for different scenarios. However, the data model requires a high quality of input parameter information. As a result, the input parameter information should be screened. According to the reference (Yang et al., 2022a), this research is a pioneer study for SCUC problems that proposes an expanded sequence-to-sequence (E-Seq2Seq) based data-driven SCUC expert system for dynamic multiple-sequence mapping samples; it can accommodate the mapping samples of SCUC and consider the various input factors that affect SCUC decision-making, possessing strong generality, high solution accuracy, and efficiency over the traditional method.
Aiming at the aforementioned problems, this study proposes a power grid material prediction model based on feature selection and multi-model fusion. First, the Pearson coefficient will be used to calculate the relevant characteristic parameters. After removing the irrelevant parameters, the important characteristic parameters related to the problem will be extracted as the input of the subsequent network model. Afterward, the multiple base models will be fused using stacking fusion. The basic model will utilize gradient boosting decision tree (GBDT), extreme gradient boosting tree (XgBoost), and long- and short-term memory network (LSTM), portraying excellent regression learning ability. The multi-model fusion network is able to fulfill the advantages of each basic model, through high prediction accuracy as well as improvement in the generalization ability.
Statistical Analysis of Power Grid Material Faults and Defects
First of all, this study presents a statistical analysis of the defect levels of a certain bureau of China Southern Power Grid Corporation from 2015 to 2019. The defect levels can be categorized into four types: emergency, major, general, and others accounting for 46, 9, 42, and 3%, respectively. Based on various types of defects, the current material demand can be bifurcated into three categories, namely, daily materials (defect level is general), major defect materials, and emergency defect materials (Gong, 2013; Ke et al., 2017; Dong, 2018; Chai, 2020; Shen and Raksincharoensak, 2021; Yang et al., 2022b).
The main factors responsible for these defects include the quality of the product design, the quality of construction, the quality of operation and maintenance, the service time of products, the overload state of equipment, and the natural environment.
The Model of Power Grid Material Demand
Gradient Boosting Decision Tree Algorithm
The gradient boosting decision is made to superimpose M sub-trees to achieve regression prediction:
In the formula shown previously, x represents the input sample,
Then, building M trees,
1) For the sample
2) For the sample
3) For
4) Renewing the learner
5) The final expression of the strong learner
The model of GBDT has many parameters, such as the number of base learners, the learning rate, the number of subsamples, and the maximum depth of each base learner (decision tree). Due to the limited number of defect data samples, the maximum depth of the tree should not be too deep.
Extreme Gradient Boosting Tree
Extreme gradient boosting algorithm is an ensemble learning algorithm based on gradient boosting. It calculates the final regression result by integrating multiple basic trees. It has advantages pertaining to high efficiency and accuracy in regression tasks. On the basis of GBDT, XgBoost introduces the loss function of the second derivative of the predicted results. It adds the tree model complexity into the objective function as a regular term. This can prevent over-fitting and improve the generalization performance of the model. In this study, the XgBoost prediction function is constructed as follows (Malhotra et al., 2015; Sikora and Al-Laymoun, 2015; Xu et al., 2015):
Since the model is additive, the current prediction results need to be added to calculate in each iteration.
The overall objective function is:
The
Taylor expansion of
Then, the ideal weight of leaf node j in round t should be
The quality score of the tree in round t is marked by the following formula:
For all leaf nodes to be split in this round,
Compared to GBDT, XgBoost algorithm is a further optimization design, which can reduce model variance through row sampling. Also, it reduces over-fitting through learning rate setting. Moreover, it controls the tree growth through early stopping to avoid over-fitting.
Long- and Short-Term Memory Network
Figure 1 illustrates the unit structure of LSTM. At every moment t, the weight calculated by LSTM is linked back to itself. The input to the LSTM unit is the previous state
1) Input the sequence value
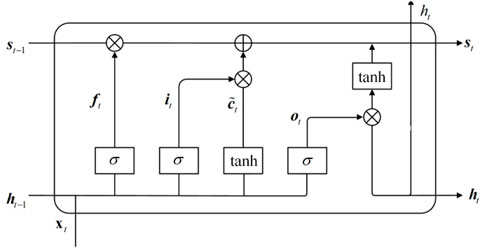
FIGURE 1. Unit structure of LSTM.
In the previously stated formula,
2) The input gate state formula is illustrated as follows:
Confirm that the Data Availability statement is accurate. Note that we have used the statement provided at Submission. If this is not the latest version, please let us know
In the aforementioned formula,
3) Output information of LSTM is determined by the output gate and unit state as shown in the following equation:
In the formula,
Stacking Fusion Algorithm
Stacking fusion algorithm reduces the generalization error of the whole model and improves the classification accuracy of the model via building a two-layer learner. This makes the second-layer model to learn the classification results of the first-layer model. Among them, T basic classification models are first used in the first layer. After inputting the original data, a result with the same data size is outputted as the input of the second-layer network. The output of each basic learner is used as input when training the second-layer learner, and the function of the second-layer learner is to integrate the output of the basic learner.
Power Grid Material Prediction Based on Pearson Feature Selection and Multi-Model Fusion
In this study, the integrated feature scoring model is used to evaluate, and the total score is averaged to avoid the limitations of single feature selection and finally optimizes the effect of feature selection. With the help of classical Pearson correlation coefficient analysis and selecting high linear correlation attributes, we can roughly find out the relevant attribute categories that have a great impact on material defects. The Pearson correlation coefficient formula is shown in Eq. 21 and Eq. 22. Through this formula, Pearson correlation coefficient can be obtained by dividing the covariance by the standard deviation of two related variables, which is used to make up for the weak performance of the covariance value in the correlation degree of random variables.
The range of the Pearson coefficient is
Examples Analysis
The sample dataset provided by the power supply bureau of China Southern Power Grid Corporation was selected for training and testing. The defect data from 2015 to 2019 were initially used to train the model, and then the data from 2020 were tested to verify the prediction effect of the model.
The Method of Model Evaluation
In order to comprehensively evaluate the validity and accuracy of the proposed method in power grid material forecasting, the following two evaluation indexes are selected:
The value of the root mean square error (RMSE) between the real value of the test set and the predicted value of the model is expressed as follows:
The average relative error between the real value and the predicted value,
The Result of Examples Analysis
In this study, the prediction results of emergency defect materials are compared and analyzed, taking overhead wire as an example.
The number of sub-trees of XgBoost is set at 300, and the learning rate is kept at 0.04, while the penalty factors
Table 1 shows the prediction results of different base models, multi-model fusion, and multi-model fusion with feature optimization for emergency materials. The results of the basic model are obtained directly from their own network without the second layer fusion of the proposed network.
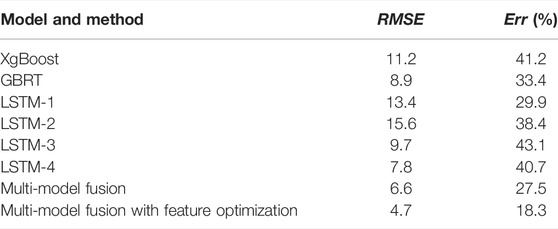
TABLE 1. Comparison of different basic models and fusion model algorithms for emergency defective material prediction.
The results of the evaluation index reveal that a single model cannot achieve the best effects. After using the multi-model fusion algorithm, it can make full use and give full play to the prediction advantages of each basic model in one aspect. Moreover, it improves the overall prediction accuracy of the algorithm. It also avoids the phenomenon of over-fitting along with enhanced stability of prediction. On the basis of multi-model fusion, this study also uses Pearson coefficient to optimize the input parameters and selects the most important characteristic parameters as the input of the network. Therefore, after the feature optimization of the original input parameters, the main influencing feature parameters can be selected. Following this, the feature parameters of irrelevant factors can be eliminated, so that the subsequent learning model can better fit the historical data. Therefore, based on the aforementioned observations, it can be concluded that the multi-model fusion algorithm of feature optimization proposed in this study has high accuracy in the prediction of power grid materials.
Conclusion
Focusing at the problem of material prediction in the power system, a prediction method based on feature selection and multi-model fusion is proposed in this study. Starting by calculating the Pearson coefficient, the irrelevant parameters are removed from the original parameters. The main characteristic parameters are then selected as the input of the subsequent network model. Furthermore, three excellent data-driven models are identified as the basic model followed by the application of the stacking method for fusion. The fusion algorithm can not only make full use of the advantages of each basic model to improve the prediction accuracy but also improve the generalization ability of the model. Hence, the predicted power grid material demand can provide an effective data support for the management of power grid materials.
Data Availability Statement
The original contributions presented in the study are included in the article/Supplementary Material, further inquiries can be directed to the corresponding author.
Author Contributions
ZD put forward the research technical route of the manuscript; GW reviewed the scientificity of the manuscript; and RB and CD completed the data analysis of the manuscript.
Conflict of Interest
Authors ZD, RB, and CD were employed by China Southern Power Grid Materials Co., Ltd.
The remaining author declares that the research was conducted in the absence of any commercial or financial relationships that could be construed as a potential conflict of interest.
Publisher’s Note
All claims expressed in this article are solely those of the authors and do not necessarily represent those of their affiliated organizations, or those of the publisher, the editors, and the reviewers. Any product that may be evaluated in this article, or claim that may be made by its manufacturer, is not guaranteed or endorsed by the publisher.
References
Chai, Q. (2020). Research on Forecasting Method of Emergency Materials for Meteorological Disasters in Power Grid[D]. Jinan, China: Shandong University.
Chen, T., He, T., Benesty, M., and Khotilovich, V. (2015). Xgboost: Extreme Gradient boosting[J], 1. R package version 0.4-2.4
Dong, Wei. (2018). Research on Grid Materials Warehousing Dispatch Optimization Decision-Making Model and Decision Support system[D]. Beijing: North China Electric Power University.
Dong, Y., Shen, S., and Lu, X. (2020). Prediction of the Duration of Electricity Material in Stock Based on Gradient Boosting Decision Tree[J]. Electric Power Inf. Commun. Tech. 18 (9), 50–56. doi:10.16543/j.2095-641x.electric.power.ict.2020.09.008
Feng, W., Zhu, Q., Zhuang, J., and Yu, S. (2019). An Expert Recommendation Algorithm Based on Pearson Correlation Coefficient and FP-Growth[J]. Cluster Comput. 22, S7401–S7412. doi:10.1007/s10586-017-1576-y
Gong, W. (2013). Research on Inventory Control and Demand Forecast of Power Supplies Based on Demand Features Classification[D]. Shenyang, China: Northeastern University.
Hu, Z., Tong, H., Zeng, Y., Luo, X., Wang, J., Huang, S., et al. (2018). Fast Image Recognition of Transmissiontower Based on Big Data[J]. Prot. Control. Mod. Power Syst. V3 (2), 149–158. doi:10.1186/s41601-018-0088-y
Ke, G. L., Meng, Q., Finley, T., Wang, T. F., Chen, W., Ma, W. D., et al. (2017). “Lightgbm: A Highly Efficient Gradient Boosting Decision Tree[J]”, in Proceeding of 31st Annual Conference on Neural Information Processing Systems (NIPS), Long Beach, CA, December, 2017 30.
Lai, W., Li, R., Xie, L., and Qi, M. (2016). “The Vehicle Routing for Power Grid Material Distribution: A Case Study in China[C],” in Proceeding of the 2016 13th International Conference on Service Systems and Service Management (ICSSSM), Kunming, June 2016 (IEEE), 1–5.
Li, H., Deng, J., Feng, P., Pu, C., Arachchige, D., and Cheng, Q. (2021a). Short-Term Nacelle Orientation Forecasting Using Bilinear Transformation and ICEEMDAN Framework. Front. Energy Res. 9, 780928. doi:10.3389/fenrg.2021.780928
Li, H., Deng, J., Yuan, S., Feng, P., and Arachchige, D. (2021b). Monitoring and Identifying Wind Turbine Generator Bearing Faults using Deep Belief Network and EWMA Control Charts. Front. Energy Res. 9, 799039. doi:10.3389/fenrg.2021.799039
Malhotra, P., Vig, L., Shroff, G., and Agarwal, P. (2015). “Long Short Term Memory Networks for Anomaly Detection in Time Series[C],” in Proceedings. Presses universitaires de Louvain, Bruges, Belgium, April 2015, 89–94.
Ming, L., Zheng, Y., and Gao, Z. (2021). Electric Power Materials Demand Forecasting Based on Influencing Factors Multi-Dimensional Fusion and Bayesian Probability Updating[J]. Logistics Tech. 40 (3), 71. doi:10.3969/j.issn.1005-152X.2021.03.014
Oliveira, T., Caseiro, L., Mendes, A., Cruz, S., and Perdigão, M. (2021). Model Predictive Control for Paralleled Uninterruptible Power Supplies with an Additional Inverter Leg for Load-Side Neutral Connection. Energies 14 (8), 2270. doi:10.3390/en14082270
Pan, W., Zhong, S., Huang, S., and Wu, D. (2016). “Online Power Grid Emergency Material Demand Forecasting Model in Typhoon Disaster Based on Relevance Vector Machine[C],” in Proceeding of the 2016 9th International Symposium on Computational Intelligence and Design (ISCID), Hangzhou, China, Dec. 2016 (IEEE), 402–405.
Rao, H., Shi, X., Rodrigue, A. K., Feng, J., Xia, Y., Elhoseny, M., et al. (2019). Feature Selection Based on Artificial Bee colony and Gradient Boosting Decision Tree. Appl. Soft Comput. 74, 634–642. doi:10.1016/j.asoc.2018.10.036
Shen, X., Ouyang, T., Yang, N., and Zhuang, J. (2021). Sample-based Neural Approximation Approach for Probabilistic Constrained Programs. IEEE Trans. Neural Netw. Learn. Syst., 1–8. doi:10.1109/TNNLS.2021.3102323
Shen, X., and Raksincharoensak, P. (2021). Pedestrian-aware Statistical Risk Assessment. IEEE Trans. Intell. Transport. Syst., 1–9. doi:10.1109/TITS.2021.3074522
Sheridan, R. P., Wang, W. M., Liaw, A., Ma, J., and Gifford, E. M. (2016). Extreme Gradient Boosting as a Method for Quantitative Structure-Activity Relationships. J. Chem. Inf. Model. 56 (12), 2353–2360. doi:10.1021/acs.jcim.6b00591
Sikora, R., and Al-Laymoun, O. l. (2015). A Modified Stacking Ensemble Machine Learning Algorithm Using Genetic Algorithms. IGi Glob. 23, 43–53. doi:10.4018/978-1-4666-7272-7.ch004
Singh, M. (2017). Protection Coordination in Distributionsystems with and without Distributedenergy Resources- a Review. J].Protection Control. Mod. Power Syst. V2 (3), 294–310. doi:10.1186/s41601-017-0061-1
Son, J., Jung, I., Park, K., and Han, B. (2015). “Tracking-by-segmentation with Online Gradient Boosting Decision Tree[C],” in Proceedings of the IEEE International Conference on Computer Vision, Santiago, Chile, Dec. 2015 (IEEE), 3056–3064.
Wang, J., and Gu, Y. (2016). Design of Combined Demand Forecasting System for Electric Power Supplies[J]. Enterprise Manag. S1, 130–131. CNKI:SUN:QIGL.0.2016-S1-062.
Wang, Z-J., Zhu, Y-Q., and Sun, J-P. (2019). Prediction of Power Grid Material Demand Based on Matrix Decomposition[J]. J. Sichuan Univ. (Natural Sci. Edition) 56 (4), 639–644. doi:10.3969/j.issn.0490-6756.2019.04.010
Wu, Z., Wang, X., and Jiang, B. (2020). Fault Diagnosis for Wind Turbines Based on ReliefF and eXtreme Gradient Boosting. Appl. Sci. 10 (9), 3258. doi:10.3390/app10093258
Xu, H., and Deng, Y. (2018). Dependent Evidence Combination Based on Shearman Coefficient and Pearson Coefficient[J]. IEEE ACCESS 6, 11634–11640. doi:10.1109/ACCESS.2017.2783320
Xu, Y., Mou, L., Li, G., Chen, Y., Peng, H., and Jin, Z. (2015). “Classifying Relations via Long Short Term Memory Networks along Shortest Dependency Paths[C],” in Proceedings of the 2015 conference on empirical methods in natural language processing, 1785–1794.
Yang, N., Dong, Z., Wu, L., Zhang, L., Shen, X., Chen, D., et al. (2021). A Comprehensive Review of Security-Constrained Unit Commitment. J. Mod. Power Syst. Clean Energ., 1–14. doi:10.35833/MPCE.2021.000255
Yang, N., Qin, T., Wu, L., Huang, Y., Huang, Y., Xing, C., et al. (2022). A Multi-Agent Game Based Joint Planning Approach for Electricity-Gas Integrated Energy Systems Considering Wind Power Uncertainty. Electric Power Syst. Res. 204, 107673–107796. doi:10.1016/j.epsr.2021.107673
Yang, N., Yang, C., Wu, L., Shen, X., Jia, J., Li, Z., et al. (2022). Intelligent Data-Driven Decision-Making Method for Dynamic Multisequence: An E-Seq2Seq-Based SCUC Expert System. IEEE Trans. Ind. Inf. 18, 3126–3137. doi:10.1109/TII.2021.3107406
Yang, N., Yang, C., Xing, C., Ye, D., Jia, J., Chen, D., et al. (2021). Deep Learning-Based SCUC Decision-Making: An Intelligent Data-Driven Approach with Self-Learning Capabilities. IET Generation Trans. Dist 16, 629–640. doi:10.1049/gtd2.12315
Keywords: power grid materials, demand prediction, feature selection, fusion algorithm, gradient boosting decision tree, eXtreme gradient boosting tree, long- and short-term memory network
Citation: Dai Z, Wang G, Bian R and Deng C (2022) Power Grid Material Demand Forecasting Based on Pearson Feature Selection and Multi-Model Fusion. Front. Energy Res. 10:882818. doi: 10.3389/fenrg.2022.882818
Received: 24 February 2022; Accepted: 11 March 2022;
Published: 26 April 2022.
Edited by:
Xun Shen, Tokyo Institute of Technology, JapanReviewed by:
Gaurav Sachdeva, DAV University, IndiaSandeep Kumar Duran, Lovely Professional University, India
Copyright © 2022 Dai, Wang, Bian and Deng. This is an open-access article distributed under the terms of the Creative Commons Attribution License (CC BY). The use, distribution or reproduction in other forums is permitted, provided the original author(s) and the copyright owner(s) are credited and that the original publication in this journal is cited, in accordance with accepted academic practice. No use, distribution or reproduction is permitted which does not comply with these terms.
*Correspondence: Gang Wang, d2FuZ2dAc2N1dC5lZHUuY24=