 Wei Zhang1
 Honggang Fan
- 1State Key Laboratory of Hydroscience and Engineering, Department of Energy and Power Engineering, Tsinghua University, Beijing, China
- 2College of Mechanical and Electronic Engineering, Shandong University of Science and Technology, Qingdao, China
Cavitation is a common phenomenon in hydraulic power industry, ship propulsion, pump station and other industrial fields. In the present work, a high-speed camera is used to visualize the flow field in a rotational hydrodynamic cavitation reactor (RHCR) in a closed cycle test rig, and the numerical simulation is carried out based on the RNG k-ε turbulence model and the Zwart-Gerber-Belamri (ZGB) cavitation model. Influence of hole diameter, hole height and hole cone bottom length on performance of RHCR are comprehensively investigated. The results show that the numerical results are in good agreement with the experimental data, which verifies the accuracy and reliability of the numerical method. The hole diameter mainly influences the water vapor exchange boundary, the hole height mainly influences the cavitation area and intensity, and the cone bottom length mainly influences the vortex number and intensity. Under different hole diameters, the dominant frequent of pressure fluctuation in hole is 24 fi corresponding to the hole number along the circumferential direction, and the maximum amplitude appears near the hole top due to the small gap between the hole top and the side wall of the rotor. When the hole diameter increases from 11 to 17 mm, the pressure fluctuation amplitude increases by 1.65 times for each increase of 2 mm.
Introduction
Cavitation is an unsteady and multiphase turbulent flow phenomenon involving mass transfer between vapor and liquid phases (Liu et al., 2018; Liu et al., 2019a; Liu et al., 2019b). Cavitation flow is accompanied by the formation, development and collapse of cavitation, as well as the mass and energy transfer of two phases (Prasad et al., 2018; Sun and Lei, 2020). During this process, the collapse of the bubble can generate a local hot spot of 2,000–6,000 K and induce 1010 K/s heat transfer within 1 ms (Hart et al., 1990; Flint and Suslick, 1991; Didenko et al., 1999a; Didenko et al., 1999b; Rae et al., 2005). Meanwhile, in this extreme environment, water molecules can undergo splitting reactions and chain reactions to produce H and OH radicals (Gostisa et al., 2021). It can accelerate chemical reaction (Sun et al., 2018a), sewage treatment (Sun et al., 2021a), organic matter decomposition (Sun et al., 2021b), sterilization and deactivation (Pegu and Arya, 2021), biodiesel synthesis (Innocenzi and Prisciandaro, 2021) and other engineering applications. Therefore, it has a promising potential application in industry and shares a broad prospect in many disciplines.
According to the flow physics of cavitation generation, cavitation can be generally classified into acoustic cavitation (AC) (Gholami et al., 2020), hydrodynamic cavitation (HC) (Wang et al., 2021), optical cavitation (OC) (Gogate, 2007) and particle cavitation (PC) (Sun et al., 2020a). Among them, the first two categories are more widely studied. With the development and popularization of ultrasonic equipment, the researches on ultrasonic cavitation have experienced a significant increase, and its applications involve many aspects such as medicine (Qian et al., 2020), material processing (Zhao et al., 2020), biochemistry (Patil et al., 2021) and food processing (Krasnikova et al., 2020). However, due to the disadvantages of high energy consumption, small cavitation area and high equipment cost, ultrasonic cavitation has some drawbacks in its further industrialization and practical application (Burzio et al., 2019). On the contrary, hydrodynamic cavitation has the advantages of simple design, low price and high efficiency, so it is widely used in industry (Kwon and Yoon, 2013). In the past, hydrodynamic cavitation is usually generated by orifice plate (Angele, 2021), venturi tube cavitation reactor (Bimestre et al., 2020) and so on. Kuldeep et al. (Kuldeep and Kumar, 2016) numerically simulated flow field inside the venturi cavitation reactor, and the results show that the ratio 1:1 of throat height/diameter to length and 6.5° of divergence angle can be an optimal geometry for best cavitation activity. Alister et al. (Simpson and Ranade, 2018) quantitatively discussed the influence of some key geometric parameters such as the orifice plate thickness, orifice inlet sharpness and wall angle on cavitation behaviors. Keiji et al. (Yasuda and Ako, 2019) studied the influence of venturi shape on the hydrodynamic cavitation reaction rate. Alves et al. (2019) investigated the hydrodynamic cavitation efficiency in removing chemical oxygen demand (COD) from sucrose solution and from effluent generated by the soft drink industry. However, because these two types of cavitation generators induce cavitation through cross-sectional area change, the water flow is severely restricted and the pressure loss is large (Šarc et al., 2018). In addition, their effectiveness was found to be unsatisfactory with high expenses (Sun et al., 2020b). Therefore, more efficient designs need to be developed that can replace the traditional cavitation generator.
Recently, a rotational hydrodynamic cavitation reactor that is composed of rotor and stator is used to generate cavitation. The cavitation mechanism of the structure cavitation reactor is composed of various forces in the complex flow field (mainly shear force and centrifugal force). It gets rid of the traditional cavitation generation mode, and can generate group cavitation in the cavitation reactor with high cavitation intensity and high cavitation efficiency. PetkovsEk et al. (2013) and Badve et al. (2013) studied the ability of rotational structure reactor to treat sewage and industrial wastewater. Kim et al. (2019) carried out the experiment of sludge treatment by rotational cavitation reactor. Milly et al. (2008) used a rotational structure reactor to sterilize fluid food. Sun et al. (2018b) studied the thermal performance of a new type of rotational hydrodynamic cavitation reactor through experiments. Thaiyasuit et al. (2021) studied the optimal production conditions for biodiesel production in a rotating cavitation reactor with uneven rotor surface. Janez et al. (Kosel et al., 2019) used a rotational cavitation reactor to refine pulp samples and found that the device could generate strong shear force and multiple cavitation regions. All of the above researches are based on the applicability test of RHCR, but the mechanism research of RHCRs and the influence of its own structure on the cavitation effect are very limited. Moreover, the hole in the rotor and its geometrical structure is vital for the cavitation generation, and there is still a significant vacancy in quantitatively investigating its effects and underlying mechanics.
In order to address the above problems, the high-speed photographic measuring and the numerical simulation were both employed to study the cavitating flow pattern and pressure fluctuation characteristics inside the RHCR. Subsequently, the correlation between the hole diameter, height and cone bottom length and cavitation characteristics were analyzed, which contributes to the optimal design of RHCR.
Experimental and Numerical Methodology
Research Object
As shown in Figure 1, the RHCR is mainly composed of a rotor and a stator. The rotor is a solid cylinder with a diameter of 264 mm. 24 rows of inner holes are evenly distributed on the rotor surface along the circumferential direction, and the angle between any two adjacent rows of inner holes is 15°. There are 5 columns of inner holes evenly distributed on the rotor surface along the axial direction, and the distance between two adjacent rows of inner holes is 22.5 mm. The height of each hole is 55 mm and the diameter is 15 mm. The clearance between the rotor and the stator is fixed at 8 mm. The rotor rotates under the drive of the motor and generates cavitation in the inner hole. The motor can be controlled by the inverter by setting different rotation speeds. The rotation speed in the present work is set as 1,200 r/min.
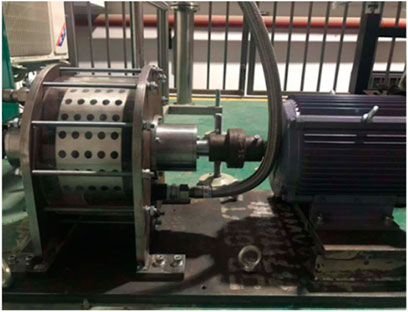
FIGURE 1. Tested rotational hydrodynamic cavitation reactor.
In order to reveal the influence of the inner hole structure on the performance of the RHCR, this study analyzed three geometric factors of the inner hole structure. Case 1 keep the hole height 55 mm and the cone bottom length 5 mm unchanged, and select five kinds of diameters, 11, 13, 15, 17 and 19 mm respectively. Case 2 keep the hole diameter 15 mm and the cone bottom length 5 mm unchanged, and select five kinds of heights, 25, 35, 45, 55, and 65 mm respectively. Case 3 keep the hole diameter 15 mm and the height 55 mm unchanged, and select five kinds of cone bottom lengths, 1, 3, 5, 7, and 9 mm respectively. The detailed information on the geometrical factors can be found in Figure 2.
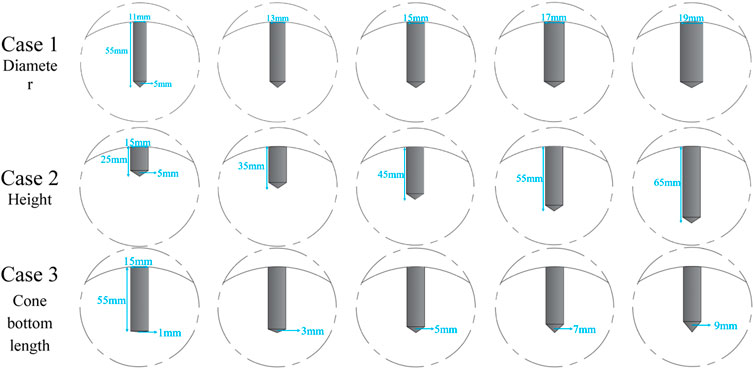
FIGURE 2. Various geometrical factors of the hole.
Computational Domain and Meshes
As shown in Figure 3A, the computational domain is divided into four parts: inlet domain, cavity domain, rotor domain and outlet domain. The rotor-stator interface is employed to couple the adjacent rotary domain and stationary domain. Moreover, the fluid domain adopts a hexahedral structure mesh is applied to the whole computational domain by using ANSYS ICEM 20.0. Furthermore, mesh near the wall of the inner holes is locally refined, as shown in Figures 3B,C.
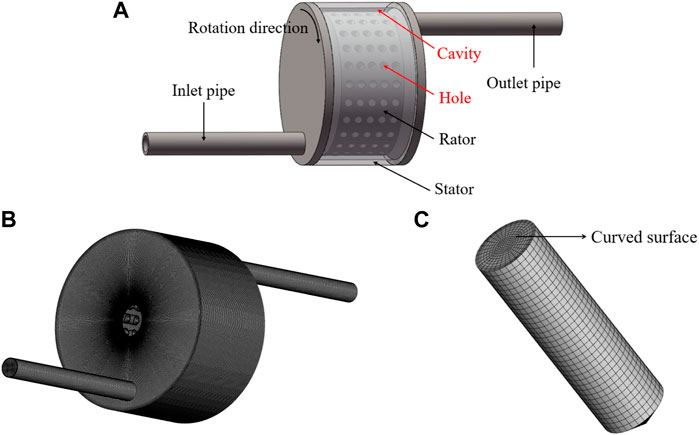
FIGURE 3. The model and mesh of RHCR: (A) Schematic diagram of the RHCR, (B) Computing domain mesh, and (C) Single hole mesh.
Numerical Method and Setting
Numerical Model and Boundary Conditions
The fluid in the cavitation flow field is considered a homogeneous and compressible mixed medium of liquid and vapor. The continuity and momentum equations in the Cartesian coordinates are as follows:
where ρ is density, t is time, u is velocity, μ is viscosity coefficient, and F is volume force. The RNG k-ε (Liu et al., 2009) turbulence model is applied because of its advantage in predicting the flow with a high strain rate and streamline curvature.
The cavitation model proposed by Zwart is employed to simulate the cavitation flow. In this model, a transport equation with source terms based on the homogeneous flow is used to solve the interphase mass transfer between liquid and vapor phases, which is governed as follows:
The mass transfer for vaporization rate m+ and condensation rate m− are modeled as follows:
where αv is the vapor volume fraction. ρv is the vapor density, and its value is 0.02308 kg/m3 ρl is the liquid density, and its value is 997 kg/m3 pv is the water vaporization pressure that is set as 3,574 Pa in the present simulation. Cvap and Cvond are the empirical coefficients of evaporation and condensation, and their values are 50 and 0.01 respectively (Zwart et al., 2004).
In the present study, the total volume fraction of vapor, βtotal, is defined as the ratio of total vapor volume Vvapor to total volume Vtotal of fluid domain.
where, N is the total number of holes in the fluid domain. βvapor is the volume fraction of steam in each inner hole, Vi is the volume of each inner hole.
The commercial software ANSYS-CFX 20.0 are employed in the present work to simulate the internal flow of the RHCR. The flow conditions of the numerical simulation are consistent with those in the experiment test. The total inlet pressure is 90,000 Pa. The liquid volume fraction is 1, and the gas volume fraction is 0. The outlet mass flow is set to 2.5 kg/s. Non slip wall condition is applied on all the solid walls of the RHCR. In transient calculation, the results of steady calculation were ultilized as the initial flow field.
Independence Test of Mesh Density and Time Step
Because the geometrical models for each case were not identical, the maximum element size was chosen as the index of the mesh resolution, instead of using the total cell number. Table 1 presents the results of the mesh-independence test for three mesh resolutions of the original model: coarse, medium, and fine. Because the relative pressure difference between the medium and fine mesh was negligible. Considering the computational resources and mesh sensitivity, this paper adopts a medium mesh resolution to predict the simulation results.
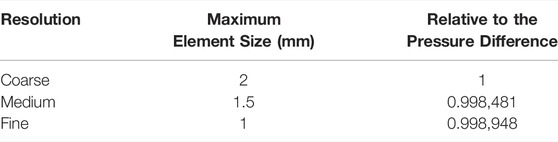
TABLE 1. Results of the mesh-independence test.
In the transient calculation, in order to verify the time independence, the time step Δt is taken as 1/16, 1/32 and 1/64 of the time interval between two adjacent inner holes at the same position. These three times steps are corresponding to T/24/16 = 0.0001302s, T/24/32 = 0.0000651s, T/24/64 = 0.0000326s, where T is the rotating period of the RHCR. As shown in Figure 4, a monitoring point is set up every 11 mm from the bottom of the hole, and a total of 5 monitoring points are V1, V2, V3, V4, and V5 respectively.
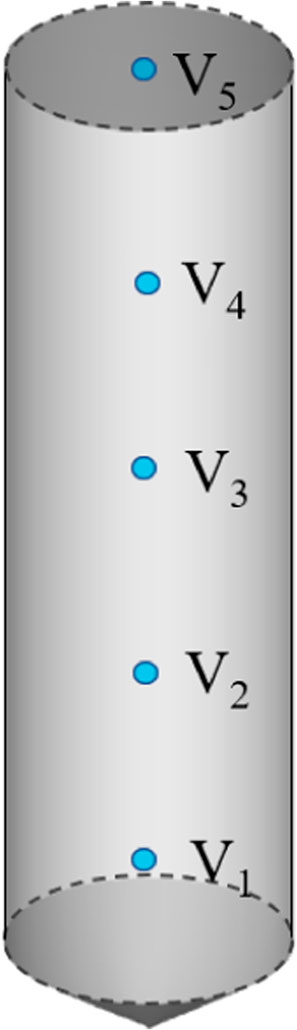
FIGURE 4. Monitoring points in hole.
The calculation results of the three times steps are shown in Figure 5, the difference between the simulation results under three times steps is very small. Considering the calculation cost, this paper takes the Δt = 0.0001302s.
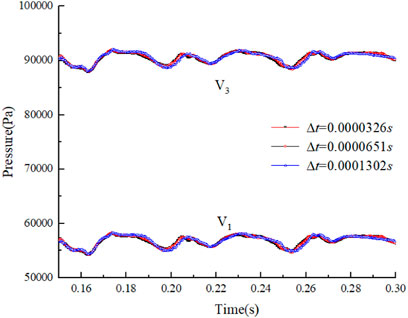
FIGURE 5. Time-step independence verification.
In order to verify the accuracy of numerical simulation, the fully developed cavitation patterns obtained by the experiment shown in Figure 6B and the simulation shown in Figure 6C is compared. The results show that the numerical simulation agrees well with the experimental observation, which shows that the employed numerical method is reliable and accurate to predict the cavitating flow field inside the RHCR.
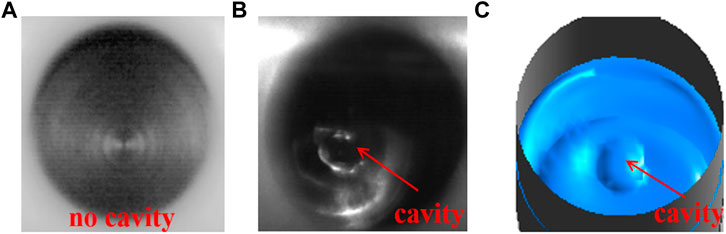
FIGURE 6. Comparison of experiment and simulation: (A) no cavity of experiment diagram, (B) cavity of experiment diagram, and (C) cavity of simulation diagram.
Results and Analysis
Based on the previous methods, a systematic investigation on the influence of hole diameter, hole height and cone bottom length on the cavitation patter has been carried out. The pressure fluctuation characteristics of RHCR are further analyzed with consideration of the most influential parameter.
Effect of Diameter
Figure 7 shows the vapor phase distribution under different hole diameters varying from 11 to 19 mm. It is found that the increase of hole diameter results in the increase of cavitation intensity and area. As demonstrated in Figure 7, when the hole diameter increases from 11 to 19 mm, the cavitation extends from the hole bottom to the top. The vapor volume fractions βtotal are 10% of D1 = 11 mm, 22% of D2 = 13 mm, 55% of D3 = 15 mm, 75% of D4 = 17 mm, and 85% of D5 = 19 mm, respectively. For a small hole diameter, the cavitation intensity is suppressed due to the rotor centrifugal force. With the hole diameter increasing, the water-vapor exchange boundary shifts towards the hole top, which leads to a stronger exchange with the water in the actor. Consequently, the hole diameter plays a significant role on cavitation intensity and area in the RHCR.
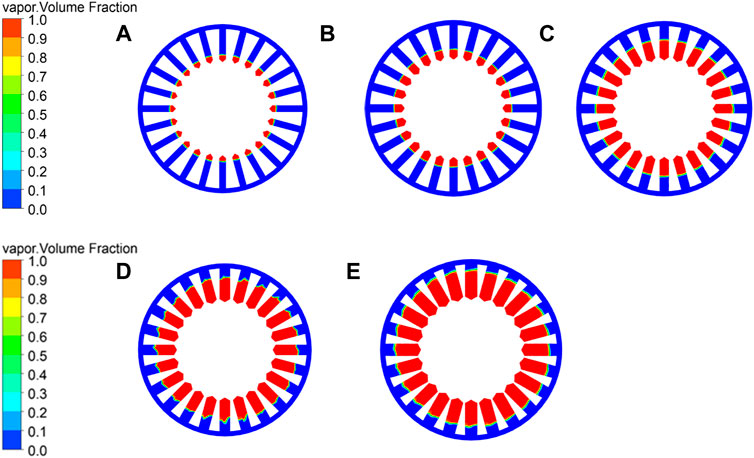
FIGURE 7. Vapor phase distribution with different diameters: (A) D1 = 11 mm, (B) D2 = 13 mm, (C) D3 = 15 mm, (D) D4 = 17 mm, and (E) D5 = 19 mm.
Effect of Height
Figure 8 shows the vapor phase distribution under different hole height varying from 25 to 65 mm. The results show there is none cavitation under hole height of H1 = 25 mm, and when the hole height increases to H2 = 35 mm the cavitation appears. The vapor volume fractions are 0% of H1 = 25 mm, 18% of H2 = 35 mm, 55% of H3 = 45 mm, 75% of H4 = 55 mm, and 85% of H5 = 65 mm, respectively.
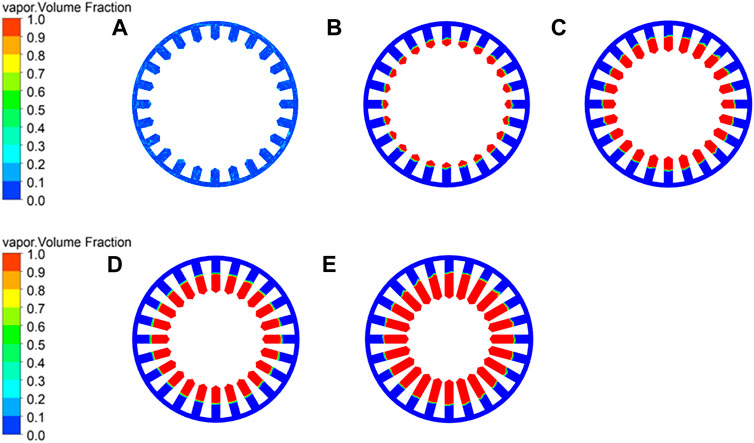
FIGURE 8. :Vapor phase distribution with different heights: (A) H1 = 25 mm, (B) H2 = 35 mm, (C) H3 = 45 mm, (D) H4 = 55 mm, and (E) H5 = 65 mm.
Figure 9 shows the pressure and streamline in the hole of different height. when the height of the hole is less than 25 mm, the water in the hole can sufficiently exchange with the outer water despite of the centrifugal force generated by the rotation of the rotor, and the pressure in the hole bottom is not below the saturated vapor pressure. Therefore, the cavitation does not occur under hole height of H1 = 25 mm. When the height of the hole is greater than 25 mm, the streamlines are complex in the hole with the heights of 35, 45, and 55 mm in Figure 9. Due to the increase of the hole height, the water in the hole cannot flow into the hole completely because of the centrifugal force, the water reduces the pressure inside the hole, thus creating cavitation. For the hole height structures from 35 to 55 mm, the center of the vortex is just on the boundary of the low pressure region in the hole, which is just about 25 mm. This better explains why cavitation occurs in the region below 25 mm hole height.
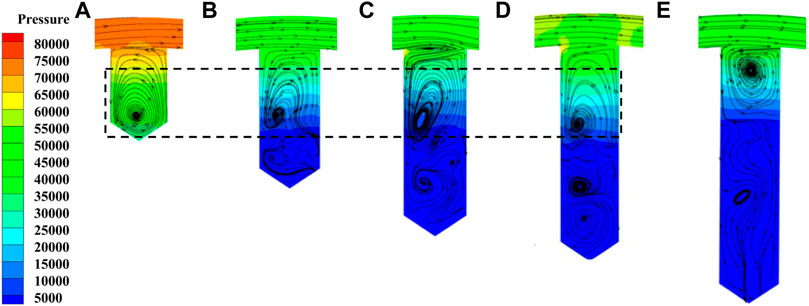
FIGURE 9. Streamline distribution in hole of different hole height: (A) H1 = 25 mm, (B) H2 = 35 mm, (C) H3 = 45 mm, (D) H4 = 55 mm, and (E) H5 = 65 mm.
In summary, for different hole heights, the water-vapor exchange boundary is nearly the same position. The reason is that the centrifugal force is related to the radius of a circle. With the increase of the hole height, the cavitation intensity and area increase.
Effect of Cone Bottom Length
Figure 10 shows the vapor phase distribution under different cone bottom lengths varying from 1 to 9 mm. The results show that the increase of length for the cone bottom leads to a decrease of cavitation intensity and area. The vapor volume fractions are 64% of L1 = 1 mm, 58% of L2 = 3 mm, 55% of L3 = 5 mm, 40% of L4 = 7 mm and 34% of L5 = 9 mm, respectively.
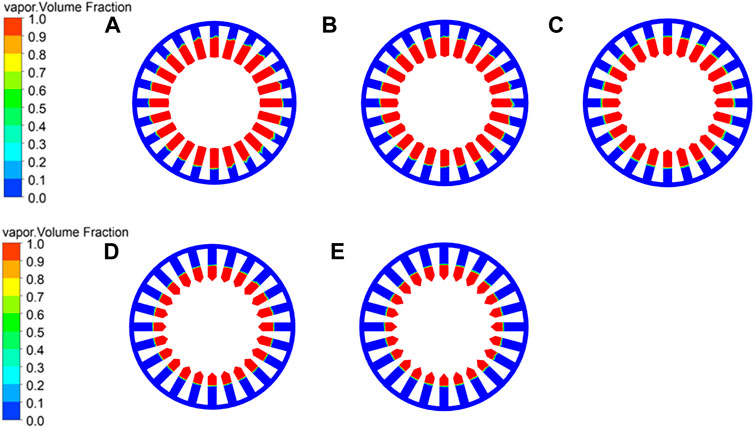
FIGURE 10. Vapor phase distribution with different cone bottom lengths: (A) L1 = 1 mm, (B) L2 = 3 mm, (C) L3 = 5 mm, (D) L4 = 7 mm, and (E) L5 = 9 mm.
Figure 11 shows the pressure and streamline in the hole. There are several vortexes in the hole close to the top and bottom, respectively. The vortex formation mechanism is that the water in hole interacts with the outer water and then induces the shear force near the hole outlet interface. For different cone bottom lengths, the vortex shape near the hole top is similar due to the similar shear force, while the vortex number and intensity are different near the hole bottom due to the different cone bottom length.
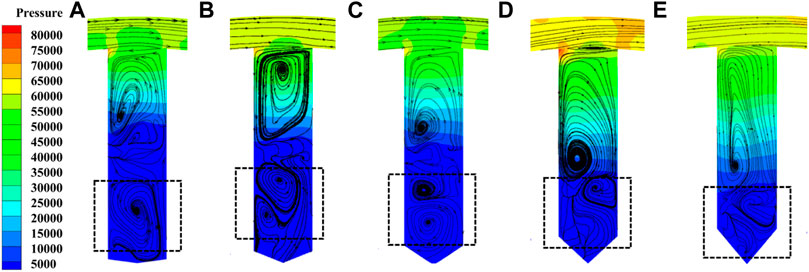
FIGURE 11. Streamline distribution in hole: (A) L1 = 1 mm, (B) L2 = 3 mm, (C) L3 = 5 mm, (D) L4 = 7 mm, and (E) L5 = 9 mm.
With the increase of the cone bottom length, the low-pressure region reduces, and the vortex intensity near the hole bottom also weakens. The vortex number varies under different cone bottom lengths, and the reason may be that the shear force, the centrifugal force and pressure gradient interact in the hole. Therefore, the cone bottom length mainly influences the pressure distribution and vortex near the hole bottom, which affects the cavitation intensity and area in the hole.
Therefore, based on the simulation calculation results of the RHCR in this study and the limitation of its structure, the optimal combination of structural parameters in this paper are selected as 17 mm hole diameter, 55 mm hole height and 1 mm cone bottom length under the experimental working conditions.
Spectrum Analysis of Pressure Fluctuation
Figure 12 shows monitoring points of pressure in the rotor, which are used to investigate the influence of hole diameter on the pressure fluctuation of cavitation reactor. Total 10 points are set in the rotor, and P1- P5 are set at the reactor bottom along the flow direction, and P6- P10 are set at the reactor top along the flow direction.
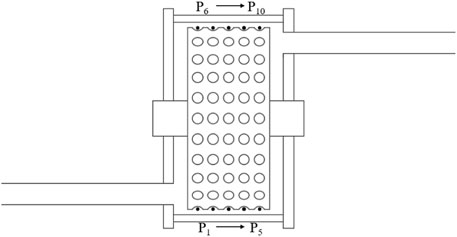
FIGURE 12. Monitoring points for pressure.
The total time for transient calculation is twenty rotor rotation cycles,and the pressure fluctuation data of the 8th to 16th cycle is taken to obtain the spectral characteristics of the pressure fluctuation by the method of Fast Fourier Transform.
Figure 13 shows the frequency domain of pressure fluctuation of points P1-P5 for different hole diameters in the RHCR. The dominant frequency of pressure fluctuation at each monitoring point is 24 fi, and fi = 20 Hz is the rotor frequency due to the rotor speed of 1,200 r/min. Generally, the amplitude of pressure fluctuation decreases for the harmonic frequency, and the amplitudes of pressure fluctuation at P1 and P2 monitoring points are stronger than that at P3, P4 and P5.
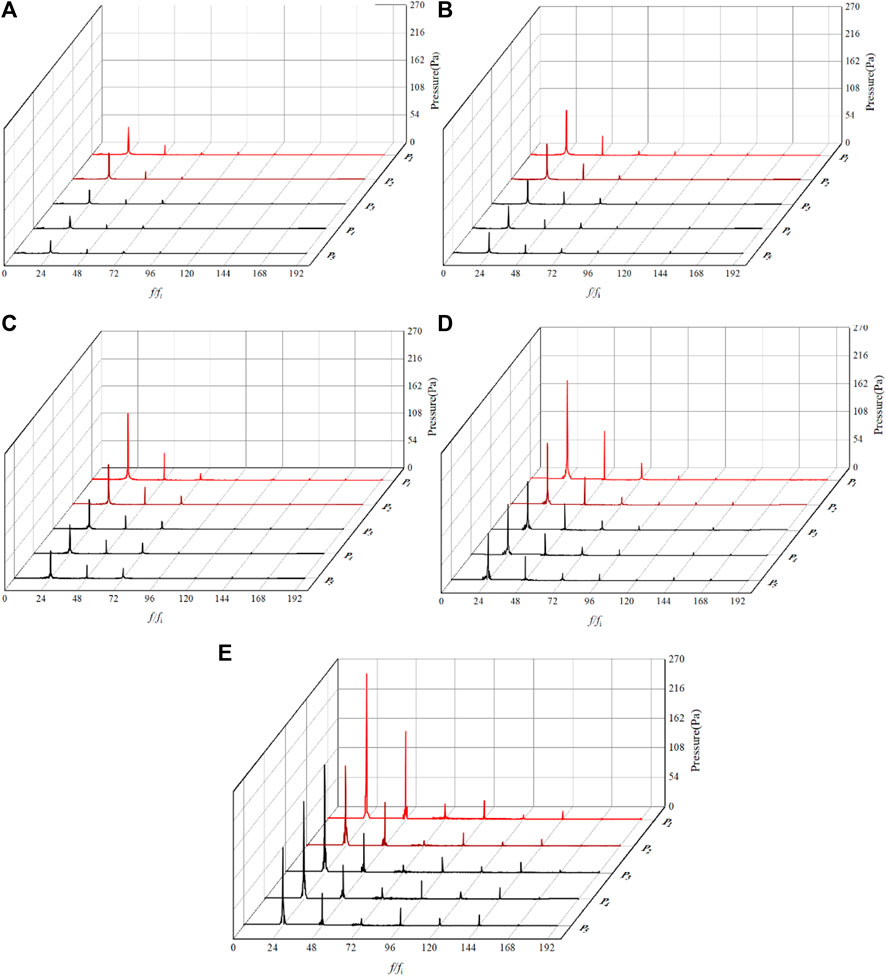
FIGURE 13. Pressure fluctuation spectrum of P1-P5 with different hole diameters: (A) D1 = 11 mm, (B) D2 = 13 mm, (C) D3 = 15 mm, (D) D4 = 17 mm, and (E) D5 = 19 mm.
Table 2 shows the maximum amplitude of pressure fluctuation points of P1-P5 for different hole diameters in the RHCR. The maximum pressure fluctuations of different hole diameters are all located at P1 close to the hole top, and the amplitudes are 54.1, 89.1, 132.1, 191.6, and 267.1 Pa, respectively. Along the direction of P1-P5, the pressure fluctuation amplitude presents a decreasing trend. From P3 to P5, the pressure fluctuation amplitude becomes stable, and the reason is that the flow impact is mainly induced at the reactor inlet near the P1 and P2.
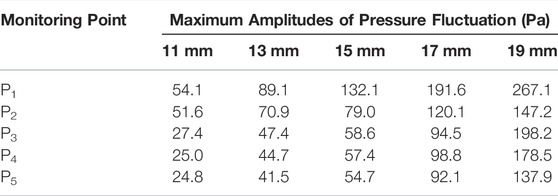
TABLE 2. Pressure pulsation at inlet side.
Figure 14 shows the pressure distribution in the RHCR. Due to the small gap between the inlet and the side wall of the rotor, the water impacts on the side wall of the rotor and form a high-pressure zone in region 1, which induces the strong pressure fluctuation amplitude near point 1. In addition, the relative motion between the rotor and the stable wall results in the rotor-stator interaction, which also induces the strong pressure fluctuation amplitude near point 1. Therefore, in order to reduce the pressure fluctuation amplitude, the distance between the rotor and reactor wall should be considered in the optimized design of the RHCR.
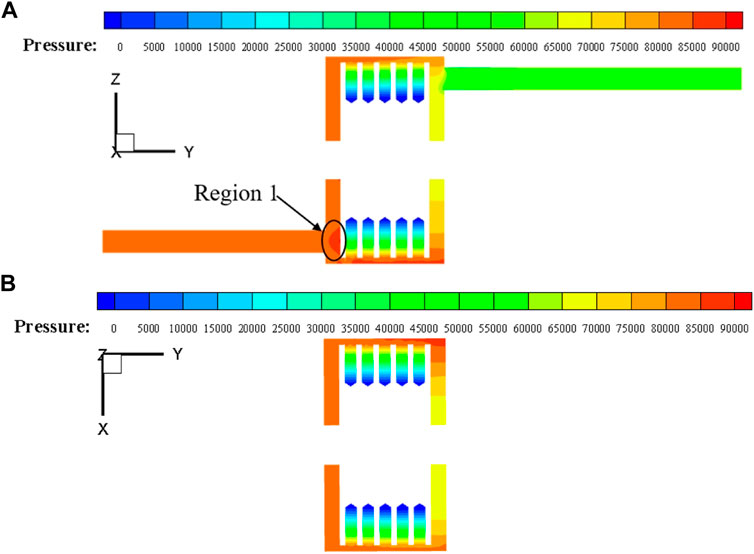
FIGURE 14. Pressure distribution in RHCR: (A) pressure distribution at YZ cross-section, and (B) pressure distribution at YX cross-section.
As shown in Figure 14 the pressure distribution on the outlet side of the RHCR in Figure 14A and the pressure distribution on both sides of the RHCR in Figure 14B are more stable compared to the inlet side, and there is no interference from the water flow hitting the rotor. Therefore, five monitoring points on the outlet side were selected to analyze the influence of inner hole diameter on the pressure fluctuation of RHCR.
Figure 15 shows the frequency domain of pressure fluctuation of points P6-P10 for different hole diameters in the RHCR. As shown in Figures 15A–E, the pressure fluctuation amplitudes of points P6-P10 are relatively uniform for different hole diameters, and the dominant frequency of pressure fluctuation at each monitoring point is 24 fi.
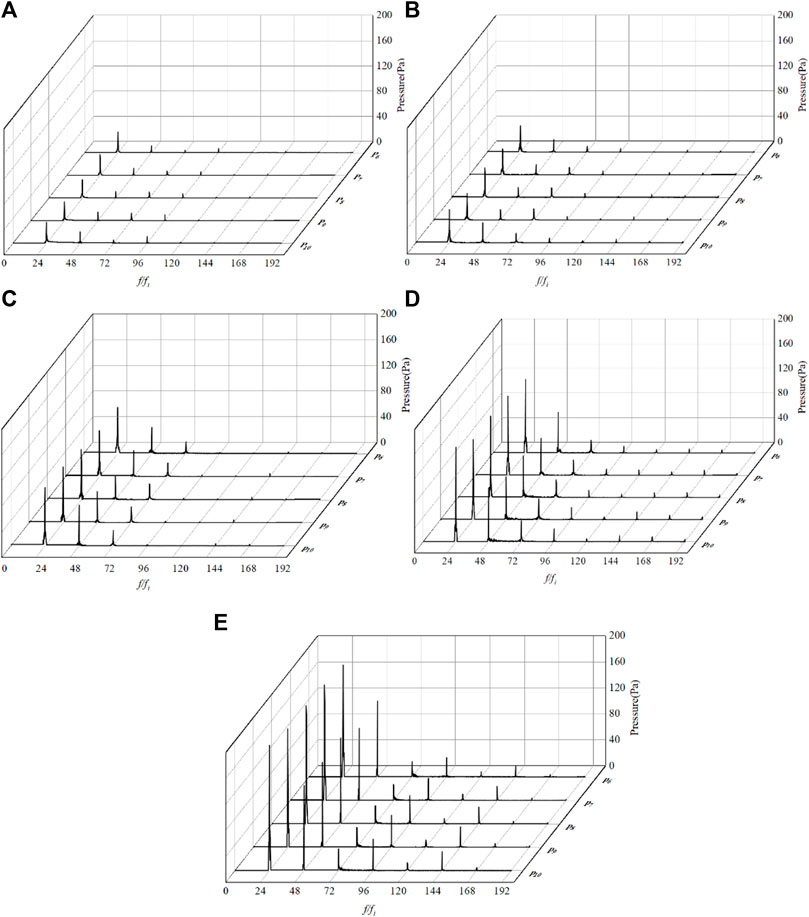
FIGURE 15. Pressure fluctuation spectrum of P6-P10 with different hole diameters: (A) D1 = 11 mm, (B) D2 = 13 mm, (C) D3 = 15 mm, (D) D4 = 17 mm, and (E) D5 =19 mm.
Figure 16 shows the frequency domain of pressure fluctuation at the same point of P8 for different hole diameters. With the increase of the hole diameter, the amplitude of pressure fluctuation obviously increases. When the diameter increases from 11 to 13 mm, the fluctuation amplitude increases about 1.65 times. When the diameter increases from 17 to 19 mm, the fluctuation amplitude increases by 1.37 times. The reason is that the larger hole diameter has stronger effect on the flow field, especially on the interface between hole top and main stream.
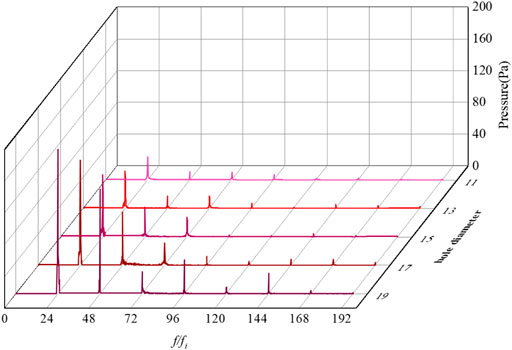
FIGURE 16. Pressure fluctuation spectrum of P8 with different hole diameters.
Conclusion
In the present work, a high-speed camera is used to observe the internal flow pattern in the RHCR, and the numerical simulation is used to calculate the three-dimensional cavitating turbulent flow. Effects of hole diameter, hole height and hole cone bottom length on performance of RHCR are comprehensively investigated, and the main conclusions are as follows:
1) The numerical simulation data agrees well with the experiment result, which validates that the numerical model and method are reliable and accurate.
2) The hole geometry of diameter, height and cone bottom length will influence the water-vapor exchange boundary, cavitation area and intensity, vortex number and intensity. The optimal structural parameters of the RHCR were taken as 17 mm hole diameter, 55 mm hole height and 1 mm cone bottom length.
3) The dominant frequent of pressure fluctuation in hole is 24 fi corresponding to the hole number along the circumferential direction, and the maximum amplitude appears near the hole top due to the small gap between the hole top and the side wall of the rotor.
Data Availability Statement
The original contributions presented in the study are included in the article/Supplementary Material, further inquiries can be directed to the corresponding authors.
Author Contributions
WZ, HF, and BL contributed to conception and design of the study. CX and WZ finished the experiment and numerical simulation. WZ performed the statistical analysis. CX wrote the first draft of the manuscript. WZ, HF, and BL wrote sections of the manuscript. All authors contributed to manuscript revision, read, and approved the submitted version.
Funding
This work was supported by the National Natural Science Foundation of China (51879140), the State Key Laboratory of Hydroscience and Engineering (2021-KY-04), Tsinghua-Foshan Innovation Special Fund (TFISF) 2021THFS0209, the Creative Seed Fund of Shanxi Research Institute for Clean Energy, Tsinghua University.
Conflict of Interest
The authors declare that the research was conducted in the absence of any commercial or financial relationships that could be construed as a potential conflict of interest.
Publisher’s Note
All claims expressed in this article are solely those of the authors and do not necessarily represent those of their affiliated organizations, or those of the publisher, the editors and the reviewers. Any product that may be evaluated in this article, or claim that may be made by its manufacturer, is not guaranteed or endorsed by the publisher.
References
Alves, P., Silva, P., Ferreira, D. C., and de Souza Inácio Gonçalves, J. C. (2019). COD Removal from Sucrose Solution Using Hydrodynamic Cavitation and Hydrogen Peroxide: a Comparison between Venturi Device and Orifice Plate. Rbrh 24. doi:10.1590/2318-0331.241920180147
Angele, K. (2021). Prediction of Cavitation in Orifice Plates-A Novel and Simple Rule-Of-Thumb. Exp. Comput. Multiph. Flow 3 (1), 68–76. doi:10.1007/s42757-020-0059-1
Badve, M., Gogate, P., Pandit, A., and Csoka, L. (2013). Hydrodynamic Cavitation as a Novel Approach for Wastewater Treatment in wood Finishing Industry. Separat. Purif. Techn. 106 (Complete), 15–21. doi:10.1016/j.seppur.2012.12.029
Bimestre, T. A., Júnior, J. A. M., Botura, C. A., Canettieri, E., and Tuna, C. E. (2020). Theoretical Modeling and Experimental Validation of Hydrodynamic Cavitation Reactor with a Venturi Tube for Sugarcane Bagasse Pretreatment. Bioresour. Techn. 311, 123540. doi:10.1016/j.biortech.2020.123540
Burzio, E., Bersani, F., Caridi, G. C. A., Vesipa, R., Ridolfi, L., and Manes, C. (2019). Water Disinfection by Orifice-Induced Hydrodynamic Cavitation. Ultrason. Sonochem. 60, 104740. doi:10.1016/j.ultsonch.2019.104740
Didenko, Y. T., McNamara, W. B., and Suslick, K. S. (1999b). Hot Spot Conditions during Cavitation in Water. J. Am. Chem. Soc. 121 (24), 5817–5818. doi:10.1021/ja9844635
Didenko, Y. T., McNamara, W. B., and Suslick, K. S. (1999a). Temperature of Multibubble Sonoluminescence in Water. J. Phys. Chem. A. 103 (50), 10783–10788. doi:10.1021/jp991524s
Flint, E. B., and Suslick, K. S. (1991). The Temperature of Cavitation. Science 253 (5026), 1397–1399. doi:10.1126/science.253.5026.1397
Gholami, A., Pourfayaz, F., and Maleki, A. (2020). Techno-economic Assessment of Biodiesel Production from Canola Oil through Ultrasonic Cavitation. Energ. Rep. 7, 266–277. doi:10.1016/j.egyr.2020.12.022
Gogate, P. R. (2007). Application of Cavitational Reactors for Water Disinfection: Current Status and Path Forward. J. Environ. Manage. 85 (4), 801–815. doi:10.1016/j.jenvman.2007.07.001
Gostisa, J., Širok, B., Repinc, S. K., Levstek, M., Stražar, M., Bizjan, B., et al. (2021). Performance Evaluation of a Novel Pilot-Scale Pinned Disc Rotating Generator of Hydrodynamic Cavitation. Ultrason. Sonochem. 72 (3), 105431. doi:10.1016/j.ultsonch.2020.105431
Hart, E. J., Fischer, C.-H., and Henglein, A. (1990). Sonolysis of Hydrocarbons in Aqueous Solution. Int. J. Radiat. Appl. Instrumentation. C. Radiat. Phys. Chem. 36 (4), 511–516. doi:10.1016/1359-0197(90)90198-q
Innocenzi, V., and Prisciandaro, M. (2021). Technical Feasibility of Biodiesel Production from virgin Oil and Waste Cooking Oil: Comparison between Traditional and Innovative Process Based on Hydrodynamic Cavitation. Waste Manage. 122, 15–25. doi:10.1016/j.wasman.2020.12.034
Kim, H., Sun, X., Koo, B., and Yoon, J. Y. (2019). Experimental Investigation of Sludge Treatment Using a Rotor-Stator Type Hydrodynamic Cavitation Reactor and an Ultrasonic Bath. Processes 7 (11), 790. doi:10.3390/pr7110790
Kosel, J., Šinkovec, A., and Dular, M. (2019). A Novel Rotation Generator of Hydrodynamic Cavitation for the Fibrillation of Long conifer Fibers in Paper Production. Ultrason. Sonochem. 59, 104721. doi:10.1016/j.ultsonch.2019.104721
Krasnikova, E. S., Morgunova, N. L., Krasnikov, A. V., Akchurin, S. V., and Akchurina, I. V. (2020). Physical and Chemical Effects of Ultrasonic Cavitation on the Grain of Meat when Lamb Salting. J. Phys. Conf. Ser. 1679, 022001. doi:10.1088/1742-6596/1679/2/022001
Kuldeep, V., and Kumar, S. (2016). Computational Study of Different Venturi and Orifice Type Hydrodynamic Cavitating Devices. J. Hydrodynamics 28 (02), 293–305. doi:10.1016/s1001-6058(16)60631-5
Kwon, W. C., and Yoon, J. Y. (2013). Experimental Study of a Cavitation Heat Generator. Proc. Inst. Mech. Eng. E: J. Process Mech. Eng. 227 (1), 67–73. doi:10.1177/0954408912451535
Liu, M., Tan, L., and Cao, S. (2019a). Cavitation-Vortex-Turbulence Interaction and One-Dimensional Model Prediction of Pressure for Hydrofoil ALE 15 by Large Eddy Simulation. J. Fluids Eng. 141 (2), 021103. doi:10.1115/1.4040502
Liu, M., Tan, L., and Cao, S. (2019b). Dynamic Mode Decomposition of Cavitating Flow Around ALE 15 Hydrofoil. Renew. Energ. 139, 214–227. doi:10.1016/j.renene.2019.02.055
Liu, M., Tan, L., Liu, Y., Xu, Y., and Cao, S. (2018). Large Eddy Simulation of Cavitation Vortex Interaction and Pressure Fluctuation Around Hydrofoil ALE 15. Ocean Eng. 163, 264–274. doi:10.1016/j.oceaneng.2018.06.005
Liu, S., Li, S., and Wu, Y. (2009). Pressure Fluctuation Prediction of a Model Kaplan Turbine by Unsteady Turbulent Flow Simulation. J. Fluids Eng. 131 (10), 101102. doi:10.1115/1.3184025
Milly, P. J., Toledo, R. T., Harrison, M. A., and Armstead, D. (2008). Inactivation of Food Spoilage Microorganisms by Hydrodynamic Cavitation to Achieve Pasteurization and Sterilization of Fluid Foods. J. Food Sci. 73 (2), VII. doi:10.1111/j.1750-3841.2008.00827.x
Patil, P. B., Raut-Jadhav, S., and Pandit, A. B. (2021). Effect of Intensifying Additives on the Degradation of Thiamethoxam Using Ultrasound Cavitation. Ultrason. Sonochem. 70, 105310. doi:10.1016/j.ultsonch.2020.105310
Pegu, K., and Arya, S. S. (2021). Comparative Assessment of HTST, Hydrodynamic Cavitation and Ultrasonication on Physico-Chemical Properties, Microstructure, Microbial and Enzyme Inactivation of Raw Milk. Innovative Food Sci. Emerging Tech. 69 (3), 102640. doi:10.1016/j.ifset.2021.102640
PetkovsEk, M., Zupanc, M., Dular, M., Kosjek, T., Heath, E., Kompare, B., et al. (2013). Rotation Generator of Hydrodynamic Cavitation for Water Treatment. Separat. Purif. Techn. 118 (Complete), 415–423. doi:10.1016/j.seppur.2013.07.029
Prasad, S. V., Thomas, S. A., and Vinayak, R. V. (2018). Modelling of Vortex Based Hydrodynamic Cavitation Reactors. Chem. Eng. J. 377, 119639. doi:10.1016/j.cej.2018.08.025
Qian, X., Wang, Y., Xu, Y., Ma, L., Xue, N., Jiang, Z., et al. (2020). Active Targeting Nano-Scale Bubbles Enhanced Ultrasound Cavitation Chemotherapy in Y1 Receptor-Overexpressed Breast Cancer. J. Mater. Chem. B 8 (31), 6837–6844. doi:10.1039/d0tb00556h
Rae, J., Ashokkumar, M., Eulaerts, O., von Sonntag, C., Reisse, J., and Grieser, F. (2005). Estimation of Ultrasound Induced Cavitation Bubble Temperatures in Aqueous Solutions. Ultrason. Sonochem. 12 (5), 325–329. doi:10.1016/j.ultsonch.2004.06.007
Šarc, A., Kosel, J., Stopar, D., Oder, M., and Dular, M. (2018). Removal of Bacteria Legionella pneumophila, Escherichia coli, and Bacillus Subtilis by (Super)cavitation. Ultrason. Sonochem. 42, 228–236. doi:10.1016/j.ultsonch.2017.11.004
Simpson, A., and Ranade, V. V. (2018). Modelling of Hydrodynamic Cavitation with Orifice: Influence of Different Orifice Designs. Chem. Eng. Res. Des. 136, 689–711. doi:10.1016/j.cherd.2018.06.014
Sun, W., and Lei, T. (2020). Cavitation-Vortex-Pressure Fluctuation Interaction in a Centrifugal Pump Using Bubble Rotation Modified Cavitation Model under Partial Load. J. Fluids Eng. 142, 051206. doi:10.1115/1.4045615
Sun, X., Jia, X., Liu, J., Wang, G., Zhao, S., Ji, L., et al. (2020b). Investigation on the Characteristics of an Advanced Rotational Hydrodynamic Cavitation Reactor for Water Treatment. Separat. Purif. Techn. 251, 117252. doi:10.1016/j.seppur.2020.117252
Sun, X., Kang, C. H., Park, J. J., Kim, H. S., Om, A. S., and Yoon, J. Y. (2018b). An Experimental Study on the thermal Performance of a Novel Hydrodynamic Cavitation Reactor. Exp. Therm. Fluid Sci. 99, 200–210. doi:10.1016/j.expthermflusci.2018.02.034
Sun, X., Liu, J., Ji, L., Wang, G., Zhao, S., Yoon, J. Y., et al. (2020a). A Review on Hydrodynamic Cavitation Disinfection: The Current State of Knowledge. Sci. Total Environ. 737, 139606. doi:10.1016/j.scitotenv.2020.139606
Sun, X., Park, J. J., Kim, H. S., Lee, S. H., Seong, S. J., Om, A. S., et al. (2018a). Experimental Investigation of the Thermal and Disinfection Performances of a Novel Hydrodynamic Cavitation Reactor. Ultrason. Sonochem. 49, 13–23. doi:10.1016/j.ultsonch.2018.02.039
Sun, X., Wang, Z., Xuan, X., Ji, L., Li, X., Tao, Y., et al. (2021b). Disinfection Characteristics of an Advanced Rotational Hydrodynamic Cavitation Reactor in Pilot Scale. Ultrason. Sonochem. 73 (3), 105543. doi:10.1016/j.ultsonch.2021.105543
Sun, X., Xuan, X., Song, Y., Jia, X., Ji, L., Zhao, S., et al. (2021a). Experimental and Numerical Studies on the Cavitation in an Advanced Rotational Hydrodynamic Cavitation Reactor for Water Treatment. Ultrason. Sonochem. 70, 105311. doi:10.1016/j.ultsonch.2020.105311
Thaiyasuit, P., Khiowthong, W., and Seehanam, W. (2021). Investigation on Continuous FAME Production Using Rotor Reactor with Bumpy Number Variation under Theoretical Methanol to Oil Molar Ratio Condition. IOP Conf. Ser. Mater. Sci. Eng. 1137 (1), 012007. (10pp). doi:10.1088/1757-899x/1137/1/012007
Wang, B., Su, H., and Zhang, B. (2021). Hydrodynamic Cavitation as a Promising Route for Wastewater Treatment - A Review. Chem. Eng. J. 412 (3-4), 128685. doi:10.1016/j.cej.2021.128685
Yasuda, K., and Ako, D. (2019). Effect of Venturi Tube Shape on Reaction Performance by Hydrodynamic Cavitation. J. Chem. Eng. Jpn./JCEJ 52 (3), 280–282. doi:10.1252/jcej.18we183
Zhao, J., Jiang, Z., Zhu, J., Zhang, J., and Li, Y. (2020). Investigation on Ultrasonic Cavitation Erosion Behaviors of Al and Al-5Ti Alloys in the Distilled Water. Metals 10 (12), 1631. doi:10.3390/met10121631
Keywords: hydrodynamic cavitation reactor, hole geometry, numerical simulation, vortex, pressure fluctuation
Citation: Zhang W, Xie C, Fan H and Liu B (2022) Influence of Hole Geometry on Performance of a Rotational Hydrodynamic Cavitation Reactor. Front. Energy Res. 10:881811. doi: 10.3389/fenrg.2022.881811
Received: 23 February 2022; Accepted: 08 March 2022;
Published: 09 May 2022.
Edited by:
Ling Zhou, Jiangsu University, ChinaReviewed by:
Changchang Wang, Beijing Institute of Technology, ChinaYuchuan Wang, Northwest A&F University, China
Copyright © 2022 Zhang, Xie, Fan and Liu. This is an open-access article distributed under the terms of the Creative Commons Attribution License (CC BY). The use, distribution or reproduction in other forums is permitted, provided the original author(s) and the copyright owner(s) are credited and that the original publication in this journal is cited, in accordance with accepted academic practice. No use, distribution or reproduction is permitted which does not comply with these terms.
*Correspondence: Honggang Fan, ZmFuaG9uZ2dhbmdAdHNpbmdodWEub3JnLmNu; Bing Liu, bWV0cmNAc2R1c3QuZWR1LmNu