 Hao Chang
 Shiming Hong1
 Guangjie Peng
95% of researchers rate our articles as excellent or good
Learn more about the work of our research integrity team to safeguard the quality of each article we publish.
Find out more
ORIGINAL RESEARCH article
Front. Energy Res. , 28 April 2022
Sec. Process and Energy Systems Engineering
Volume 10 - 2022 | https://doi.org/10.3389/fenrg.2022.880338
This article is part of the Research Topic Design, Simulation and Optimization of Hydraulic Machinery View all 25 articles
Self-priming pumps, as important two-phase fluid machinery, are widely used in disaster relief and emergency fields. The flow characteristics of the air–liquid two-phase fluid play an essential role in the self-priming pump performance. However, the traditional simulation employed the single-diameter bubbles for analysis, which cannot reflect the internal flow field characteristics. Therefore, in this article, the Population Balance Model (PBM) is employed, which divides the bubble into different diameter groups, and the collision and coalescence between the bubble are considered in the calculation to investigate the influence of different air voids and flow conditions on the performance self-priming centrifugal pumps. The result shows that the frequency of bubble coalescence at the shroud is higher, which is conducive to the formation of large-sized bubbles. Meanwhile, the increment of flow conditions has a significant effect on reducing the pressure pulsation of the gas–liquid two-phase flow, while the improvement of the air voids not only destroys the instability and asymmetry of the internal flow of the two-phase flow but also aggravates the amplitude of pressure pulsation, increasing the surface loading of the blade and radial force. Therefore, this article can provide a certain theoretical reference for the study of air–liquid two-phase flow characteristics of self-priming centrifugal pumps.
Self-priming pump plays an essential role in disaster relief and emergency fields, and many scholars pay attention to the flow characteristic of the air–liquid two-phase flow of the self-priming pump. Wang et al. (2019a) and Wang et al. (2019b) simulated the air–liquid two-phase basis of the four-stage self-priming pump and found that the self-priming procession consisted of three parts, and the middle self-priming part has an important effect on the self-priming performance. Qian et al. (2020) and Qian et al. (2021) employed the Euler–Euler multiphase model and SST k-omega turbulence model to investigate the two-phase flow patterns of the self-priming process. The results present the air–liquid mixing and separation regulation, and the experiments are carried out to improve the accuracy of the analysis. Huang et al. (2014) studied the transient gas–liquid flow of the start-up stage based on a vertical self-priming pump, and the self-priming time and performance can be predicted by numerical calculations. Zhou et al. (2019) analyzed the influence of reflux holes on the transient flow characteristics of the self-priming sewage centrifugal pump, and the unsymmetrical vortex flow structures are found in the flow field, which aggravates the pressure fluctuation amplitude. Zhang et al. (2021) compared the rapid and slow starting periods of the self-priming pump by experiment, and the similarities and differences between the different start methods were investigated in detail. Chang et al. (2020) and Chang et al. (2021) combined the orthogonal design and grey-correlational method to analyze the influence of geometrical parameters of self-priming equipment on the self-priming performance, and the effect law of the self-priming time is obtained.
Zhang et al. (2016) conducted the visualization experiment based on a three-stage pump with gas and water as the medium and found that the inlet part of the impeller is a bubbly flow, and the average bubble diameter increases with the increase in gas content but decreases with the increase in speed. Ganat et al. (2015) proposed a novel flow calculation method to improve the error caused by the previous measurement based on the traditional method of measuring gas flow. Barrios and Prado (2011) found that the bubble behavior is related to the sudden drop of the head, which is accompanied by the cavitation at the inlet of the pump based on the visual experiment. Yonggang et al. (2019) studied the flow mechanism of the reactor system cooling pump in a gas–liquid two-phase mixed operation state and used the CFX numerical calculation method to analyze the internal gas–liquid distribution of the reactor cooling pump under the four flow conditions with different gas content. Murakami and Minemura (1974) studied the effect of the number of impeller blades on the performance of centrifugal pumps under the aeration conditions and found that the hydraulic loss caused by the bubble flow resistance reduces the total head. Monte Verde et al. (2017) studied the gas–liquid two-phase flow in an electric pump through high-speed photography, and the results show that the appearance of cavitation was the cause of the deterioration of the pump performance. Müller et al. (2015) analyzed the gas–liquid flow characteristics in the centrifugal pump based on the Euler–Euler two-fluid model. Meanwhile, the bubbles and water are regarded as incompressible media, and the interphase force only considers the drag force calculated by the Schiller–Norman model throughout the simulation process. Wu et al. (2017) proposed to use the high-pressure gas generated in the system evaporator to drive a multi-stage gas–liquid booster instead of an electrical working fluid pump which can improve the performance of the organic Rankine cycle system. Zhang et al. (2017) conducted an experimental study on the internal flow characteristics of the side-channel pump under the gas–liquid two-phase flow conditions and analyzed the influence of the blade suction angle on the head and efficiency under different inlet air volume fractions. Musakaev and Borodin (2016) established a two-phase flow model based on a centrifugal pump located in a permafrost zone, which is used to predict the flow field parameters of the two-phase flow inside the centrifugal pump, and added the influence of temperature on the gas–liquid two-phase flow.
Although the researchers have carried out a lot of research on the air–liquid two-phase flow in the centrifugal pumps, the air–liquid two-phase flow simulations were conducted based on the single-diameter bubbles for the analysis. However, in actual operation, due to the interaction between the bubbles and the internal flow field, the collision and coalescence of the bubble are generated, namely, the small bubbles will collide to form large bubbles, and the large bubbles will break into the small bubbles. Therefore, there is a certain deviation in the simulation of the air–liquid two-phase flow with a single-diameter bubble. In this article, the Population Balance Model (PBM) was employed, which divides the bubble into different diameter groups, and the collision and coalescence of the bubble are considered in the calculation to investigate the influence of different air voids and flow conditions on the performance self-priming centrifugal pumps under the part-load flow conditions, which provides a certain theoretical reference for the study of the air–liquid two-phase flow characteristics of the self-priming centrifugal pumps.
In this article, the SST k-ω turbulence model is used for the transient numerical calculation, and the total calculation time is 0.2 s. The numerical analysis medium uses 25°C clear water and air as the two-phase flow. By adopting the Euler–Euler model to load the group balance model, the internal flow characteristics of different air voids under the part-load flow conditions are analyzed. The calculation of the self-priming pump consists of five parts: inlet pipe, outlet pipe, self-priming chamber, impeller, and volute. In order to reduce the influence of the inlet and outlet pipe on the analysis results, the inlet and outlet pipe are extended 5 times of the impeller inlet diameter, and the calculation model is shown in Figure 1.
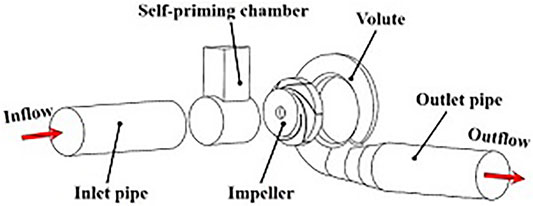
FIGURE 1. The calculation model of the self-priming pump.
In order to decrease the investigation period, the structured grids are applied on the calculation models by ANSYS ICEM, the grids of the blade leading edge and volute tongue is conducted as a local encryption part. Meanwhile, the optimal flow condition is 500 m3/h, the rotation speed is 2,200 r/m, and the design head is 45 m. Considering the influence of the grid number on the self-priming pump performance, the grid sensitive analysis is conducted. Grid numbers of 5.3×10⁶, 4.5×10⁶, 3.4×10⁶, 2.6×10⁶, 1.9×10⁶, and 1.2×10⁶ are selected. It is found that the deviation of the hydraulic performance is less than 1% when the grid number reaches 2×10⁶, and the investigation results are shown in Figure 2. In addition, to ensure the analysis accuracy, the hydraulic experiments are carried out to validate the calculation result, as shown in Figure 3. The result presents that the deviation between the experiment and calculation is below 3%, which are the results from the volumetric loss without considering the numerical calculation. Thus, the calculation method is reliable for further investigation.
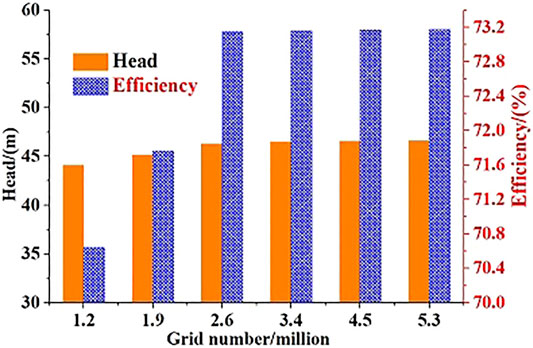
FIGURE 2. Grid sensitive analysis.
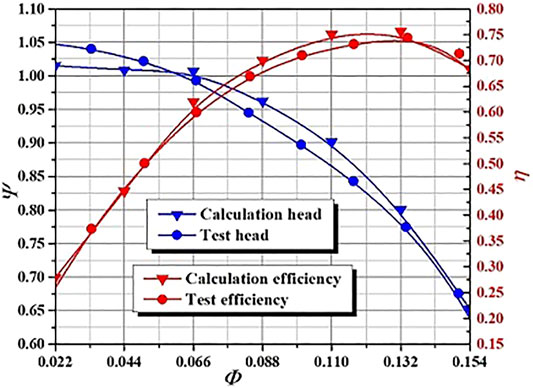
FIGURE 3. Investigation of the calculation and experiment.
Meanwhile, four schemes under the part-load flow conditions are proposed, as shown in Table 1. According to the previous analysis, the bubbles size distribution is divided into 10 groups. The bubble groups and sizes are shown in Table 2. In the calculation process, the drag force and the virtual mass force are added as the interphase force, and the Schiller–Naumann model is set as the drag coefficient. At the same time, the breakage and coalescence between the bubbles are considered, and the Luo–Svendsen coalescence and breakage models are added in the calculation.
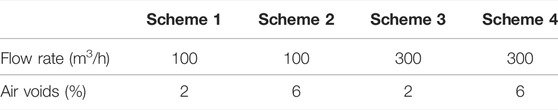
TABLE 1. Selection of schemes.

TABLE 2. Groups of different bubble sizes.
In this article, the group balance model is applied to analyze the influence of air voids and flow conditions on the internal flow characteristics. Figure 4 presents the distribution of 10 different sized bubbles on the circumferential surface of the rear cover (Span 0). Figure 4A shows the distribution of the bubbles with the 1 mm diameter. It can be seen that the bubble distribution of each scheme has obvious similarities. Meanwhile, a small number of bubbles with 1 mm were found on the leading edge of the blades in scheme 1. However, by increasing the air voids under the same flow condition, the strength and area of the bubble distribution are slightly increased in scheme 2. When the flow conditions improve to 300 m3/h, it can be found that a small amount of 1 mm bubbles are generated at the leading edge in scheme 3. Although the distribution area is smaller than that in scheme 2, the strength is significantly enhanced. At the same time, it can be found that the 1 mm bubbles are also generated in the impeller flow passages, but the area is significantly smaller than the leading edge of the blade. By further increasing the air voids based on scheme 3, each impeller flow channel of scheme 4 is distributed with the first size group of the bubbles, and the distribution area is significantly larger than scheme 3.
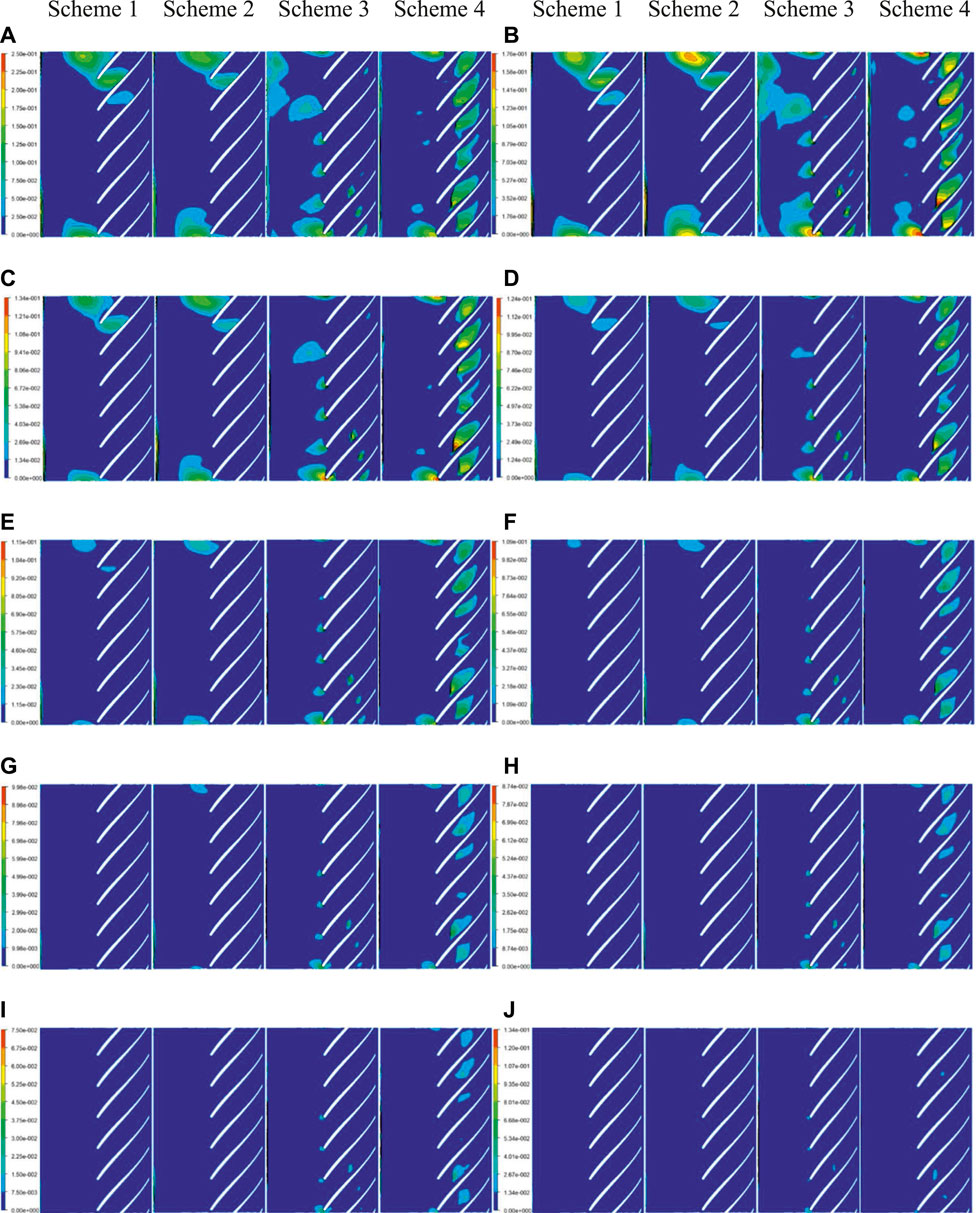
FIGURE 4. Distribution of different sizes bubbles on the Span 0. (A) The distribution of 1 mm bubbles. (B) The distribution of 2 mm bubbles. (C) The distribution of 3 mm bubbles. (D) The distribution of 4 mm bubbles. (E) The distribution of 5 mm bubbles. (F) The distribution of 6 mm bubbles. (G) The distribution of 5 mm bubbles. (H) The distribution of 6 mm bubbles. (I) The distribution of 5 mm bubbles. (J) The distribution of 6 mm bubbles.
As shown in Figure 4B, the distribution of the bubbles with 2 mm on Span 0 has a similar variation trend with the 1 mm bubbles, but the area and intensity are significantly enhanced. Compared with the other three schemes, the distribution area of 2 mm bubbles in scheme 1 is the smallest. When the air voids are increased from 3 to 6%, the bubble distribution near the leading edge of the blade is significantly increased. The main reason for this phenomenon is that the improvement of air voids aggravates the collision frequency between the small-sized bubbles and the coalescence ability of the bubble groups improves continuously. When the flow rate reaches 300 m3/h and the air voids are 3%, it is found that the bubbles are generated at the leading edge of the blade and the impeller flow channel. Subsequently, by increasing the air voids to 6%, the distribution of the 2 mm bubbles at the leading edge of the blade and the impeller flow channel is further enhanced. Therefore, by comparing the distribution of the first two groups of size bubbles, it can be found that the bubble distribution shows an increasing trend as the bubble size improves. However, in Figure 4C, the distribution area and the intensity of the 3 mm bubbles are slightly reduced compared to the 2 mm bubbles. When the size bubbles improve from 3 to 10 mm, the corresponding size bubble distribution is continuously reduced. As the bubble size increases to 7 mm, no bubble can be found in scheme 1. Meanwhile, when the bubble size increases to 10 mm, only a small amount of the 10 mm bubbles is generated in scheme 4. Therefore, it can be found that as the bubble size increases from 3 to 10 mm, the coalescence ability of the bubbles of the corresponding size is continuously weakened.
However, the overall variation of the bubble distribution on the rear cover (Span 1) is relatively small. Figure 5A presents the distribution of the bubbles with 1 mm. It can be seen from the figure that only a small number of bubbles were generated on the trailing edge of the blade in scheme 4. By comparing the 2 mm bubble distribution diagrams, it can be found that there are a few bubbles generated in schemes 1 and 2. Figures 5C–J present the distributions from the 3 mm to the 10 mm bubbles. Through comparison, it is found that the distribution of the last eight groups of bubbles shows the same variation trend. There are no large-sized bubbles generated in schemes 1 and 2, but a small number of the large-sized bubbles are generated in scheme 3, and the bubble distribution on the pressure surface of scheme 4 is larger than the other schemes, and the bubble distribution between the adjacent blades is quite different. Furthermore, a large number of bubbles are formed on the trailing edge of the pressure surface near the tongue. As the position of the blade gradually moves away from the tongue, the distribution area gradually decreases. This is mainly due to the continuous collision of the bubbles in the flow field at the shroud, which leads to the generation and gathering of the large-sized bubbles. Therefore, by comparing the bubbles distribution on the shroud and rear cover, it can be found that more large-sized bubbles are formed on the shroud, while the small-size bubbles are generated on the rear cover. The main reason for this phenomenon is that the trailing edge vortex is formed at the outlet of the impeller when the self-priming centrifugal pump operates the under part-load flow conditions. According to the previous analysis (Chang et al., 2019), it can be seen that the vortex is mainly formed near the rear cover, thus the violent collision of the bubble group is formed near the rear cover, which results in the coalescence of the large-sized bubbles. In contrast, the frequency of the bubble coalescence at the shroud is higher, which is conducive to the formation of the large-sized bubbles.
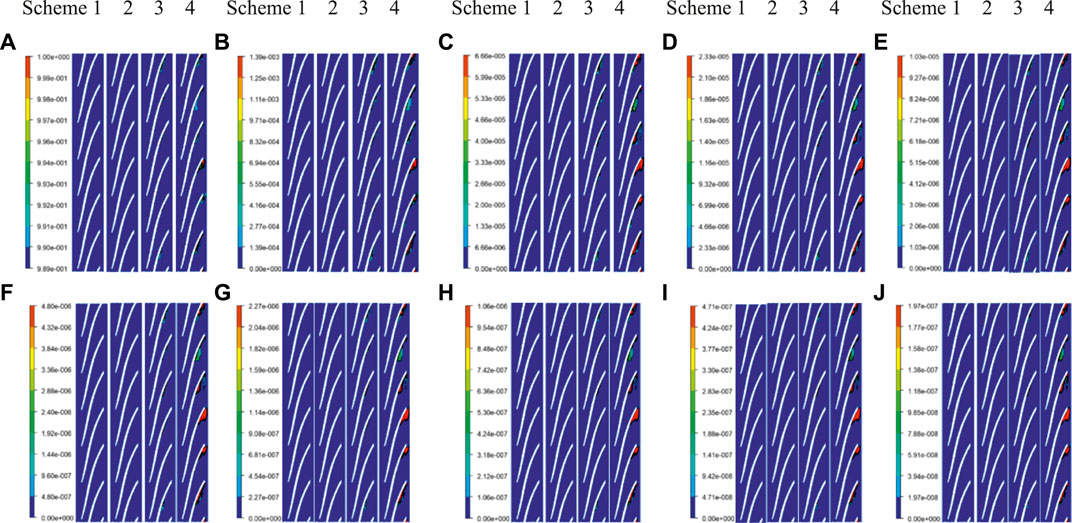
FIGURE 5. Distribution of different sizes bubbles on the Span 1. (A) 1 mm bubbles. (B) 2 mm bubbles. (C) 3 mm bubbles. (D) 4 mm bubbles. (E) 5 mm bubbles. (F) 6 mm bubbles. (G) 7 mm bubbles. (H) 8 mm bubbles. (I) 9 mm bubbles. (J) 10 mm bubbles.
In order to ensure the smooth operation of the self-priming pump under the air–liquid two-phase flow conditions, the pressure pulsation characteristics under the different air voids and flow conditions were analyzed in this section. Considering the wrap angle of the impeller to be 60°, the pressure pulsation monitoring points are set on Span 0, Span 0.5, and Span 1 circumference surface every 10°, namely, the monitoring points C1, C2, C3, C4, and C5 on the circumference of Span 0, the monitoring points B1, B2, B3, B4, and B5 on the circumference of Span 0.5, and the monitoring points A1, A2, A3, A4, and A5 on the circumference of Span 1, as shown in Figure 6.
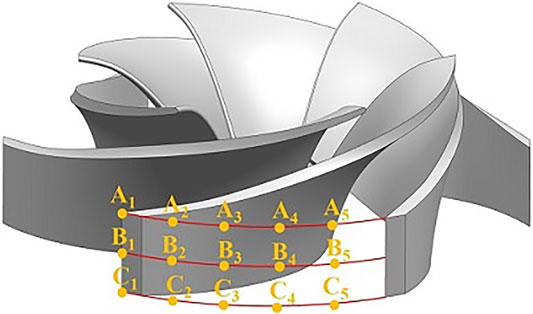
FIGURE 6. The location diagram of the pressure monitoring points.
Considering the accuracy of the investigation, the data of pressure pulsation are expressed by the dimensionless format, and only the pressure pulsation of the last rotation period is employed. The dimensionless pressure fluctuation data can be obtained by formula (1). At the same time, the density is the mixed density of the air–liquid two-phase flow. For the density of different air voids, the density can be calculated by formula (2) and 3, respectively.
where,
Figure 7 shows the distribution of pressure pulsation at the impeller outlet, it found that the pressure pulsation under the air–liquid two-phase flow is more complicated. There are multiple secondary peaks within a rotation period, and the pressure pulsation amplitude of each monitoring point is quite different. At the same time, due to the position difference of the monitoring points, the phase difference of the pressure pulsation peaks is generated at each point, and the No. 5 monitoring points sweep the tongue firstly. Therefore, the earliest pressure pulsation peak appeared at the monitoring point 5, and the pressure pulsation peaks of the monitoring points 4, 3, 2, and 1 are lagging behind point 5, respectively. However, the multiple peaks of pressure pulsation are found on the different monitoring points. This phenomenon is attributed to the violent collision of bubbles in the air–liquid two-phase flow, which results in the continuous breakage of large bubbles and the coalescence of small bubbles, the internal flow field is relatively turbulent, thus the multiple peaks of pressure pulsation are generated at each monitoring point.
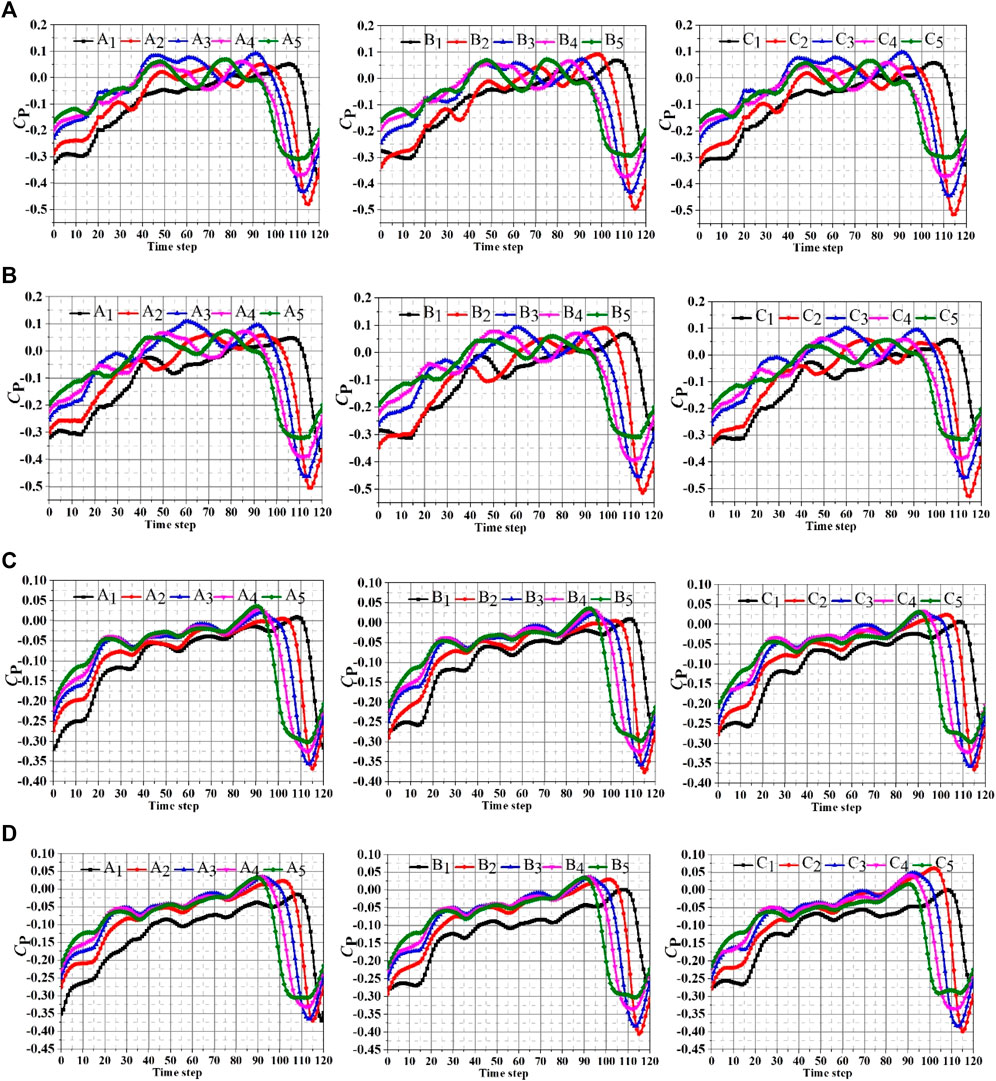
FIGURE 7. The pressure fluctuations distribution of different schemes. (A) The pressure pulsation distribution of scheme 1. (B) The pressure pulsation distribution of scheme 2. (C) The pressure pulsation distribution of scheme 3. (D) The pressure pulsation distribution of scheme 4.
As shown in Figure 7, the pressure pulsation amplitude increased continuously when the monitoring points moved from the shroud to the rear cover in scheme 1. The negative amplitude of pressure pulsation of each monitoring point is greater than the positive amplitude. While the positive amplitude difference of the monitoring points on the same circumferential surface is slightly different, the negative amplitude is quite different. Among them, the order of the magnitude of the negative amplitude of each monitoring point is 2 > 3> 4 > 5> 1, namely, the negative amplitude of position 2 is the largest. As the air voids increase to 6%, it can be found that the negative amplitude of the pressure pulsation at each monitoring point in scheme 2 is still greater than the positive amplitude, and the magnitude of the negative amplitude is significantly improved compared to scheme 1. Meanwhile, the pulsation amplitude of the monitoring points on the rear cover is also greater than the pressure pulsation amplitude on the shroud. Furthermore, by comparing the monitoring points on the same circumferential surface, it can be found that the order of the negative amplitudes of the monitoring points remain unchanged. When the flow conditions are further increased, it can be found that the pressure pulsation amplitude of scheme 3 is significantly reduced, which is consistent with the internal flow law of the clear water state. The speed of the fluid flowing out of the impeller continues to increase, which collides with the fluid in the volute. Due to the large difference in speed and direction of the fluid between the impeller and volute, a large impact loss and severe pressure pulsation are formed. With the increase of the flow conditions, the speed difference between the impeller and the volute continues to decrease, the unstable characteristics of the internal flow field are effectively improved, and the pressure fluctuation waveforms at each monitoring point tend to be consistent. At the same time, when the flow rate reaches 300 m3/h, and the air voids are increased from 2 to 6%, it can be found that the pressure pulsation amplitude of each monitoring point in scheme 4 has a significant increase. More importantly, the amplitude of the monitoring points on the rear cover is still greater than that of the shroud, which results from the increase of the air voids enhancing the frequency of collisions between the bubbles in the two-phase flow and aggravating the instability of the internal flow. The breakage and coalescence of the bubbles at the rear cover are more significant, thus making the pressure fluctuations more severe. Therefore, in this section, the pressure pulsation characteristic of the air–liquid two-phase flow is analyzed by increasing the flow condition and the air voids. It can be found that the two methods have opposite mechanisms of pressure pulsation. The increase in flow conditions has a significant effect on reducing the pressure pulsation of the gas–liquid two-phase flow, and the improvement of the air voids not only destroys the stability of the internal flow of the two-phase flow but also aggravates the amplitude of pressure pulsation.
Figure 8 presents the blade surface loading distribution on the two circumferential surfaces of the shroud and the rear cover. It can be found that the surface loading of the blade is mainly composed of the two upper and lower curves, and the difference between the two curves presents the surface loading of the blade. By comparing the blade surface loading of the four schemes, it can be found that the pressure on the pressure surface and the suction surface presents the increment trend from the leading edge to the trailing edge, and there are three zero-load points that are generated on the blade, namely. The pressure on the pressure surface and suction surface has the same value.
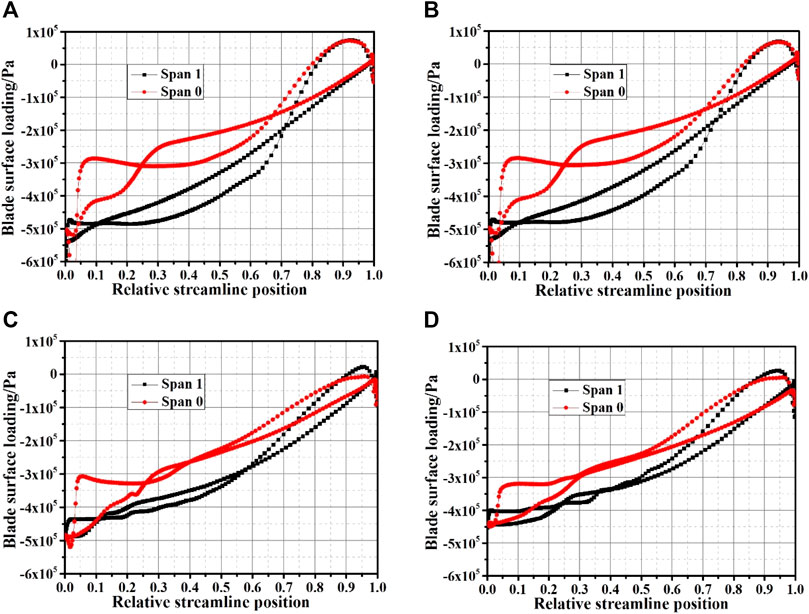
FIGURE 8. The blade loading with different schemes. (A) Scheme 1. (B) Scheme 2. (C) Scheme 3. (D) Scheme 4.
The pressure curve on the pressure surface of the blade first drops sharply near the leading edge and then rises at a constant speed to intersect with the pressure curve of the suction surface, that is, there is a point where the pressure on the pressure surface of the blade is equal to the suction surface of the blade, and the first zero load point is generated at the blade relative streamline position of 0.25. This phenomenon is attributed to the collision between the leading edge of the blade and the incoming flow of the inlet pipe, the sudden changes of the liquid speed direction under the action of the blade, which results in the pressure on the pressure surface and the suction surface changes sharply. At the same time, when the relative streamline position passes through the first zero load point, the pressure on the pressure and suction surface still maintains the upward trend, but the pressure growth rate on the suction surface continues to increase and gradually exceeds the growth rate of the pressure surface. At this time, due to the continuous collision of large bubbles and the coalescence of small bubbles, the pressure on the pressure and suction surface of the blade improves progressively. When the pressure caused by the collision and coalescence of the bubble on the suction and pressure surface keep the same value, the second zero load point is formed. In addition, the formation of the third zero-load point is mainly due to the influence of the stator–rotor interaction between the tongue and blade. By comparing the blade surface loading distribution of different schemes, it can be found that due to the violent collision of bubbles at the rear cover, the pressure on the pressure surface and suction is significantly larger than that at the shroud. The surface loading of the rear cover is larger than the shroud. After increasing the air voids based on scheme 1, the blade surface loading increased slightly. However, as the flow rate increases, the blade surface loading decreases effectively. By comparing scheme 3 and scheme 4, the result shows that the blade surface loading has also been improved. Therefore, the effect of air voids and flow rate on the blade surface loading is obtained, two factors have opposite effects on the blade loading. The increment of the flow rates improves the internal flow law and greatly reduces the surface load of the blade, while the improvement of the air voids enhances the collision between the bubbles, which aggravates the instability in the flow field, and increases the surface loading of the blade.
The pump with a spiral volute will lead to the radial force on the impeller during operation, which will cause the shaft to be subjected to alternating stress, resulting in a directional disturbance and affecting the service life of the pump. This phenomenon is attributed to the asymmetry structure of spiral volute is design basis of optimal flow condition, the velocity, and pressure of the liquid in the volute around the impeller are uniform and axisymmetric, without force is pushed on the impeller at the radial direction. However, the break of the radial pressure balance under the nonoptimal flow rates results in the generation of the radial force. In order to ensure the precision of the radial force analysis, we perform a dimensionless processing on the radial force to obtain the radial force coefficient CF. The calculation formula is
At this time, the density is the mixed density of the air–liquid two-phase flow. Therefore, the density of different air voids can be solved by Eqs 2, 3 separately.
Figure 9 shows the radial force polar coordinate distribution of different schemes. It can be seen from the figure that the direction and magnitude of the radial force upon the impeller during the rotation process are always changing. Meanwhile, each group of schemes has the similar transformation law, and there is a consistent waveform in each rotation cycle. With the rotation of the impeller, six wave peaks and six wave troughs can be found in the radial force distribution of each scheme, which is equal to the number of impeller blades, and the wave peaks and troughs have the same angle under the different flow conditions. However, by comparing the four schemes, it can be found that the radial force amplitude of scheme 1 and scheme 2 is large, and the obvious eccentricity is generated. With the increase in flow conditions, the radial force amplitude of scheme 3 and scheme 4 decreases significantly. At the same time, the eccentricity phenomenon is effectively improved. The main reason for this phenomenon is that the velocity in the flow field of the volute is inconsistent with the velocity and direction at the outlet of the impeller, and an obvious collision is created, which results in an uneven distribution of the velocity at the exit of the impeller. The velocity in each flow passage of the impeller is relatively turbulent, which results in a larger radial force amplitude. At the same time, according to the internal flow field analysis, it can be seen that there are continuous bubble collisions in the impeller, a lot of large bubbles are generated, and these bubbles are not evenly distributed in each impeller flow channel, which promotes the formation of local blockages in the individual flow channels. Furthermore, the flow direction in the flow field is changed, which intensifies the asymmetry of the velocity at the impeller outlet. Therefore, the eccentricity of the radial force distribution in schemes 1 and 2 is generated. Moreover, due to the air voids continuously improving from scheme 1 to scheme 2, the collision frequency of the bubbles in the flow field is increased, which leads to the eccentricity phenomenon being more obvious. With the increase of the flow conditions, the velocity difference between the volute and the impeller in the flow field gradually decreases, and the internal flow field becomes smoother. Hence, the radial force amplitude is significantly reduced, and the eccentricity phenomenon is effectively improved.
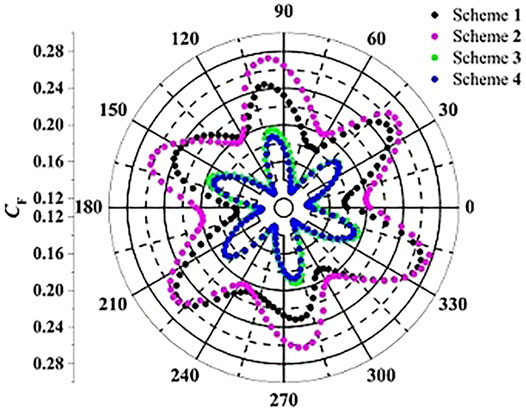
FIGURE 9. Radial force distribution of each scheme.
Therefore, the influence of the flow conditions and the air voids on the radial force of the impeller was investigated in this section. It can be found that the increase in the flow condition effectively improves the internal flow law and greatly reduces the radial force of the impeller. While the increment of air voids enhances the collision between the bubbles, aggravating the asymmetry in the flow field intensifies the eccentricity of the radial force.
(1) By comparing the bubble distribution on the shroud and rear cover, it can be found that larger-sized bubbles are formed on the shroud, while the smaller-sized bubbles are generated on the rear cover. Because of this, the trailing edge vortex is formed at the outlet of the impeller when the self-priming centrifugal pump operates under the part-load flow conditions. The vortex is mainly formed near the rear cover; thus, the violent collision of the bubble group is formed near the rear cover, which results in the difficulty in coalescence of the large-sized bubbles. In contrast, the frequency of the bubble coalescence at the shroud is higher, which is conducive to the formation of the large-sized bubbles.
(2) The pressure pulsation characteristic of the air–liquid two-phase flow is analyzed by increasing the flow condition and the air voids. It can be found that the two methods have opposite mechanisms of pressure pulsation. The increase in the flow conditions has a significant effect on reducing the pressure pulsation of the gas–liquid two-phase flow, and the improvement of the air voids not only destroys the stability of the internal flow of the two-phase flow, but also aggravates the amplitude of pressure pulsation. Meanwhile, the multiple peaks of pressure pulsation are found on different monitoring points, considering the violent collision of the bubbles in the air–liquid two-phase flow, which results in the continuous breakage of the large bubbles and the coalescence of small bubbles, the internal flow field is relatively turbulent. Thus, the multiple peaks of pressure pulsation are generated at each monitoring point.
(3) According to the analysis of the blade surface loading and the radial force distribution, it can be found that the pressure on the pressure surface and the suction surface presents the increment trend from the leading edge to the trailing edge, and the three zero load points are generated on the blade. Meanwhile, the pressure on the pressure and suction surface is significantly larger than that at the shroud, and the effect of air voids and flow rate on the blade surface loading is obtained. The increment of the flow rates improves the internal flow law and greatly reduces the surface load of the blade, while the improvement of the air voids enhances the collision between bubbles, which aggravates the instability and asymmetry in the flow field, increasing the surface loading of the blade and radial force.
The raw data supporting the conclusion of this article will be made available by the authors, without undue reservation.
This is a joint work, and the authors were in charge of their expertise and capability: HC was in charge of investigation, analysis, writing, and revision; JD and SH were in charge of methodology and revision; GP was in charge of validation and revision; DY was in charge of data analysis; and SY was in charge of manuscript revision.
DY was employed by Chongqing Pump Industry Co., Ltd.
The remaining authors declare that the research was conducted in the absence of any commercial or financial relationships that could be construed as a potential conflict of interest.
All claims expressed in this article are solely those of the authors and do not necessarily represent those of their affiliated organizations, or those of the publisher, the editors, and the reviewers. Any product that may be evaluated in this article, or claim that may be made by its manufacturer, is not guaranteed or endorsed by the publisher.
The authors gratefully acknowledge the support from Open Research Subject of Key Laboratory of Fluid Machinery and Engineering (Xihua University), grant number LTJX 2021-003; Open Research Subject of Hubei Key Laboratory of Hydroelectric Machinery Design and Maintenance (China Three Gorges University), grant number 2020KJX07; the 69th batch of general funding from the China Postdoctoral Science Foundation, grant number 2021M691298; and Natural Science Research Project of Jiangsu Province Colleges and Universities: 21KJB570004, Priority Academic Program Development of Jiangsu Higher Education Institutions (PAPD).
Barrios, L., and Prado, M. G. (2011). Modeling Two-Phase Flow Inside an Electrical Submersible Pump Stage. J. Energ. Resour. Technol. 133 (4), 042902. doi:10.1115/1.4004967
Chang, H., Agarwal, R. K., Li, W., Zhou, L., and Shi, W. (2019). Numerical and Experimental Study of a Vortex Structure and Energy Loss in a Novel Self-Priming Pump. Processes 7 (10), 701. doi:10.3390/pr7100701
Chang, H., Hong, S., Yu, D., Peng, G., Ye, D., Liu, J., et al. (2021). Experimental Optimization of Self-Priming Pump Based on the Full Factor Test. Mechanics 27 (5), 429–434. doi:10.5755/j02.mech.29931
Chang, H., Shi, W., Li, W., Wang, C., Zhou, L., Liu, J., et al. (2020). Experimental Optimization of Jet Self-Priming Centrifugal Pump Based on Orthogonal Design and Grey-Correlational Method. J. Therm. Sci. 29 (1), 241–250. doi:10.1007/s11630-019-1160-2
Ganat, T. A., Hrairi, M., Hawlader, M. N. A., and Farj, O. (2015). Development of a Novel Method to Estimate Fluid Flow Rate in Oil wells Using Electrical Submersible Pump. J. Pet. Sci. Eng. 135, 466–475. doi:10.1016/j.petrol.2015.09.029
Huang, S., Su, X., Guo, J., and Yue, L. (2014). Unsteady Numerical Simulation for Gas-Liquid Two-Phase Flow in Self-Priming Process of Centrifugal Pump. Energ. Convers. Manag. 85, 694–700. doi:10.1016/j.enconman.2014.03.023
Monte Verde, W., Biazussi, J. L., Sassim, N. A., and Bannwart, A. C. (2017). Experimental Study of Gas-Liquid Two-Phase Flow Patterns within Centrifugal Pumps Impellers. Exp. Therm. Fluid Sci. 85, 37–51. doi:10.1016/j.expthermflusci.2017.02.019
Müller, T., Limbach, P., and Skoda, R. (2015). “Numerical 3D RANS Simulation of Gas-Liquid Flow in a Centrifugal Pump with an Euler-Euler Two-phase Model and a Dispersed Phase Distribution[C],” in 11th European Conference on Turbomachinery Fluid dynamics & Thermodynamics, Madrid, Spain, March 23, 2015 (European Turbomachinery Society).
Murakami, M., and Minemura, K. (1974). Effects of Entrained Air on the Performance of Centrifugal Pumps : 2nd Report, Effects of Number of Blades. Bull. JSME 17 (112), 1286–1295. doi:10.1299/jsme1958.17.1286
Musakaev, N. G., and Borodin, S. L. (2016). Mathematical Model of the Two-Phase Flow in a Vertical Well with an Electric Centrifugal Pump Located in the Permafrost Region. Heat Mass. Transfer 52 (5), 981–991. doi:10.1007/s00231-015-1614-3
Qian, H., Mou, J., Ren, Y., Zhu, Z., Liu, N., Zheng, S., et al. (2021). Investigation of Self-Priming Process of a Centrifugal Pump with Double Blades. J. Therm. Sci. 30 (3), 849–858. doi:10.1007/s11630-020-1370-7
Qian, H., Mou, J., Wu, D., Ren, Y., Zheng, S., and Zhu, Z. (2020). Experimental Investigation on the Gas-Liquid Flow Patterns in a Centrifugal Pump during Self-Priming Process. AIP Adv. 10 (1), 015136. doi:10.1063/1.5139240
Wang, C., He, X., Zhang, D., Hu, B., and Shi, W. (2019). Numerical and Experimental Study of the Self‐priming Process of a Multistage Self‐priming Centrifugal Pump. Int. J. Energ. Res 43 (9), 4074–4092. doi:10.1002/er.4497
Wang, C., Hu, B., Zhu, Y., Wang, X., Luo, C., and Cheng, L. (2019). Numerical Study on the Gas-Water Two-phase Flow in the Self-Priming Process of Self-Priming Centrifugal Pump. Processes 7 (6), 330. doi:10.3390/pr7060330
Wu, T., Liu, J., Zhang, L., and Xu, X. (2017). Experimental Study on Multi-Stage Gas-Liquid Booster Pump for Working Fluid Pressurization. Appl. Therm. Eng. 126, 9–16. doi:10.1016/j.applthermaleng.2017.07.159
Yonggang, L., Rongsheng, Z., Xiuli, W., Yang, W., Qiang, F., and Daoxing, Y. (2019). Study on the Complete Rotational Characteristic of Coolant Pump in the Gas-Liquid Two-Phase Operating Condition. Ann. Nucl. Energ. 123, 180–189. doi:10.1016/j.anucene.2018.09.030
Zhang, F., Böhle, M., and Yuan, S. (2017). Experimental Investigation on the Performance of a Side Channel Pump under Gas-Liquid Two-Phase Flow Operating Condition. Proc. Inst. Mech. Eng. A: J. Power Energ. 231 (7), 645–653. doi:10.1177/0957650917713090
Zhang, J., Cai, S., Li, Y., Zhu, H., and Zhang, Y. (2016). Visualization Study of Gas-Liquid Two-Phase Flow Patterns inside a Three-Stage Rotodynamic Multiphase Pump. Exp. Therm. Fluid Sci. 70, 125–138. doi:10.1016/j.expthermflusci.2015.08.013
Zhang, Y.-L., Zhu, Z.-C., Zhao, Y.-J., Wu, J., and Zhou, F.-L. (2021). Comparative Experiments on a Self-Priming Pump Delivering Water Medium during Rapid and Slow Starting Periods. Iran J. Sci. Technol. Trans. Mech. Eng. 45 (4), 1007–1019. doi:10.1007/s40997-020-00342-z
Keywords: population balance model, self-priming pump, flow characteristics, blade surface loading, pressure fluctuation
Citation: Chang H, Hong S, Yu D, Peng G, Du J and Yuan S (2022) Flow Characteristic Analysis of the Self-Priming Pump Based on the Population Balance Model. Front. Energy Res. 10:880338. doi: 10.3389/fenrg.2022.880338
Received: 21 February 2022; Accepted: 18 March 2022;
Published: 28 April 2022.
Edited by:
Lei Tan, Tsinghua University, ChinaCopyright © 2022 Chang, Hong, Yu, Peng, Du and Yuan. This is an open-access article distributed under the terms of the Creative Commons Attribution License (CC BY). The use, distribution or reproduction in other forums is permitted, provided the original author(s) and the copyright owner(s) are credited and that the original publication in this journal is cited, in accordance with accepted academic practice. No use, distribution or reproduction is permitted which does not comply with these terms.
*Correspondence: Guangjie Peng, cGdqQHVqcy5lZHUuY24=; Shouqi Yuan, c2hvdXFpeUB1anMuZWR1LmNu
Disclaimer: All claims expressed in this article are solely those of the authors and do not necessarily represent those of their affiliated organizations, or those of the publisher, the editors and the reviewers. Any product that may be evaluated in this article or claim that may be made by its manufacturer is not guaranteed or endorsed by the publisher.
Research integrity at Frontiers
Learn more about the work of our research integrity team to safeguard the quality of each article we publish.