 Weida Cheng
 Jinlu Yu1,2,3*
- 1Aviation Engineering School, Air Force Engineering University, Xi’an, China
- 2School of Power and Energy, Northwestern Polytechnical University, Xi’an, China
- 3AECC Sichuan Gas Turbine Establishment, Mianyang, China
- 4State Key Laboratory of Laser Propulsion and Application, Department of Aerospace Science and Technology, Aerospace Engineering University, Beijing, China
A new pre-combustion AC plasma jet igniter has been designed. The pre-combustion plasma jet igniter can widen the ignition envelope for the aeroengine and reduce the power consumption of the igniter. To fully exploit the ignition efficiency of the plasma jet, experimental studies concerning the operational parameters and the discharge and arc motion characteristics have been performed. The results showed that three discharge modes were formed in the new igniter, namely, the Intermittent Breakdown Mode (IBM), the Stable Breakdown Mode (SBM) and the Stable-Intermittent Breakdown mode (S-IBM), the three different discharge modes corresponding to different arc shapes and movement processes. Moreover, the addition of kerosene readily changed the discharge state from the SBM to the IBM. The discharge state and discharge power of the igniter were affected by the working parameters. The discharge power increased with increase of the output voltage of the regulator, and an increase in the air supply affected the discharge power when the output voltage of the regulator was varied. After the addition of kerosene, the discharge power of the igniter was reduced to a certain extent, the maximum reduction being up to 47.7%.
1 Introduction
Owing to their excellent characteristics, plasma sources have been widely studied and applied in the fields of aviation (Starikovskiy and Aleksandrov, 2013), and industrial processing (Korzec and Nettesheim, 2020) as first proposed by Langmuir in 1923. The plasma jet is particular is studied in the field of aeroengine ignition (Kang et al., 2018), because of its high energy and richness in active particles (Ju and Sun, 2015; Yu et al., 2018), which can widen the ignition boundary and shorten the ignition delay time (Matveev et al., 2005; Wang et al., 2019).
Scientists worldwide have undertaken comprehensive studies on plasma ignition technology and obtained in-depth information on topics such as the ignition mechanism and model testing of igniters (Starikovskaia, 2006; Leonov et al., 2010; Ombrello et al., 2010). Wagner et al. (1989) defined the concept of the plasma jet energy density, and performed much research on the plasma assisted ignition mechanism and flame characteristics. It was pointed out that the plasma could significantly accelerate the chain reaction of fuel and change the chemical reaction pathway of conventional combustion ignition. The studies of Kosarev et al. (2016) revealed that the influence of a non-equilibrium plasma on the ignition of a C2 hydrocarbon fuel is sustained mainly by the electronic collision products O and H atoms, and by hydrocarbon radicals in the discharge and afterglow; the main mechanism of these active substances is the electronic collision dissociation of fuel and oxygen. Yin et al. (2013) measured the temperature and OH concentration by a no-spark discharge (NSD) in a rectangular quartz reactor. The results show that H2 collides with electrons or excited state N2, which lead to the aggregation of H atoms and a reduction in the ignition temperature by about 200 K. Kim et al. (Kim et al., 2011) discussed the influence of the fuel inlet at Mach = 2.0 on the ignition of the plasma torch. The results showed that the high-temperature plasma may be used as an ignition source and as a flame stabilizer to ignite a fresh fuel mixture; also, it was found that the combustion inlet had little affection on the combustion performance. Billingsley et al.(Billingsley et al., 2005) performed an experiment which was based on traditional plasma ignition technology, and injected kerosene obliquely into a plasma jet; thereupon, kerosene was atomized and then ignited by the plasma jet. The results showed that this structure was conducive to atomization of and ignition of the kerosene. Matveev et al. (Matveev et al., 2010) described the concept of a plasma nozzle and presented a variety of configurations of plasma igniter and fuel nozzle, which provided a new approach for reducing electrode ablation and energy consumption of the igniter.
Kwonse and Dooseuk conducted a comparative study in relation to the thermodynamic combustion reaction processes of arc and jet plasmas (Kwonse and Dooseuk, 2018). It was found that the jet plasma had great advantages over the arc plasma in terms of the reaction time for combustion, the plasma volume, the energy and transient temperature change, especially in the case of lean combustion. The advantages of the plasma jet were confirmed, thus providing some support for undertaking experiments on plasma jet ignition technology in the combustor model.
On the basis of current theories, plasma jet ignition has been applied to various combustor models. In the conventional turbofan engine combustor model, compared with the conventional spark ignition technology, the plasma jet ignition technology can greatly broaden the ignition boundary and shorten the ignition delay time. Meanwhile, the ignition delay time is positively correlated with the inlet temperature of the combustor (Wang et al., 2019). In the model of the ramjet combustor with a V-shaped flame holder, the ignition delay time is significantly shortened for a wide range of residual gas coefficients compared with the spark ignition technology, and the ignition delay time is positively correlated with the arc current of the igniter (Zhao et al., 2020). From oil rich to oil lean, the ignition delay time first decreases and then increases with increase of the residual gas coefficient. In extreme cases (relatively oil lean or oil rich), the ignition delay time increases greatly (Zhang et al., 2018). In this research, the feasibility and superiority of plasma jet ignition were verified by an experimental study of the combustor model.
At present, the plasma jet igniter used in aero-engine ignition is basically powered by DC power supply. DC power supply can increase jet energy by increasing the arc current, but it will cause rapid erosion of the electrode and reduce electrode life (Takita et al., 2007). At the same time, larger and heavier airborne power supply is needed to provide additional arc current. It is not conducive to the promotion and application of plasma jet igniter at the current stage. In order to reduce the igniter power without affecting the injection energy, on the basis of the traditional plasma jet igniter with air as working medium, AC power supply is used to drive gliding arc discharge. Gliding arc plasma has the advantages of balanced plasma and unbalanced plasma (Fridman et al., 1999), which can be used as a moving ignition source (Gao et al., 1999), and at the same time, it has less electrode ablation (Naville et al., 1905). Kerosene is used as a pre-combustion fuel to form a new type of pre-combustion AC plasma jet igniter. Compared with the igniter which uses methane as the pre-combustion fuel (Huang et al., 2018), kerosene is the own fuel of the existing aircraft, which is easy to use. In order to fully understand the pre-combustion AC plasma jet igniter, this passage will focus on the working characteristics of the igniter, which lays the foundation for the subsequent combustor model ignition experiment.
2 Experimental
2.1 Pre-combustion AC Plasma Jet Igniter
The self-designed pre-combustion AC plasma jet igniter consists of three units, that is an air supply unit, a fuel supply unit, and a conductive system. The structure is illustrated in Figure 1. In the air supply unit, air flows into the igniter through the air channel at the side of the shell, which is then impacted by the hydro-cyclone. Next, the air generates a cyclone, which is ejected from the converging section of the igniter outlet. In the fuel supply unit, kerosene is delivered to the igniter via the fuel inlet on the shell, by the insulating sleeve which flows into the fuel channel in the anode, then ejected from the hole because of the pressure differential. Finally, kerosene is atomized forming a spray of fine droplets. In the conductive system, the electrode interface touches the anode by the electrode sleeve and connects to the high voltage output of the power source. The bottom of the shell which serves as the cathode is connected to ground. The minimum diameter of the igniter cathode is 14 mm, and the maximum diameter is 18 mm. The size of the igniter cathode ensure that the igniter can be used for subsequent ignition experiments in various combustion chambers. The diameter of the igniter outlet is 4 mm, the diameter of the anode is 4 mm, and the minimum discharge gap between the electrodes is 3 mm. After the igniter has been energized, the high voltage will form a powerful electric field which is intensified between the anode and cathode and when the electric field intensity increases to a certain level, the air and the kerosene-air mixture will break down and form the arc. When the fuel inlet opens, with the three systems acting in unison, fuel and air are mixed at the igniter outlet to form an oil-gas mixture, which is ignited by the electric arc, where upon a pre-combustion plasma jet is formed under the action of swirling flow, hence the combustible mixture in the combustion chamber is ignited.
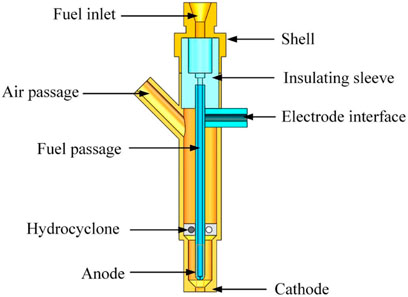
FIGURE 1. Pre-combustion AC plasma jet igniter.
2.2 Experimental System of Discharge Characteristics
The experimental system for studying the discharge characteristics of the plasma igniter is shown in Figure 2. Air is supplied by an air compressor, and the pressure is regulated by the gas cylinder valve. The air is dried by an air dryer, then the air flows through the flow regulating valve which is controlled by the D08-1F mass flow control meter, finally flowing into the air channel of the igniter. The power of the igniter is supplied by the CTP-2000KP power unit. The maximum power output is 1 kW, which is lower than the power of the DC plasma source. The output power of the source can be changed by changing the voltage of the matched voltage regulator. The fuel supply system is self-designed and portable and can control automatically the fuel flow. The precision of the fuel supply unit can reach 0.001 L/min; control of fuel delivery is via an on-off solenoid valve. The oscilloscope used was a Tektronix 4104B unit. The voltage signal was monitored by a Tektronix P6015A high voltage probe and the current signal was detected by a Tektronix TCP0030 AC/DC dual purpose current probe.
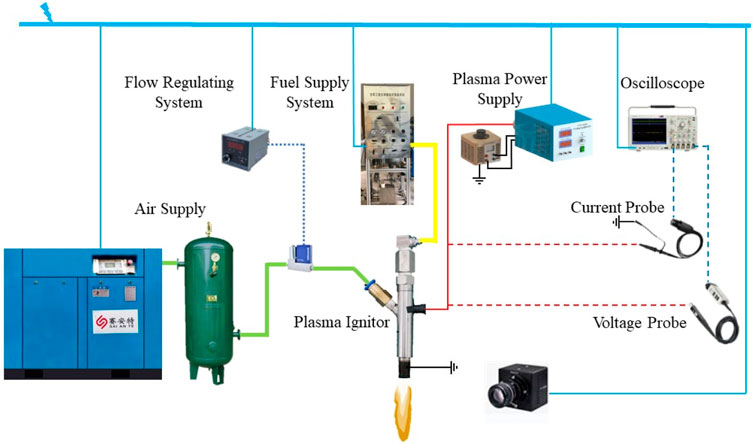
FIGURE 2. Experimental system for studying the discharge characteristics of the pre-combustion plasma jet igniter.
3 Result and Discussion
3.1 Discharge Characteristics of the Pre-combustion AC Plasma Jet Igniter
The discharge characteristics of the igniter refer in the main to the variation in the characteristics of the voltage and electric current responses of the igniter with time and as a function of other variables, these characteristics reflecting the evolutionary changes in the working power, discharge stability, voltage, and electric current of the igniter.
3.1.1 Influence of Working Parameters on the Discharge State
In the absence of kerosene, the voltage and current waveforms of the igniter discharge are measured under different regulation voltages (Ua = 40, 80, 120, 160, 200, 240 V) and different igniter air supply rates (Wa = 10, 20, 30, 40, 50, 60 L/min). It was found that there were three different discharge states for the igniter under the different voltage and igniter air supply regimes. They are Stable Breakdown Mode, Intermittent Breakdown Mode and Stable-Intermittent Breakdown Mode.
(1) Stable Breakdown Mode
For the voltage regulator Ua = 240 V, the air supply Wa = 10 L/min, and the discharge power of 276.0 W, the discharge characteristics of igniter are presented in Figure 3, in which Figure 3A is a macroscopic image of the voltage and current waveforms; Figure 3B is an enlarged image of the gray box in Figures 3A,C is a voltage and current waveform in a single cycle.
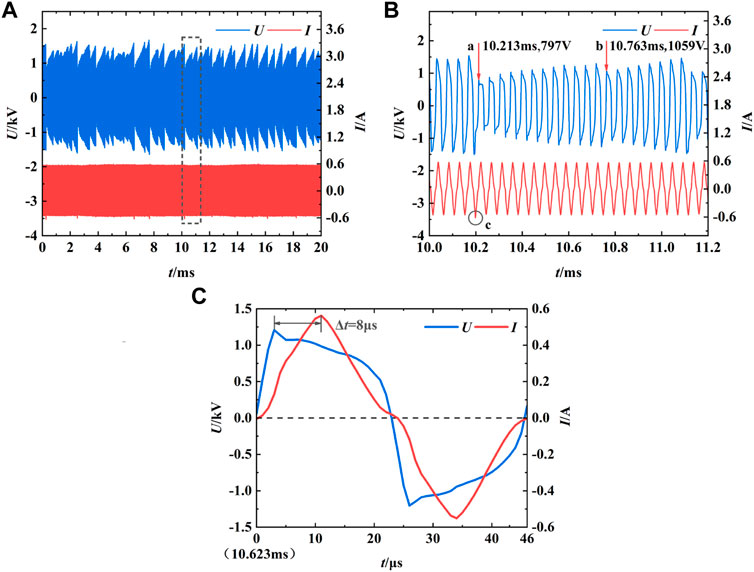
FIGURE 3. Discharge characteristics for the igniter at Ua = 240 V and Wa = 10 L/min. (A) Macro waveform of igniter discharge voltage and current. (B) Local waveform of igniter discharge voltage and current. (C) Voltage and current waveforms for a single discharge cycle.
From the macroscopic viewpoint of the discharge voltage and current waveforms of the igniter, the voltage waveform is regular and zigzag, and revealing, on the whole, periodicity in the change trend. The voltage is between −2 and 2 kV, and the current waveform does not fluctuate abruptly. The current range is between −0.6 and 0.6 A, and there is no particularly prominent peak. The main reason for this is that the dielectric property between the two electrodes changes after the igniter breaks down, and only a low voltage is needed to maintain the existence of the discharge channel when the arc persists. Even when the arc is extinguished, given the lifetime of charged particles is very short (ps order) (Itikawa, 2007), compared to the lifetime of excited and meta-stable particles is (μs and even ms order) (Korolev et al., 2011; Zhao et al., 2014), the gap between the electrodes is full of excited and meta-stable particles, and the conductivity of electrode gap is enhanced. In the case of the time duration for a short-lived arc, due to the existence of a similar “memory effect”, only a relatively low voltage is needed to break down the discharge again to generate the arc, so the peak voltage is small.
In Figure 3B, it can be seen that the voltage peak obeys a law of whereby the voltage increases gradually from a small value and then there is a reversal in the voltage response which then decreases rapidly. The positions indicated by arrows at a and b represent the initial voltage peak in a particular change period, and the region between a and b is the gliding period of the arc, which has a period of 0.55 ms. The starting voltage peak at a is 797 V, the previous peak at a was 1541 V, a value which is 744 V less; the starting voltage peak at b is 1059 V, and the previous peak at b was 1296 V, a value which is less by 237 V. It can be concluded that for different periods of change, although the rules governing the changes in the peak voltage responses are consistent, the starting peak voltages still have some differences, and the ending peak voltages for the previous period are different from the starting peak voltages for the next period. In going from a to b, the peak voltage rises slowly, while the peak current basically remains unchanged. At this stage, the increase in the peak voltage is due to the elongation of the arc caused by the breakdown between the two electrodes of the igniter under the action of airflow. To maintain the arc, the voltage between the two electrodes of the igniter should increase with the elongation of the arc within the range of the maximum output power that can be supplied by the power supply, in order to maintain the electric field strength of the arc and further enable the arc to continue to develop. At the same time, the arc plays a role similar to that of the resistance of the arc. The current passes through the arc, and the current only depends on the voltage between the two electrodes of the igniter and the resistance value of the arc. Under the joint action of the two, the final peak value of the current is basically unchanged. The last voltage peak at a corresponds to a large peak current, as shown by the circle at c. The reason for the peak current appearing at this point is that the arc has fully developed. After the voltage increases a certain extent, a new arc is generated by breakdown at the shortest electrode gap, and two arcs exist at the same time, so a prominent peak in the current response is observed (Du, 2015).
Taking 10.623 ms in Figure 3B as the initial point and taking one of the voltage and current cycles for analysis, as shown in Figure 3C, it can be concluded that the duration of one cycle is about 46 μs for the power frequency f1 = 22 kHz adopted in the experiment. It can be seen that the discharge cycle after the igniter breakdown is consistent with the power cycle. At the initial stage of a cycle, with the rise of voltage, the current increases sharply. In this breakdown event, the electron avalanche process increases, and the number density of electrons in the arc and the surrounding plasma increases rapidly. Because of the Joule effect, the arc is also heated. When the voltage reaches its peak, the electrons accelerate significantly. When the voltage decreases, the current still increases and then reaches its maximum value. The change between the voltage and current is asynchronous. Under such conditions, the retardation time of the current Δt = 8 μs. This time accounts for 17.4% of the discharge cycle. Korolev (Korolev et al., 2011) attributed the “hysteresis effect” of the rise in the current after the voltage drop to a reduction in the gap resistance, which is related to the formation of cathode spots on the arc (Zhao et al., 2013). In Figure 3C, the voltage and current waveforms reveal periodicity, but there are still some differences with the sinusoidal patterns, which may be related to the change of conductivity and plasma impedance during the discharge (Zhang et al., 2016). It can be deduced from Figure 3B that the initial voltage peak of each cycle of change does not start from 0, because there is only a drop in the peak voltage, and the current always follows the voltage change with a lag time, without the current being zero for a period of time. Therefore, the arc can be viewed as always existing in the whole discharge process, and the arc is not completely extinguished at the junction of the two change cycles; there is breakdown and a new arc is generated. In contrast, the generation of a new arc and the extinction of the original arc occur almost at the same time, and then the new arc is elongated under the action of airflow, and this cycle is constantly repeating, hence the term Stable Breakdown Mode (SBM) is used as a descriptor.
(2) Intermittent Breakdown Mode
When Ua = 40 V, Wa = 60 L/min, and the discharge power is 52.4 W, the discharge characteristics of igniter are shown in Figure 4. In Figure 4A, compared with Figure 3A, there is a great difference between the two modes. For the same time scale, the current in Figure 4A no longer changes continuously in the sinusoidal waveform, but shows intermittent peaks, which are both positive and negative. The voltage waveform also does not show the regular serrated edge in Figure 4A. On the whole, when Ua = 40 V and Wa = 60 L/min, the voltage is concentrated between −10 and 10 kV, which is much higher than that when Ua = 240 V and Wa = 10 L/min, and the current is concentrated between −0.8 and 0.8 A, which is the same as that when Ua = 240V and Wa = 10 L/min. There are two reasons for initially comparing the differences in the voltage ranges. One is that the voltage outputs of the voltage regulator are different. According to the output characteristics of the power supply, when the power frequency is fixed, the output power for different voltage regulator values will be different, hence the respective peak voltages will be different. The second reason is that the igniter is not always in a breakdown state in accord with the current waveform. When Ua = 40 V and Wa = 60 L/min, the airflow speed would be faster, and the “memory effect” after igniter breakdown would be weaker. The environment when the igniter breaks down again would be basically the same as that when igniter breaks down for the first time, thus the breakdown voltage would basically be equal.
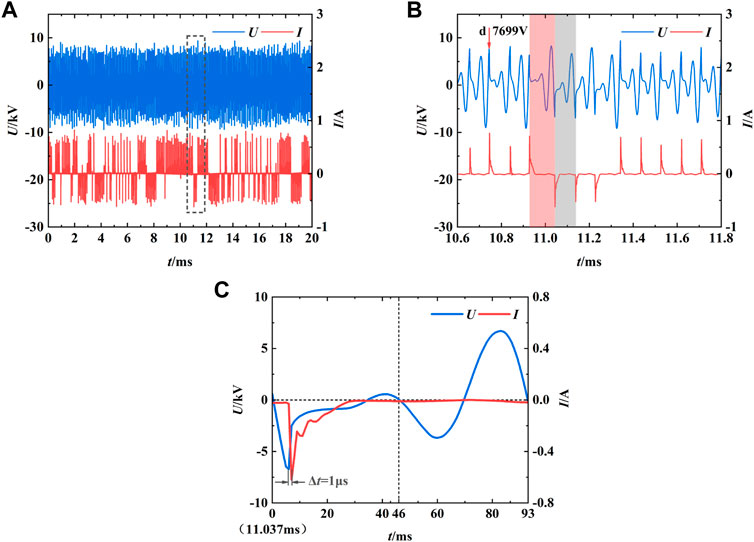
FIGURE 4. Discharge characteristics of igniter when Ua = 40 V and Wa = 60 L/min. (A) Macro waveform of igniter discharge voltage and current. (B) Local waveform of igniter discharge voltage and current. (C) Voltage and current waveforms in a single discharge cycle.
To observe the local voltage and current waveforms clearly and to ascertain the rules which govern the changes in the discharge, it is necessary to examine the forward breakdown, and reverse breakdown discharge waveforms shown in the gray box in Figure 4A and amplify them to get Figure 4B. The position indicated by the arrow at d is one of the breakdown voltage peaks, and the breakdown voltage value is 7699 V, which is much higher than the values 797 V at a and 1059 V at b in Figure 3B. In the voltage waveform in Figure 4B, the increase in the peak voltage still exists in the two breakdown processes, but it is not as obvious as in Figure 3B; this is related to the insufficient development of voltage over the short time between the two breakdowns. In Figure 4B, it can be observed clearly that the current breaks down in both the forward and reverse processes. The light red color block covers the discharge period between forward breakdown and reverse breakdown, and the gray color block covers the discharge period between two adjacent reverse breakdowns. From the width of the two color blocks, it can be seen clearly seen that the discharge period for breakdown in the opposite direction is larger than that for breakdown in the same direction. The difference between the two types of discharge cycles comes from voltage commutation. On the one hand, the gray color block covers two power supply cycles. On the other hand, the red color block covers two and a half power supply cycles, so there is a difference in the discharge cycles. It can be seen from Figure 4A that the occurrence of the two types of discharge cycles is random, accounting for 50% each, and the discharge laws of the two types are basically consistent. Figure 4C shows a discharge period in the same direction as the breakdown. It can be seen that the discharge period is 93 µs, which is about equal to two power supply periods. The current also lags behind the change of voltage, but the lag time Δt = 1 μs is smaller than Δt = 8 μs in Figure 3C, which shows that different working parameters such as the voltage regulator voltage and the air supply of the igniter affect the lag time.
Combining (A), (B) and (C) in Figure 4, it can be seen that the igniter discharge mode at this time is different from the igniter discharge mode when Ua = 240 V and Wa = 10 L/min, and the current only periodically appears at the breakdown peak, indicating that the arc does not exist continuously, but periodically appears intermittently along with the igniter breakdown, hence the terminology Intermittent Breakdown Mode (IBM).
(3) Stable-Intermittent Breakdown Mode (S-IBM)
When Ua = 120 V, Wa = 30 L/min, and the discharge power is 105.1 W, the discharge characteristics are as shown in Figure 5. Compared with the SBM and the IBM, the peak voltage in Figure 5A is between that of the SBM and the IBM, and the peak current is similar for all three modes. From Figure 5B, the peak voltage is cluttered and there is no regularity in the change in the voltage response. The breakdown peak is prominent. In comparison with the SBM, the regularity of the current waveform is poor, and the breakdown peak is prominent. In comparison with the IBM, the current response for the positive and negative breakdown cycles alternates in the Stable-Intermittent Breakdown Mode (S-IBM). From Figure 5C, for a single discharge cycle, the current not only has sinusoidal waveform typical of that for the SBM and a well-defined breakdown peak as in the IBM, but also the breakdown peak is significantly larger than the sinusoidal waveform. The current delay time Δt = 1 μs is the same as that for the IBM. Given that the working conditions for this mode of operation share some of the characteristics of both the IBM and the SBM, this working condition is termed the S-IBM. In this discharge mode, when the arc continues to glide, breakdown continues to occur, resulting in an additional peak current.
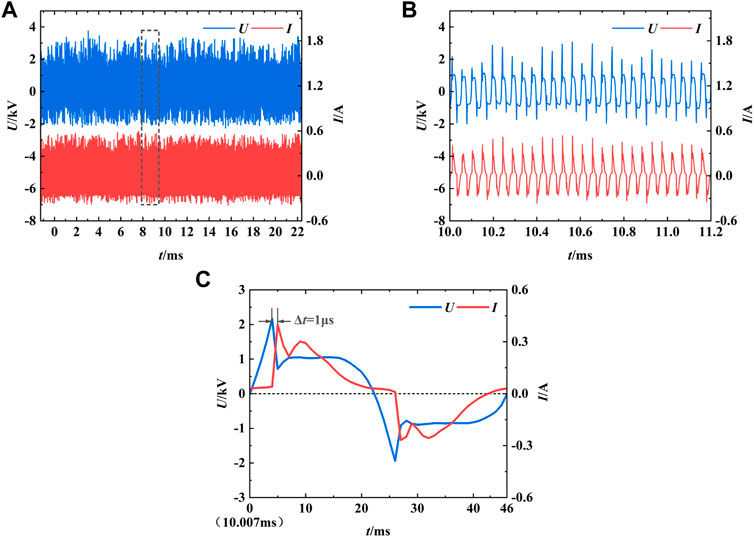
FIGURE 5. Discharge characteristics of igniter when Ua = 120 V and Wa = 30 L/min. (A) Macro waveform of igniter discharge voltage and current. (B) Local waveform of igniter discharge voltage and current. (C) Voltage and current waveforms in a single discharge cycle.
In the absence of kerosene, the discharge patterns under the different working conditions as shown in Figure 6. When Ua = 40 V, the discharge mode of the igniter is IBM. When 10 L/min ≤ Wa ≤ 50 L/min, the discharge mode transitions from the IBM through the S-IBM to the SBM with the increase of the igniter air supply; also, the transition zone becomes wider with increase in the air supply of the igniter.
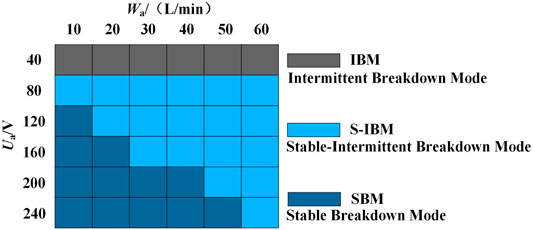
FIGURE 6. Distribution diagram for the discharge mode under different working conditions.
When the output voltage of the voltage regulator is low, the output power of the power supply is low, and this is not enough to provide the energy needed for the continuous gliding of the arc, so the IBM occurs. Under the same air supply, with increase in the voltage regulator, the output power of the power supply also increases. After breakdown, the voltage margin needed to provide elongation of the arc also becomes larger, and this condition can support the gliding of the arc for a longer distance, and in this process, gliding is accompanied by intermittent breakdown. Under the condition of a low air supply, with increase in the voltage regulator, the discharge mode can readily be changed from the S-IBM to the SBM. The reason for this is that when the air supply is relatively low, the cooling effect of the air flow on the arc is weak and it is easier to produce a local thermodynamic equilibrium (LTE) state in the plasma. The conductivity of the arc increases, the impedance decreases and the peak value of the current increases. Before the arc reaches the maximum length, the output power of the power supply can guarantee a large and stable peak value for the current. With an increase in the air supply, the cooling effect of the air flow on the arc is enhanced, the outlet velocity of the igniter is accelerated, and the peak value of the sinusoidal waveform for the current is reduced. The locally balanced plasma only exists in the early stages of arc development. With the continuous increase in arc length, the arc reverts into an unbalanced plasma arc, which is more prone to intermittent breakdown, so the igniter is more likely to change from the SBM to the S-IBM; also, the smaller the output is for the voltage regulator, the smaller will be the air supply for the igniter during the transition, and this shows that the discharge mode of the igniter is determined under the joint action of the two parameters.
When Wa = 30 L/min and Ua = 120 V, the voltage and current changes before and after the introduction of kerosene are presented in Figure 7. It can be observed that the voltage and current amplitudes are greatly improved after the introduction of kerosene, an increase of almost 200% of that in the absence of kerosene. This result indicates that the fuel has a great influence on the discharge waveform of the igniter. It was also noted that the discharge state changed for various working conditions after the introduction of kerosene is introduced, the respective distribution diagrams for the discharge modes being shown in Figure 8.
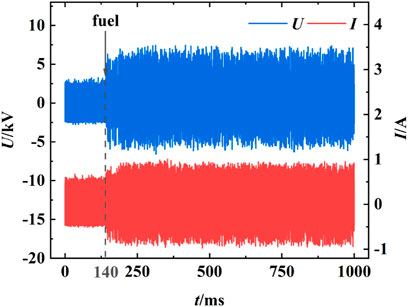
FIGURE 7. Changes in the igniter voltage and current before and after introduction of kerosene for Wa = 30 L/min and Ua = 120 V.
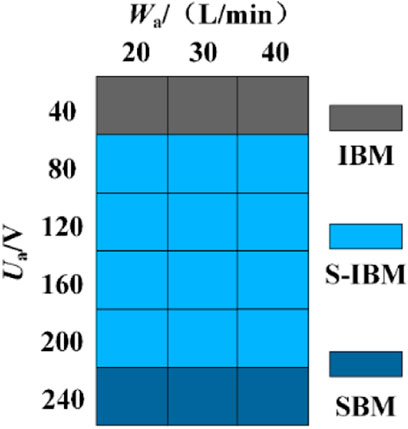
FIGURE 8. Distribution diagrams for the discharge modes under different working conditions after introduction of kerosene.
Compared with the corresponding working conditions in Figure 6, it can be found that when Ua = 40 V or Ua = 240 V, the discharge state of the igniter remains the same as the original mode. When 40 V < Ua < 240 V, a large part of the original SBM is changed into the S-IBM. After the introduction of kerosene, the fuel passes through the discharge channel and interacts with the arc generated by of the igniter breakdown. On the one hand, kerosene is partially cracked, and this process consumes energy from the arc. On the other hand, kerosene at normal temperature takes away part of the heat generated by the arc, hence the arc is cooled somewhat, and this is equivalent to increasing the air flow. Therefore, when the power supply output is at a medium level, the discharge state of arc changes from LTE to an unbalanced state, which is reflected in the change of the discharge mode from the SBM to the S-IBM. The change of the discharge mode has a great influence on the ability of the igniter to undergo ignition, and the change of discharge mode affects the thermal effect of the plasma jet, which further affects the ignition performance of the igniter.
3.1.2 Influence of Working Parameters on the Discharge Power
The discharge power P of the igniter under different operating conditions in the absence of kerosene is shown in Figure 9. The overall discharge power of the igniter is in the range of 25–275 W. When the air supply is kept constant, the discharge power of the igniter increases with the output voltage of the regulator, and the response is basically linear; however, the growth rate differs for various low rates of the air; the larger the air supply, the smaller the rate of growth. The trend in the rate of growth illustrates that the output voltage of the regulator directly affects the discharge power of the igniter; to improve the discharge power output of the igniter, increase in output the voltage of the regulator would be a more direct and useful method.
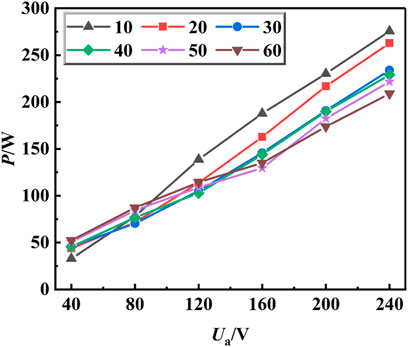
FIGURE 9. Power diagram for the igniter under various working conditions in the absence of kerosene.
When the voltage of the regulator is kept constant, the relationship between the discharge power of the igniter and the air supply of the igniter is not linear but is related to the specific regulator voltage. When Ua ≤ 80 V, for the same regulator voltage, the discharge power of the igniter increases as the air supply of the igniter increases, but the absolute difference between the discharge power corresponding to the various air supply rates is small. That is because when the flow rate of the air supply rate increases, the flow rate of the mixture of charged and uncharged particles accelerates, the difficulty of media breakdown increases, the ability to stabilize the arc decreases and the ability to stabilize the power supply rises, and these factors in turn bring about an increase in the power of the igniter. When the voltage of the regulator is relatively low, the maximum power output from the power supply is low, so the absolute difference between the various igniter gas supplies is small, but the relative difference is still large; for example at Ua = 40 V, Wa = 10 L/min the igniter discharge power p = 32 W; when Wa = 60 L/min, the igniter discharge power p = 52 W, a value which has increased by 62.5%. At Ua ≥ 200 V, the igniter discharge power decreases with increase in the air supply at the same regulator voltage, and the absolute difference is also increased compared to the situation for the lower regulator voltages; this is related to the increase in the maximum power that can be output from the power supply. For example at Ua = 240 V, the discharge power of the igniter p = 208 W at Wa = 60 L/min, and at p = 275 W at Wa = 10 L/min. This is because as the voltage of the regulator increases, the discharge mode of the igniter also changes, that is, from IBM to S-IBM and then to SBM, as can be seen from Figure 6. The igniter is basically in the SBM when the arc plasma is in LTE and the temperature is relatively high The larger the air supply to the igniter, the stronger the cooling effect, the more unstable the arc in the LTE state becomes, thus the lower the degree of ionization of the arc, the increase in the impedance of the arc, the reduction of the current through the arc, hence resulting in the discharge power of the igniter being reduced.
When kerosene is introduced, the discharge power response diagrams for several working conditions are presented in Figure 10. When the air supply for the igniter is kept constant, the trend for the discharge power remains constant the increase in the regulator voltage. The response curve for the discharge power of the igniter as a function of the voltage change of the regulator was analyzed for Wa = 20 L/min and Wa = 30 L/min, with and without the introduction of kerosene, as shown in Figure 11. It can be seen clearly from the graph, that after introduction of kerosene to the igniter, the discharge power of the igniter is reduced. When Wa = 20 L/min and Ua = 40 V, the discharge power is reduced from a value of 44 W in the absence of kerosene to 23 W after kerosene is introduced, the decline reaching 47.7%. At Ua = 240 V, the discharge power decreased from 262 W in the absence of kerosene to 211 W after kerosene was introduced, the decline being 19.5% this time; this result indicated that with increase of the voltage regulator, although the absolute value for the decrease of the discharge power increased after kerosene was introduced, the range also decreased. In general, the introduction of kerosene is beneficial to achieving a reduction in discharge power requirements for the igniter.
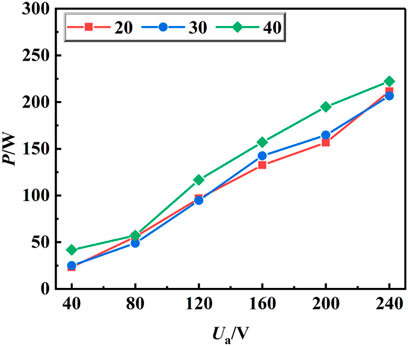
FIGURE 10. Ignition power diagram for introduction of kerosene.

FIGURE 11. Comparison of igniter power with and without the introduction of kerosene.
3.2 Arc Motion Characteristics of Pre-combustion AC Plasma Jet Igniter
To better understand the fundamental differences in the three discharge states, the characteristics of front of the arc for the three discharge states were studied and analyzed. In the experiment, the video frame settings of a high-speed camera were as follows: the filming frame rate was 20,000 fps, and the exposure time was 0.05 ms. The movement process for the front of the arc in one cycle when Wa = 10 L/min and Ua = 40 V is shown in Figure 12. The discharge state corresponding to this working condition is IBM, and the red circle in the figure represents the edge of the igniter outlet hole. On the whole, the arc is a brilliant white, and the arc shape is clear. Given that the focal length of the high-speed camera does not change during filming, it can be inferred that under this working condition, the arc basically slides near the same plane, and the displacement in the axial direction of the igniter is small. The arc glides in the red circle, which indicates that the arc does not cross the igniter outlet hole to the metal end face at one end of the igniter outer shell, and this further indicates that the arc moves in the same plane. When t = 0 ms, the arc is generated at the shortest gap between the two electrodes. At this time, the arc is a quasi-balanced plasma column (Du, 2015), which slides counterclockwise between the two electrodes under the swirling flow in the exit area of the igniter. The arc length is continuously lengthening, and the shape of the arc gradually becomes distorted under the action of the airflow. The longer the length of the arc, the greater the energy needed to maintain the arc and the higher the power provided by the power supply. When the output power of the power supply reaches the maximum value, the thermodynamic balance cannot be maintained, the arc changes to an unbalanced state and continues to grow until it disappears, and then a new arc is generated at the shortest electrode gap and continues a repeat of the previous process. It can be readily calculated that one gliding period for the arc is 0.45 ms, and the average gliding angular velocity of the arc in one period ω1 = 488.89°/ms.
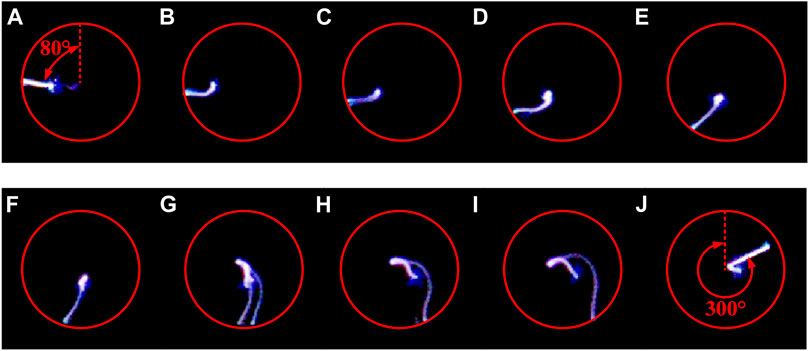
FIGURE 12. Frontal arc movement process in one cycle when Wa = 10 L/min and Ua = 40 V. (A) t = 0 ms, (B) t = 0.05 ms, (C) t = 0.10 ms, (D) t = 0.15 ms, (E) t = 0.20 ms, (F) t = 0.25 ms, (G) t = 0.30 ms, (H) t = 0.35 ms, (I) t = 0.40 ms, (J) t = 0.45 ms.
The gliding process for the front of the arc at Wa = 10 L/min and Ua = 240 V is shown in Figure 13. The discharge state corresponding to this working condition is SBM. In this discharge state, the arc is generally purplish red with high curvature, and it basically does not slide on the same plane, resulting in a fuzzy arc. In the SBM discharge stage, the arc is basically in a local equilibrium state, with a high degree of ionization for the arc, large arc energy, more energy radiating outward and of short wavelength, so the arc observed is purple in color. In the process of gliding, it can be observed clearly that the arc crosses the red circle, indicating that the arc is at one end of the igniter shell and on the metal end face of the igniter outlet, and the length of the arc is relatively long. To facilitate the analysis of the gliding angular velocity of the arc as in Figure 13J, the tangent line of the front end of the arc is used for measurement of the angle, in which the red arc dashed line represents the arc position and the red straight dashed line represents the tangent line at the front end of the arc, thus a value for the gliding angular velocity of the arc ω2 = 304.44/ms may be obtained. When ω2<ω1, on the one hand, because the arc exceeds the exit end face of the igniter, the airflow speed decreases, resulting in a decrease in the gliding speed of the arc. On the other hand, because the arc is very tortuous and twisted, the difficulty of gliding increases, which makes the gliding angular velocity for the arc for the SBM less than that for the IBM.
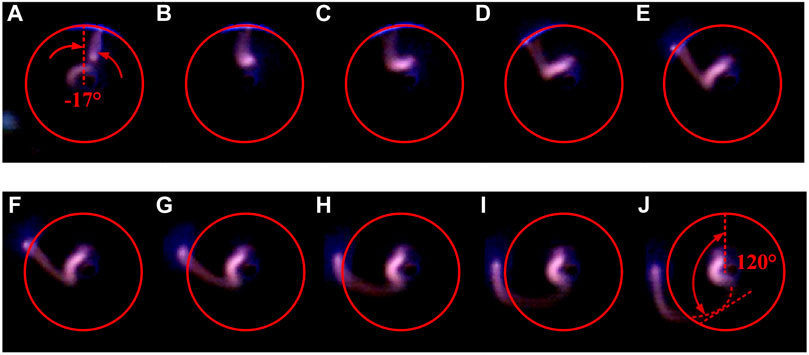
FIGURE 13. Arc gliding process at Wa = 10 L/min and Ua = 240 V. (A) t = 0 ms, (B) t = 0.05 ms, (C) t = 0.10 ms, (D) t = 0.15 ms, (E) t = 0.20 ms, (F) t = 0.25 ms, (G) t = 0.30 ms, (H) t = 0.35 ms, (I) t = 0.40 ms, (J) t = 0.45 ms.
The front of the arc at different times when Wa = 30 L/min and Ua = 120 V is shown in Figure 14. The discharge state corresponding to this working condition is S-IBM. On the whole, the color of the arc in this state is between those for the IBM and the SBM, and the degree of distortion of the arc shape also lies between those for the two discharge states, thus the arc is said to be in a transitional state. It can be seen that in the same filming image, basically two arcs appear, which is due to the fast air flow speed and the fast arc gliding speed, which exceeds the shutter speed, resulting in the phenomenon of multiple arcs. In addition, the dual nature of the image is also related to the accompanying breakdown under the S-IBM, and additional breakdown of the discharge occurs at adjacent times, which is shown in Figure 14J. Compared with the IBM and the SBM, there is no obvious period for the arc under this working condition, which is related to the mixing of breakdown modes when the igniter discharges, hence resulting in a disordered discharge.
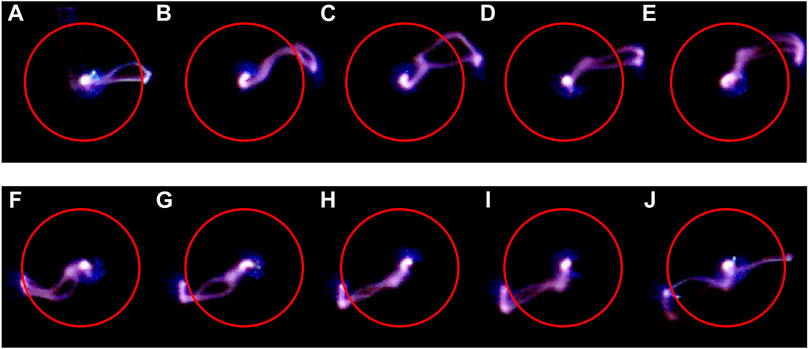
FIGURE 14. Arc gliding process at Wa = 30 L/min and Ua = 120 V. (A) t = 0 ms, (B) t = 0.05 ms, (C) t = 0.10 ms, (D) t = 0.15 ms, (E) t = 0.20 ms, (F) t = 0.25 ms, (G) t = 0.30 ms, (H) t = 0.35 ms, (I) t = 0.40 ms, (J) t = 0.45 ms.
4 Conclusion
This paper introduces a pre-combustion plasma jet igniter driven by AC power supply, and mainly studies the discharge characteristics and arc motion characteristics of the igniter. The igniter exhibited three discharge states which formed under different working conditions, that is, the IBM, the SBM and the S-IBM. Three different discharge states represent different energy and motion characteristics of arc, which provides a basis for the future study of igniter self-ignition characteristics and pre-combustion jet characteristics. By studying the influence of different arc states on self-ignition and pre-combustion flame formation, we can find out the most favorable discharge state for ignition, and control the discharge state to maximize ignition efficiency.
The experiment also found that after the introduction of kerosene, the discharge power of the igniter decreased to a certain extent, with a maximum decrease of 47.7%, which provided a new idea for reducing the energy consumption of the plasma igniter and changed the previous method of increasing the discharge energy to improve the ignition energy. High energy consumption is a difficult problem that restricts the practical direction of the plasma igniter in the aero-engine, so this discovery provides a new direction for realizing the application of the plasma igniter with low energy consumption and high ignition energy in the aero-engine.
Data Availability Statement
The original contributions presented in the study are included in the article/Supplementary Material, further inquiries can be directed to the corresponding author.
Author Contributions
WC: Experimental Design, Data Analysis, Writing; JY: Providing overall Ideas, Data Analysis; LJ: Experimental Data Processing, Data Analysis; QM: Experimental Data Processing; LZ: Build Experimental Systems; BZ: Guide the Experimental Operation.
Funding
Project supported by the National Natural Science Foundation of China (Grant Nos. 51776223, 91741112).
Conflict of Interest
The authors declare that the research was conducted in the absence of any commercial or financial relationships that could be construed as a potential conflict of interest.
Publisher’s Note
All claims expressed in this article are solely those of the authors and do not necessarily represent those of their affiliated organizations, or those of the publisher, the editors and the reviewers. Any product that may be evaluated in this article, or claim that may be made by its manufacturer, is not guaranteed or endorsed by the publisher.
References
Billingsley, M., Sanders, D., O'Brien, W., and Schetz, J. (2005). Improved Plasma Torches for Appication in Supersonic Combustion. Ital: AIAA Capua, 3423.
Du, C. M. (2015). Non-thermal Arc Plasma Technology and Application. Beijing: Chemical Industry Press.
Fridman, A., Nester, S., Kennedy, L. A., Saveliev, A., and Mutaf-Yardimci, O. (1999). Gliding Arc Gas Discharge. Prog. Energ. Combustion Sci. 25 (2), 211–231. doi:10.1016/s0360-1285(98)00021-5
Gao, J., Kong, C., Zhu, J., Ehn, A., Hurtig, T., Tang, Y., et al. (2019). Visualization of Instantaneous Structure and Dynamics of Large-Scale Turbulent Flames Stabilized by a Gliding Arc Discharge. Proc. Combustion Inst. 37 (4), 5629–5636. doi:10.1016/j.proci.2018.06.030
Huang, D. H., Yu, J. L., Wang, S. B., Li, Q. Y., and He, L. M. (2018). Experimental Investigation on Characteristics of Pre-combustion Plasma Jet Ignition. Gaodianya Jishu 44 (09), 3068. doi:10.13336/j.1003-6520.hve.20180828039
Ju, Y., and Sun, W. (2015). Plasma Assisted Combustion: Dynamics and Chemistry. Prog. Energ. Combustion Sci. 48, 21–83. doi:10.1016/j.pecs.2014.12.002
Kang, J., Qian, M., Li, G., Liu, S., Ren, C., Zhang, J., et al. (2018). The Effect of Methane Gas Flow Rate on the Streamer Propagation in an Atmospheric-Pressure Methane-Air Plasma Jet. Phys. Plasmas 25 (9), 093508. doi:10.1063/1.5046946
Kim, C.-H., Jeung, I.-S., Choi, B., Kouchi, T., Takita, K., and Masuya, G. (2011). Effect of Fuel Injection Location on a Plasma Jet Assisted Combustion with a Backward-Facing Step. Proc. Combustion Inst. 33 (2), 2375–2382. doi:10.1016/j.proci.2010.07.057
Korolev, Y. D., Frants, O. B., Geyman, V. G., Landl, N. V., and Kasyanov, V. S. (2011). Low-Current "Gliding Arc" in an Air Flow. IEEE Trans. Plasma Sci. 39 (12), 3319–3325. doi:10.1109/tps.2011.2151885
Korzec, D., and Nettesheim, S. (2020). Application of a Pulsed Atmospheric Arc Plasma Jet for Low‐density Polyethylene Coating. Plasma Process. Polym. 17 (1), 1900098. doi:10.1002/ppap.201900098
Kosarev, I. N., Kindysheva, S. V., Momot, R. M., Plastinin, E. A., Aleksandrov, N. L., and Starikovskiy, A. Y. (2016). Comparative Study of Nonequilibrium Plasma Generation and Plasma-Assisted Ignition for C2-Hydrocarbons. Combustion and Flame 165 (5), 259–271. doi:10.1016/j.combustflame.2015.12.011
Kwonse, K., and Dooseuk, C. (2018). Research on the Reaction Progress of Thermodynamic Combustion Based on Arc and Jet Plasma Energies Using Experimental and Analytical Methods. J. Mech. Sci. Technol. 32 (4), 1869.
Leonov, S. B., Kochetov, I. V., Napartovich, A. P., Sabel'Nikov, V. A., and Yarantsev, D. A. (2010). Plasma-induced Ethylene Ignition and Flameholding in Confined Supersonic Air Flow at Low Temperatures. IEEE Trans. Plasma Sci. 39 (2), 781.
Matveev, I., Matveeva, S., Gutsol, A., and Fridman, A. (2005). Non-equilibrium Plasma Igniters and Pilots for Aerospace Application. Nevada: AIAA Reno, 1191.
Matveev, I. B., Matveeva, S. A., Kirchuk, E. Y., Serbin, S. I., and Bazarov, V. G. (2010). Plasma Fuel Nozzle as a Prospective Way to Plasma-Assisted Combustion. IEEE Trans. Plasma Sci. 38 (12), 3313–3318. doi:10.1109/tps.2010.2063716
Naville, A., Guye, C. E., and Guye, P. (1905). Gas Reactions at the Temperature of the Electric Arc. French Patent FR361827.
Ombrello, T., Won, S. H., Ju, Y., and Williams, S. (2010). Flame Propagation Enhancement by Plasma Excitation of Oxygen. Part II: Effects of O2(a1Δg). Combustion and Flame 157 (10), 1916–1928. doi:10.1016/j.combustflame.2010.02.004
Starikovskaia, S. M. (2006). Plasma Assisted Ignition and Combustion. Phys. D Appl. Phys. 39, 61. doi:10.1088/0022-3727/39/16/r01
Starikovskiy, A., and Aleksandrov, N. (2013). Plasma-assisted Ignition and Combustion. Prog. Energ. Combustion Sci. 39 (1), 61–110. doi:10.1016/j.pecs.2012.05.003
Takita, K., Nakane, H., and Masuya, G. (2007). Optimization of Double Plasma Jet Torches in a Scramjet Combustor. Proc. Combustion Inst. 31 (2), 2513–2520. doi:10.1016/j.proci.2006.07.054
Wagner, T. C., O'Brien, W. F., Northam, G. B., and Eggers, J. M. (1989). Plasma Torch Igniter for Scramjets. J. Propulsion Power 5 (5), 548–554. doi:10.2514/3.23188
Wang, S.-B., Yu, J.-L., Ye, J.-F., Li, G.-H., Chen, Z., Jiang, L.-Y., et al. (2019). Ignition Characteristics of Pre-combustion Plasma Jet Igniter*. Chin. Phys. B 28 (11), 114702. doi:10.1088/1674-1056/ab470e
Yin, Z., Adamovich, I. V., and Lempert, W. R. (2013). OH Radical and Temperature Measurements during Ignition of H2-Air Mixtures Excited by a Repetitively Pulsed Nanosecond Discharge. Proc. Combustion Inst. 34 (2), 3249–3258. doi:10.1016/j.proci.2012.07.015
Yu, J., He, L., Hu, Z., Zhang, Q., Xiao, Y., Jiang, Y., et al. (2018). Experimental Investigation on Ignition Limits of Plasma-Assisted Ignition in the Propane-Air Mixture. Proc. Inst. Mech. Eng. G: J. Aerospace Eng. 232 (9), 1685–1691. doi:10.1177/0954410017699000
Zhang, H.-L., He, L.-M., Chen, G.-C., Qi, W.-T., and Yu, J.-L. (2018). Experimental Study on Ignition Characteristics of Kerosene-Air Mixtures in V-Shaped Burner with DC Plasma Jet Igniter. Aerospace Sci. Tech. 74, 56–62. doi:10.1016/j.ast.2017.12.023
Zhang, S.-Y., Li, X.-S., Liu, J.-B., Liu, J.-L., Li, H.-P., and Zhu, A.-M. (2016). Dimensionless Factors for an Alternating-Current Non-thermal Arc Plasma. Phys. Plasmas 23 (12), 120707. doi:10.1063/1.4973223
Zhao, B.-b., Chen, G.-C., He, L.-M., Jin, T., and Jing, B. (2020). Experimental Investigation of Plasma Jet Ignition Characteristics in Kerosene-Air Mixtures. J. Aerosp. Eng. 33 (2), 04019113. doi:10.1061/(asce)as.1943-5525.0001108
Zhao, T.-L., Liu, J.-L., Li, X.-S., Liu, J.-B., Song, Y.-H., Xu, Y., et al. (2014). Temporal Evolution Characteristics of an Annular-Mode Gliding Arc Discharge in a Vortex Flow. Phys. Plasmas 21 (5), 053507. doi:10.1063/1.4876754
Keywords: pre-combustion igniter, plasma, discharge characteristics, arc characteristics, discharge power
Citation: Cheng W, Yu J, Jiang L, Miao Q, Zhang L and Zhao B (2022) Experimental Study on the Working Characteristics of a Pre-combustion AC Plasma Jet Igniter. Front. Energy Res. 10:879534. doi: 10.3389/fenrg.2022.879534
Received: 19 February 2022; Accepted: 21 March 2022;
Published: 04 April 2022.
Edited by:
Xiao Liu, Harbin Engineering University, ChinaReviewed by:
Yingwen Yan, Nanjing University of Aeronautics and Astronautics, ChinaHui Wang, Harbin Institute of Technology, China
Copyright © 2022 Cheng, Yu, Jiang, Miao, Zhang and Zhao. This is an open-access article distributed under the terms of the Creative Commons Attribution License (CC BY). The use, distribution or reproduction in other forums is permitted, provided the original author(s) and the copyright owner(s) are credited and that the original publication in this journal is cited, in accordance with accepted academic practice. No use, distribution or reproduction is permitted which does not comply with these terms.
*Correspondence: Jinlu Yu, eXVqaW5sdTFAMTYzLmNvbQ==