 Nana Kofi Twum-Duah
 Manar Amayri2
 Stéphane Ploix
95% of researchers rate our articles as excellent or good
Learn more about the work of our research integrity team to safeguard the quality of each article we publish.
Find out more
ORIGINAL RESEARCH article
Front. Energy Res. , 08 June 2022
Sec. Sustainable Energy Systems
Volume 10 - 2022 | https://doi.org/10.3389/fenrg.2022.874041
This article is part of the Research Topic Optimization of Energy Autonomy in Buildings With Renewable Energy Sources and Battery Storage View all 8 articles
The purpose of this paper is to provide a method for assessing the impact of direct and indirect flexibilities on the self-consumption of office buildings. The goal is to assess how both the human actors and technical interventions can affect or mitigate deviations in the self-consumption level of a building from its optimal. This paper considers the Predis-MHi platform (a living lab) as a representative case study and applies a Mixed Integer Linear Programming optimization to manage both the direct (stationary battery charging) and indirect flexibilities (Electric Vehicle charging when users plug and unplug their vehicles). Our results indicate that the potential for a building’s self-consumption improvement using indirect flexibilities does exist and can be quantified. However, this type of flexibility is highly dependent on human actors which presents a high level of uncertainty and is difficult to account for in all stages of a building’s development and use. Direct flexibilities such as stationary battery storage can be used to mitigate the undesired effects of having significant levels of indirect flexibilities on a tertiary sector building’s energy performance. The results from this study could potentially be modeled into an indicator, which would serve to influence occupant behavior towards a desired optimal.
The adoption of renewable energies has in recent years grown at an exponential rate, and this trend is expected to continue at least in the near future. The major driving factors behind this rapid adoption are environmental concerns and energy independence. However, due to their unpredictable nature, renewable energies present a myriad of problems, especially for utility operators. For small-scale production units such as rooftop PV installations (both at the residential and commercial/public building scale), a viable solution to these issues would be to consume the energy at the production point. In other words to self-consume the energy would imply a significantly reduced forecasting error (Trujillo Serrano et al., 2013).
Considering the benefits of self-consumption for both the consumer and the grid operator, many governments have incorporated and are promoting the concept of self-consumption, both individual and collective. In the case of France, self-consumption was fully ratified in 2017 (Commission de Régulation de l’énergie, 2018; Aguilera Gonzalez et al., 2019). This action provides a conduit for the development of frameworks for both individual and collective self-consumption.
Without adopting any strategies, self-consumption rates are usually on the lower end of the spectrum. In order to reap the full benefits of self-producing energy, it is therefore imperative to adopt a strategy that improves, if not maximizes the self-consumption rate of the building (or consumer). Stationary energy storage solutions are the most widely used strategy (Ciocia et al., 2021) Chemical storage is one of the most suitable and frequently adopted strategies for small-scale systems such as rooftop solar systems for a residential building. Despite, their widespread use and adoption, there are some downsides to using these chemical storage solutions. For example, the lack of regulation regarding the installation of lithium-ion batteries in public-access buildings in France may pose a potential hindrance for such use cases. Both the demand and human behavior (direct and indirect flexibilities) are additional strategies that can be implemented to complement a storage strategy to achieve optimal self-consumption for a building or within an Energy Community.
Energy Communities (ECs) as defined by the European Union (EU) are a social movement that enables participative and democratic energy process (Caramizaru and Uihlein, 2019). ECs have a key role to play, in that they bring together like-minded individuals and can directly influence the behavior of participants of the community. Additionally, various studies (Bauwens, 2014; Luthander et al., 2015) show that the addition of Renewable Energy Resources (RERs) to the energy mix both at the individual and collective level leads to a positive change in behaviors related to energy use, a consequence of users becoming more energy aware (Keirstead, 2007).
ECs by default are expected to increase RER adoption and simultaneously contribute to more desirable energy-related behaviors. ECs are expected to play a key role in the strive to achieve our energy transition objectives. An EU study of 24 ECs showed that 20 ECs were involved in generation activities, 8 ECs in electro-mobility, and 4 ECs in flexibility and storage. the same EU study also identified self-sufficiency and energy efficiency (see Figure 1) as key drivers motivating participation in energy communities, further emphasizing the role of ECs in reaching energy transition goals. ECs can therefore take advantage of their numbers (collective efforts) and positive behavioural change to actively contribute towards maximizing self-consumption at the building scale (and beyond) (Franzoi et al., 2021).

FIGURE 1. Drivers motivating participation in energy communities (24 case studies) (Caramizaru and Uihlein, 2019).
Figure 1 shows the key drivers motivating energy communities (Caramizaru and Uihlein, 2019).
Battery Electric Vehicles (BEVs) (in extension electro-mobility) are considered to be the transportation of the future. Therefore, they have been adopted and positioned by policy in most developed countries as a means to reducing carbon emissions in the transportation sector (Morgan, 2020). However, the BEVs cannot be seen as truly carbon-free without taking into consideration the charging energy source (largely nuclear for the French grid). Whilst growing BEV adoption implies a reduction in transport-related CO2 emissions, one cannot ignore the proportional growth in electricity demand and potentially additional stress on existing grid infrastructure. In countries where the energy mix is highly fossil-fuel dependent, a high EV uptake simply implies shifting the carbon emissions from the transportation sector to the electricity generation sector.
Current EU directives require that all new buildings be nearly Zero Energy buildings (nZEBs) (Bosseboeuf et al., 2015), which by definition are buildings that have high energy performance. In other words, the energy requirements of an nZEB should be covered to a significant extent by energy from renewable sources produced on-site or nearby (D’Agostino and Mazzarella, 2019). Whilst this directive is laudable, it only pushes Renewable Energy Resources to be developed closer to the consumer. The legislation however, does not warrant the consumption of the energy at the source. Indeed, buildings can be designed to be highly energy-efficient, even achieving net energy positive status. ADEME (Dubilly et al., 2016) estimates that the rooftop solar potential for France in 2050 would be approximately 1,268 TWh per annum whilst the demand would be 422 TWh (a 3 fold excess in generation) (Wurtz and Delinchant, 2017).
As both the adoption of RERs and BEVs increases, issues related to grid stability (frequency and voltage control, capacity shortages, etc.) will similarly also rise. However, these issues can be mitigated by complementary use of the two sub-systems: BEVs–the indirect flexibility and RES (Moura and de Almeida, 2010), i.e., charging EVs with energy sourced from RES at the production sites.
Office buildings present a unique opportunity for addressing the challenges that high integration of RERs (in particular Solar PV) and EVs bring to the grid. These buildings are usually used during the day when there is adequate sunlight and PV systems are producing electricity. Conversely, occupants of these office buildings who own EVs would have their EVs parked at the premises, or nearby for most periods of the day. Thus, the flexibility potential in most cases already exists.
The work described in subsequent sections of this article propose a means of quantifying a building’s available indirect flexibility potential.
Flexibilities, as considered in this article, are categorized into two main groups: direct flexibility and indirect flexibility. We define direct flexibility as devices within the global energy system that can be fully automated/controlled using software or a control signal and can significantly affect the overall performance of the global energy system (e.g., heat pumps, batteries, etc.). The indirect flexibility is then defined as actors in the global system (in this context the building or member of an EC) who cannot be controlled directly using software or control signals (Delinchant et al., 2020). The actions of these actors however, directly influences the energy performance of the global system (building or EC). Thus, the indirect flexibility mainly refers to the human actors (i.e., the human-in-the-loop) and can be influenced using alerts or suggestions (e.g., nudges (Shahid et al., 2021)). The plugging and unplugging of available EVs at a building site illustrates indirect flexibilities since the availability of the EVs for charging are subject to decisions and availability of the owner (i.e. the “Human-in-the-loop” (Wurtz and Delinchant, 2017)).
Table 1 compares the merits and demerits of the two types of flexibilities as suggested by (Delinchant et al., 2020).
As buildings become more efficient and occupants become more environment and energy-aware, the influence of indirect flexibilities (in this context connection and disconnection times of EVs at the charging stations) on a building’s energy systems cannot be ignored. While seemingly ideal, complete automation of all energy subsystems in a building is bound for failure since such a solution would not address the individual requirements of all stakeholders in that building. In the context of office/commercial buildings, EVs hold a lot of indirect flexibility potential, which can be exploited and utilized taking into account the concept of energy communities. Thus, bringing EV users together with a common goal of maximizing the use of available local RERs could potentially yield a positive behavioral response from participants. Additionally, an EC with such an objective could consequently reduce the carbon impact (i.e., the building’s carbon footprint associated with the use of grid electricity) EV users could potentially offer their availability and goodwill to follow recommendations on optimal times to plug and unplug their vehicles from the charging stations. This change in behaviour would improve the self-consumption rate and possibly reduce the carbon impact related to their energy use.
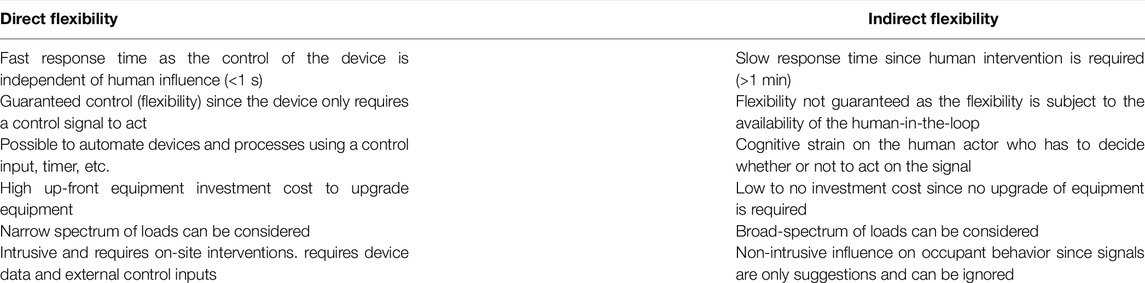
TABLE 1. Comparison of direct and indirect flexibilities (Delinchant et al., 2020).
The concept of self-consumption (of RERs) generally refers to the proportion of on-site renewable electricity production consumed at the level of a building or EC (Reynier et al., 2014). The increased adoption of RERs across Europe and the associated problems induced on the grid by a high RER penetration rate have been a driving factor for the development and adoption of self-consumption (especially for small-scale RER installations). Collective self-consumption, a subsequent concept has since emerged allowing for nearby buildings to “collectively” consume the energy from a nearby RER (in the low voltage side of the grid). Additionally, citizen collectives whose main objective is to actively participate in the energy sector (Citizens Energy Communities and Renewable Energy Communities (Frieden et al., 2020)) have emerged and are considered key in driving the transition to localized RER implementation and self-consumption.
According to (Battaglia et al., 2017), the most effective and highly considered approach to reduce the CO2 related to electrifying buildings is to combine heat pump-driven systems (thermal inertia) with solar PV systems, i.e., to increase the self-consumption using direct flexibilities. This widely accepted solution however ignores the high probability of a time mismatch between the production (solar PV) and the demand (heat pump), which could ultimately lead to a low self-consumption rate (Franzoi et al., 2021). Further (Franzoi et al., 2021), speculate that collective self-consumption in energy communities could result in “net-zero energy neighborhoods”. They propose a method for controlling the heating system of multi-family residential buildings (in this co ntext an Energy Community) in Italy. Each of the studied buildings had an inverter-driven heat pump, a buffer storage (for space heating), and thermal energy storage (for domestic hot water). The proposed control system used a two-part control strategy; one part controlling the heat pump (i.e., the primary loop) and the other part controlling the thermal units (i.e., the secondary loop). This approach maximizes the self-consumption of the buildings by utilizin g a rule-based control strategy for inverter-driven air to water heat pumps. The study finally concluded that energy communities are a possible solution for rationalizing energy consumption in buildings (however, its effectiveness is subject to acceptance by participants in the said community). Further, combining the energy communities’ concept with demand-side management (flexibility) and a rule-based control strategy could yield an improvement in self-consumption by up to 15% and conversely a load reduction of up to 12%.
Wurtz and Delinchant, (2017) indicate that using software to manage direct flexibilities in buildings without considering the implications the actions of occupants would have on the system is indeed naive and consequently not an effective approach. Building occupants, directly and indirectly, interact with all the subsystems of the building and consequently impact the energy demand of any building. Indeed, occupant behavior is one of the five key factors which affect the energy consumption of a building as identified by (De Silva and Sandanayake, 2012). Building systems represent a set of services designed for the comfort and security of occupants (often the building’s owner). As such occupants interact with and often influence the various sub-systems of a building. This makes the occupant an important consideration which needs to be accounted for in any optimizations and physical models proposed for the control of flexibilities in buildings. Wurtz and Delinchant, (2017) further indicate that the acceptance of automated systems and software by occupants is highly dependent on their ability to understand the behavior of that software or automated system. There is a high risk of rejection and possibly the development of strategies to defeat (“short-circuit) the system if this condition is not met (Wurtz and Delinchant, 2017). Hence, the authors proposed the concept of the “Human-in-the-Loop” approach.
Various studies have been conducted to devise an appropriate method of influencing indirect flexibilities (i.e., human-in-the-loop). Nilsson et al. (2014) in their works proposed and effectively used continuous feedback (displaying real-time energy consumption information) to effect a positive behavioral response. Subsequent studies have, however, shown that the impact of feedback is subject to parameters such as socio-economic status (Westskog et al., 2015), energy awareness (Keirstead, 2007), and the cost of electricity (Lin et al., 2016). Persuasive Interactive Systems (PIS) have also been shown o be an effective means of influencing human behaviour (Haller et al., 2017; Alyafi, 2019). PISs support sustainable occupant behaviour by capitalizing on the perception, understanding and action capabilities of occupants to minimize automation efforts (Silva et al., 2021; Simoiu et al., 2021). Shahid et al. (2021) have in their works also shown that using nudges (in this use case SMSs), defined by Thaler and Sunstein (2009) as any facet of choice architecture that predictably changes the behavior of individuals without eliminating any incentives or choices, is also an effective technique to influence the behavior of building occupants.
Figure 2 shows the types of energy flexibility in the experimental setup of (Shahid et al., 2021) where nudges were used to influence the behaviour of consumers by sending individuals nudge signals in the form of SMS messages. Day-ahead nudge signals followed by a reminder were sent for the expected actions, thus allowing the community ample time to process the information and act accordingly. A graphical feedback was given to each participating household after each intervention. For this experimental setup, two signals were defined:
• orange alert which signifies an increased use of thermal generation sources and requires a reduction in electricity consumption between 18:00 and 20:00 (load curtailment).
• green alert which signifies a high RER penetration thus requiring an increased consumption between 12:00 and 15:00 (load shifting).
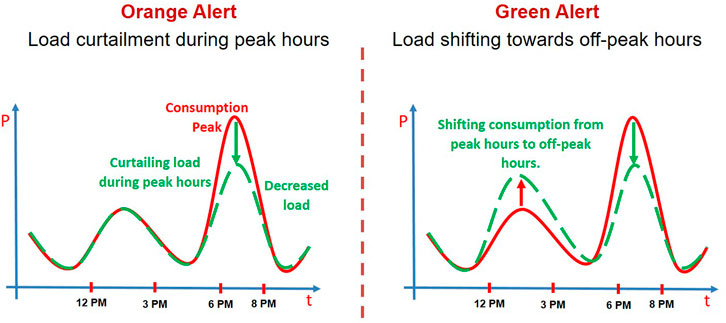
FIGURE 2. Influencing indirect flexibility in an Energy Community using nudge signals (Shahid et al., 2021).
The results show that, the behavioral science based indirect flexibility tends the pro-environment Energy Community to curtail or shift their load in accordance with the forecasted information of the electric grid within their default commitment. However, no sign of habit formation can be deduced from the results of this experiment.
Whilst flexibility and emerging concepts like collective self-consumption are effective and cheap to implement (usually costs close to nothing if no capital expenditure is expected), the use of battery storage is also instrumental in achieving higher self-consumption rates. This is especially the case in the residential sector where there is usually a mismatch between solar PV production and the demand. Additionally, the improvements in storage technologies and the falling cost of acquiring the batteries make them an attractive choice for improving self-consumption. In some economies, batteries have reached grid parity (Barzegkar-Ntovom et al., 2020). Hence, barring any financial and CO2 constraints (from grey energy) battery storage is a viable strategy for optimizing self-consumption.
Castillo-Chavez et al. (2002) in their work studied the potential of using Active Demand Side Management (ADSM) and storage to optimize self-consumption in residential buildings. The underlying concept was to identify deferrable loads (appliances whose demand could be displaced along the day) and non-deferrable loads. The direct flexibility from the identified deferrable loads are then used to achieve maximum self-consumption (Castillo-Chavez et al., 2002; Pinamonti et al., 2021). Indeed, these studies did indicate a significant improvement using the combined strategies. However, the application of this approach is limited to stationary household appliances, which are in most cases not present in office buildings. Additionally, previous studies predict a decrease in energy consumption (partly due to improved energy efficiency and energy conservation measures). In this regard, EVs present a unique opportunity, in that the energy demand from EVs is expected to grow in the coming years.
The Vehicle to Home (V2H) concept, the use of the storage capacity of BEVs as direct flexibility at the household level to optimize energy bills (San Román et al., 2011), is an effective method at reducing the electricity bill of residential buildings (Dargahi et al., 2014). Additionally, implementing schemes such as V2B implies increasing the usage of the otherwise underutilized electric storage of BEVs especially since privately owned vehicles are estimated to be parked 95% of the time.
MILP optimizers have been used in several approaches related to the optimization of energy systems. MILP optimizers have proven to be effective and reliable in solving optimization problems related to energy systems. Unlike other non linear approaches, MILP guarantees convergence and ultimately produces a global optimum solution (thanks to the convexity of a linear problem) (Elsido et al., 2017). Arcuri et al. (2015) stipulate that MILP problems are infeasible only when the problem is unbounded in the direction of the optimal solution or when some given constraints contradict each other (i.e., bad problem definition). However, since MILP problems by definition must be linear, MILP approaches are able to take into account non linear phenomena using integers. Thus parameters such as efficiency (which in many energy systems changes with regards to the current state of the system) must be kept constant, an issue that can be addressed using a decomposition strategy (Urbanucci, 2018). Additionally, Urbanucci (Urbanucci, 2018) indicates that MILP optimizations dealing with synthesis or design problems require that the entire time horizon be optimized at once. Several solutions exist to tackle this issue, these include but are not limited to simulation period reduction (Fazlollahi et al., 2014), decomposition methods (Yokoyama et al., 2002), and the sliding window technique (this solution is usually applied to scheduling problems) (Stadler et al., 2016).
Previous approaches to tackle this issue of mismatch between the load and local RER production have focused on residential buildings and their direct flexibilities (e.g., water heaters, washing machines, heat pumps, etc.), with the major focus being on thermal inertia. Our work takes into account EVs, which fall into the category of indirect flexibilities (plugging and unplugging of the EVs), and proposes a method for assessing the available potential from such indirect flexibilities. The decisions of EV owners have a measurable and quantifiable impact on the global performance of a building’s energy system. Additionally, the behavior of drivers concerning the use of the limited available charging space could also have a direct impact on the available indirect flexibility. The work in this article provides a first insight into the impact of both human behavior (the indirect flexibility) and technical interventions (the direct flexibility–stationary storage for this use case) have on the self-consumption rate of a building. The contributions of this paper are as follows:
• A method for introducing indirect flexibility in the energy management strategy of a building
• An assessment of the impact of available indirect flexibility on an office building’s self-consumption.
• An insight into how direct flexibilities affect the use and impact of indirect flexibilities on a building’s energy performance.
For this study, we propose a Mixed Integer Linear Programming (MILP) approach to optimize three scenarios (i.e., direct flexibility only, indirect flexibility only and a hybrid of both flexibilities) with two objective functions:
• To minimize the CO2 footprint (carbon impact) related to the use of the electric grid.
• To maximize the self-consumption of the building.
The results from optimizing these six scenarios are then compared in terms of self-consumption and carbon impact, thus providing a means of quantifying the available indirect flexibility potential (charging of EVs) of the building.
The Grenoble Energy-Education and Research (GreEn-ER) building, which houses the school of Water, Environment, and Energy (ENSE3) of Grenoble Institute of Technology and the Grenoble Electrical Engineering Laboratory (G2ELab) is a smart building located in the Presqu’île district of Grenoble. The Presqu’île district is an eco-district being developed in the Grenoble Metropolitan area with a goal of 30% energy reduction in comparison to current thermal regulations in France (Ville de Grenoble, 2021). GreEn-ER is a 5-story building with each floor having a surface area of 4500 m2 with an average occupancy of 2000 people (Delinchant et al., 2016)]. For this study, we consider the Predis-MHI platform, which is a platform, dedicated to the study of building occupant behaviors and advancement of the smart building concept. The platform was developed to achieve Net Zero Energy Building (NZEB) status and is used as a living lab for both teaching and research activities (Delinchant et al., 2016).
The Predis-MHI platform has a floor area of 600 m2 that is made up of lecture rooms, a demonstration room, a student’s foyer, and offices located on multiple floors of the building, as well as EV charging stations positioned within the perimeter of the campus, see Figure 3A. A 22 kWp (Photowatt, 2014; SMA, 2022) solar PV system is the only on-site RER supplying the demand of the platform (and the building). However, there are other energy sources on-site such as a combined heat and power plant which is also capable of heating the platform. The demand of the platform is made up of lighting, Heating Ventilation and Air-Conditioning (HVAC), electrical outlets, and the EV charging stations. For this study, the platform is considered as an office building. Figure 3B shows the electrical layout of the platform as used in this study.
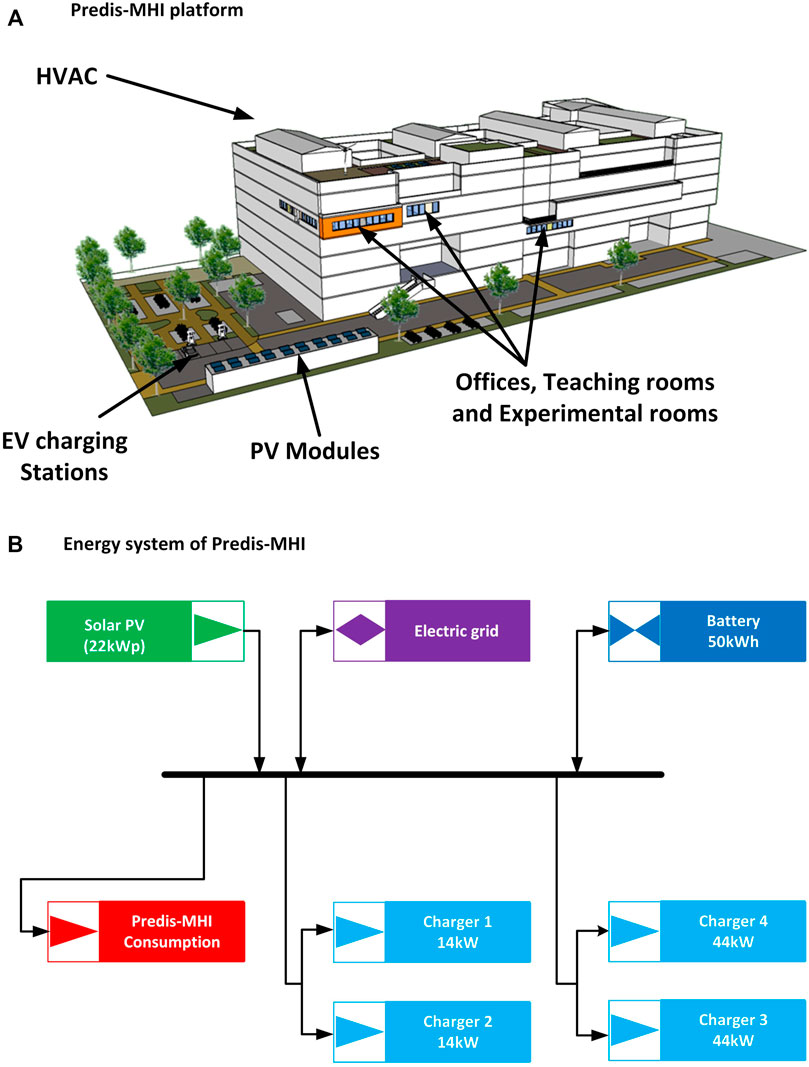
FIGURE 3. The Predis-MHI platform (A): Pictorial depiction of GreEn-ER building showing the Predis-MHi platform (Delinchant et al., 2016) (B): Electricity system of the Predis-MHI (represented using OmegAlpes graphical representation (Hodencq et al., 2021a)) system.
Data related to the consumption and PV production profiles of the Predis-MHI platform was sourced from the Building Management System (BMS) of GreEN-er. Additionally, data related to grid CO2 emissions was sourced from the French transmission system operator–RTE (RTE, 2021). The CO2 data does not take into account the embodied emissions (i.e., emissions related to the construction of grid infrastructure and the extraction and transportation of fuel). The study considers hourly data from the period 1st January 2020 to 31st December 2021 (2 years). The platform is considered to be a building for the purpose of this study and is hereafter referred to as the building.
Table 2 provides a summary of the data used for the study, the annual demands (for Predis and EV charging stations) is significantly lower in 2020 as compared to 2021. This disparity in the consumption can be attributed to the extended periods during which the building was unoccupied due to COVID-19 restrictions.
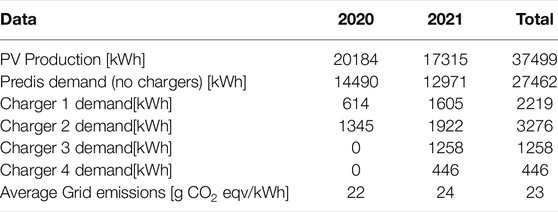
TABLE 2. Summary of the Predis-MHI data.
Since the sensors used for data capture are industrial-type cumulative energy meters with a rather low resolution of 1 kWh, some irregularities in the charging data (Chargers 1 and 2) were identified as depicted in Figure 4. These high peaks (outliers) were the result of the loss of communications between the sensor and the BMS. After communications are restored, the accumulated energy value is transmitted to the BMS, accounting for these periods with charging values higher than the nominal rated power of the charging stations. Also due to the resolution of the sensors, the idling demand (stand-by consumption) of the chargers are reflected as 1 kWh charging instances (this is a non-controllable consumption).
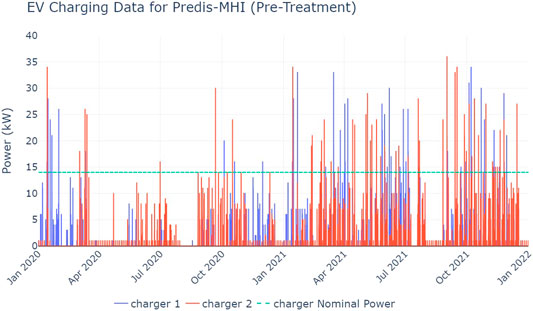
FIGURE 4. EV charging data with errors (pre-processing).
The charging data thus required some processing to eliminate the outliers identified as well as the idling demand. For the peaks above the nominal rated power of the chargers, a simple yet effective strategy was employed - consumption above the nominal charger capacity of 14kW were displaced over the previous 3 h. Figure 5A shows the mean hourly load whilst 5B shows the frequency of charging before and after data treatment. From Figures 5A,B, it is observed that the general shape of both the frequency and load factor curves (ratio of hourly average load to peak load, during the operating hours of the building) are preserved post-data treatment, indicating that the data treatment should not significantly alter the results.
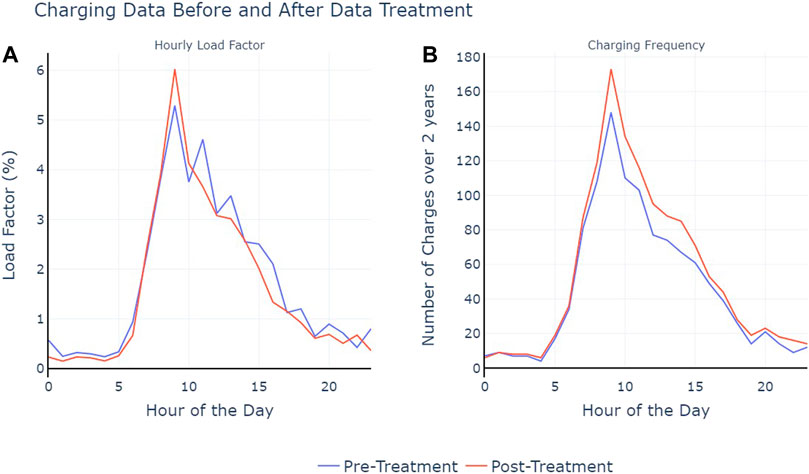
FIGURE 5. Analysis of charging data before and after data processing (A): the mean hourly charging power and (B): the frequency of charging before and after data treatment.
To allow for further improvements, this article follows the Open and Reproducible Use Cases for Energy (ORUCE) principles (Hodencq et al., 2021b). The data used and associated notebooks are available online and can be modified and used for different use cases and scenarios.
To get some insight into the charging patterns of EV drivers, we make a plot of the usage patterns of the EV chargers versus the average annual PV production (show in red with right side y-axis) recorded at the site (Figure 6A) and the EV plug-in time (Figure 6B). From Figure 6, the charging of EVs happens predominantly between 9:00 and 11:00 (see Figure 6A), on the other hand, however, the energy production from the PV system peaks between 12:00 and 15:00. Thus, it can be deduced that most EV drivers plug in their vehicles when they arrive in the morning, a behavior that can be deemed as sub-optimal. Additionally, some flexibility potential does exist, implying that the self-consumption of the building can be improved by simply adjusting the charging times of EVs (i.e. modifying human behavior).
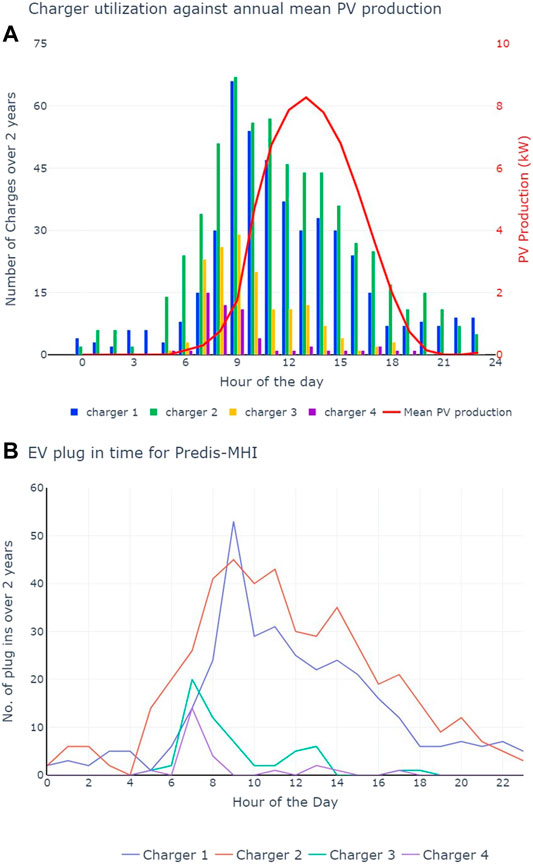
FIGURE 6. Overview of charging behaviour (A) Charger utilization against annual mean PV production (B) EV plug-in time for Predis-MHI.
Figure 6 also shows that some amount of charging takes place outside the operation hours of the GreEN-ER building (8:00–20:00). The nighttime charging, between 20:00 and 00:00, can be attributed to the charging of the school’s EV by staff members who may have returned the vehicle and plugged it in just before the closure of the building at 20:00. Charging activity at dawn, which has the least frequency of occurrence (approximately 5.01% for charging station 1 and 3.14% for charging station 2), is largely due to the communication failure previously mentioned.
Figure 7A shows a plot of the annual average PV production and the annual average demand whilst Figures 7B,C show the average monthly production and load curves for June and December respectively (see Supplementary Material for all months). The average demands depicted in Figure 7 is the demand of the building without the EV charging demand. Figure 7A indicates that on average there is a large proportion of the solar PV energy that is not self-consumed. This is however not the case during the winter months as shown in Figure 7C. Thus, considering the charging patterns of EV drivers (Figure 6) and the excess PV there is a justifiable cause to use both the battery storage and flexibility to maximize the self-consumption rate of the building (particularly in the summer months - see supplementary data).
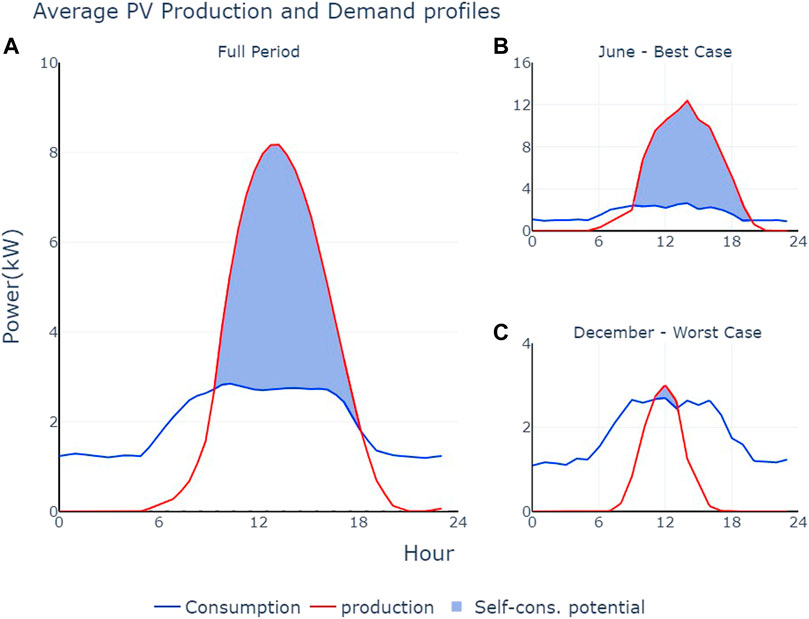
FIGURE 7. Self-consumption potential for predis-MHI (A): Full period (B): Best case–June (C) Worst case–December.
Finally, we analyzed the monthly average load factor of the EV chargers (see Figure 8) to show the charger utilization trends during the evaluation period. From Figure 8 we can see that the average load factor of the chargers increased with time, indicating an increased uptake of EVs by the users of the GreEN-ER building. The load factor is exceptionally low during August because of the closure of the building for holidays.

FIGURE 8. Monthly mean load factor of the EV Chargers.
Excluding the base case (before any optimization is applied), we consider two objective functions and apply these objective functions to three scenarios, thus resulting in six scenarios that are detailed as follows:
• Indirect–maximize self-consumption (INDSC) and Indirect–minimize CO2 (INDCO2) are intended to indicate the available potential of the available indirect flexibility of EV charging stations. The two scenarios do not, therefore, consider the 50 kWh stationary battery storage. The plugging and unplugging of the EVs (i.e., the indirect flexibility) is optimized based on the objective function defined–minimize the CO2 from the grid or to maximize the self-consumption of the building.
• Direct–maximize self-consumption (DIRSC) and Direct–minimize CO2 (DIRCO2) provide an indication of the magnitude of gain associated with the use of the direct flexibility (i.e., the 50 kWh battery) as a strategy to reach the defined objective function. These scenarios thus maintain the historical demand curves for the EV charging stations and only optimize the usage (charging and discharging) of the stationary storage system to achieve either maximum self-consumption or minimum operational CO2.
• Indirect + Direct–maximize self-consumption (HYBSC) and Indirect + Direct–minimize CO2 (HYBCO2) are hybrid scenarios; they exploit both the direct and indirect flexibility (batteries and EV charging) to achieve the defined objective function.
Table 3 provides a summary of the considered scenarios.
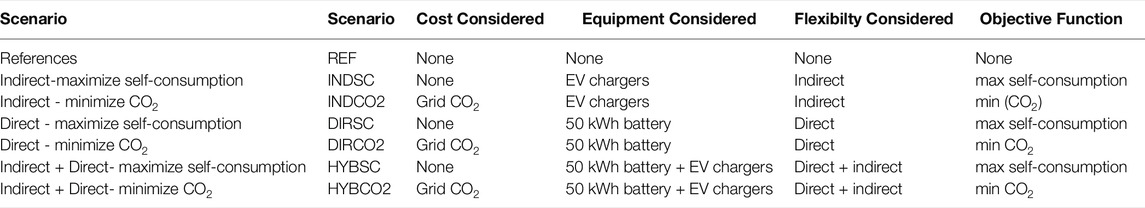
TABLE 3. Summary of Predis-MHI data.
For all the scenarios discussed in Section 5.6 above, the following assumptions were considered:
• A sliding window optimization with a horizon of 1 day (24 h)
• If the charging of EVs is considered flexible and is to be optimized (optimal plug and unplug times), the optimizer must ensure that the energy consumed at each charger for the horizon of 1 day (24 h) is the same as was consumed for that period in the collected historical data. This was to ensure that the optimized scenarios were comparable to the reference case.
Similarly, the technical parameters presented in Table 4 were used for the optimizations:
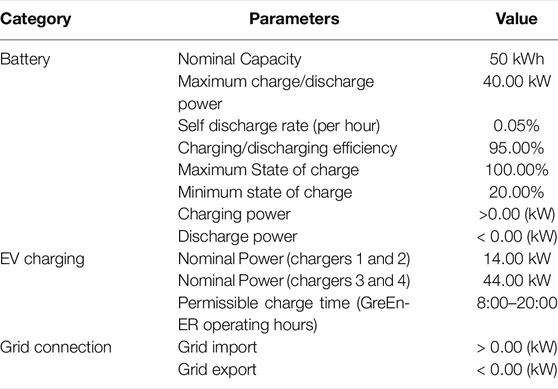
TABLE 4. Summary of technical parameters used in MILP optimization.
The proposed MILP optimization approach satisfies all operational constraints and ensures that batteries are not used in a manner that would promote rapid deterioration.
Given the data and parameters described in Section 5.7 above the 2 objective functions were defined as follows:
• To minimize the CO2 related to the consumption of grid energy
where:
– CO2Total is the total emissions related to the energy imported from the grid
– Pimport is the power imported from the grid at time step t
– CO2grid is the emissions related to the consumption of grid energy in kgco2 eqv/kWh at time step t.
The formulation does not take into account the CO2 emissions reduction due to the export of excess PV production (Pexports(t)). Including this reduction in the optimization would consequently lead to export having a higher priority and consequently (in the presence of suitable conditions) lead to a lower self-consumption rate relative to the reference case.
• To maximize the self-consumption:
where:
– Egrid refers to the sum of total energy exported and imported to and from the grid
– Pimport refers to the power exported from Predis-MHI onto the grid at time t.
By minimizing the net grid energy, we maximize the locally consumed energy and reduce the degree of freedom the export power parameter has. This formulation avoids undesired operational behavior (e.g., cycling the export and battery charging).
To ensure that the energy system was utilized in an effective and technically feasible manner, the optimization was subject to the following constraints:
• To ensure that the battery state of charge stayed within the defined boundaries of 20–100%:
where SOCMin × Batterycapacity and SOCMax × Batterycapacity refers to the to the minimum and maximum allowed battery energy respectively and Ebat(t) is the electric charge in the battery (given in kWh) at time step t and is given by:
where T is the last time step in the set
• To ensure that battery charging/discharging did not exceed the set maximum value.
such that
• For the charging of the EVs:
where
Topen and Tclose refer to the opening and closing times of the GreEN-ER building respectively.
• To ensure that the batteries will not be charged with electricity from the grid:
• Lastly, to ensure a net energy balance in the energy system
In addition to the above equations, the self-consumption indicator as used for this study is defined mathematically as:
where ξ(t) refers to the losses in the energy system and
Figure 9 shows the summary of the annual results for the various scenarios; 9A is the annual self-consumption rate and 9B is the annual carbon impact of the building. From the results depicted in Figure 9, there exists a significant difference between the results of 2020 and 2021. This difference is due to the COVID-19 related restrictions (lockdown, mandatory teleworking and online classes) in France which were highest in 2020. Further examining Figure 9A, it can be seen that Indirect–minimize CO2, Direct–minimize CO2 and Indirect + Direct–minimize CO2 scenarios (i.e., (INDCO2, DIRCO2 and HYBCO2) which had the objective function of minimizing grid emissions (Eq. 1) resulted in a significant increase in the self-consumption rates with respect to the reference case.
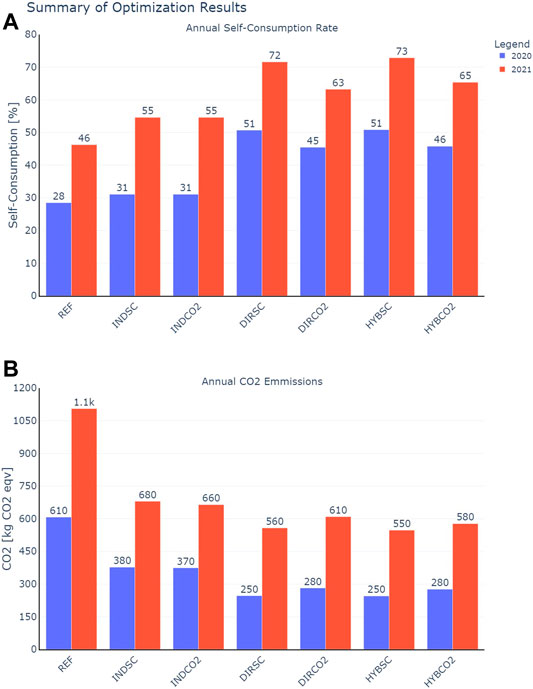
FIGURE 9. Summary of Optimization results. (see Table 3 for x-axis interpretation). (A) Annual self-consumption rates, (B), Annual carbon impact.
The Indirect + Direct–maximize self-consumption and Direct–maximize self-consumption scenarios (i.e., HYBSC and DIRSC) yielded the highest and second-highest self-consumption rates respectively (51% for the year 2020 and 73 and 72% for the 2021 evaluation period respectively). From the Indirect–maximize self-consumptionscenario (INDSC), it is possible to however deduce that there exists a potential to increase the self-consumption of the building by 3% in 2020 and 9% in 2021.
The difference in the self-consumption results from the Direct–maximize self-consumption scenarios and the Indirect + Direct–maximize self-consumption scenario (DIRSC and HYBSC respectively), however, shows that the self-consumption potential which could be realized from the EVs is absorbed by the battery system. This is largely because the battery was sized without accounting for the flexibility available from charging EVs. Thus the battery system is adequately sized for the load of the building (considering the historical data only) but is oversized if the EVs are to be used for flexibility.
Similarly, the carbon intensity of the building’s consumption is lowest for the scenarios with self-consumption as an objective despite having an objective function to maximize self-consumption (Eq. 2). The relatively higher carbon intensity results from the carbon emissions scenarios can be attributed to the efficiency of the battery, which resulted in the optimizer avoiding the use of the battery and favoring export and as such yields a higher carbon intensity than was realized in the self-consumption scenarios. Comparing the charging of EVs in the Indirect–maximize self-consumption and Indirect + Direct–maximize self-consumption scenarios (INDSC and HYBSC) which both have an objective function to maximize self-consumption) in terms of the hourly charge frequency and load factor, Figure 10B shows that for the Indirect–maximize self-consumption (INDSC) where only the indirect flexibility was considered, there is a significant increase in the charging between 11:00 and 16:00. This is also true for Indirect + Direct–maximize self-consumption (HYBSC). However, the peak is smaller for Indirect + Direct–maximize self-consumption (HYBSC), primarily because the batteries can cater to some of the EV charging demand. Similarly, from Figure 10A, the hourly average load factor of the chargers improved by approximately 1.0–3.0% in the case of the Indirect - maximize self-consumption (INDSC) and 0.1–2.0% in the case of Indirect + Direct–maximize self-consumption (HYBSC). Additionally, Figure 10 indicates that 08:00 is a favorable time to charge however, in reality, this is not the case, see Figures 6, 7. This “false peak” is due to frequent charging at 08:00 being recommended by the optimizer on days (usually winter days) when the fixed consumption of the building is greater or equal to the PV production (i.e., the time of charge has no impact on the self-consumption rate).
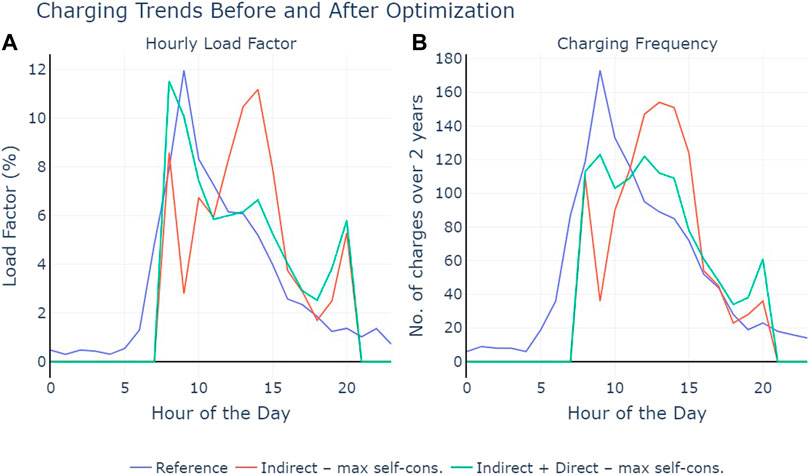
FIGURE 10. Comparison of Optimization results and reference scenario. (A) Hourly load factor, (B) Charging frequency.
As mentioned in Section 7.1 the 50 kWh battery absorbs the potential gains of the indirect flexibility. Also, considering that the year-on-year growth rate of EV charging in 2021 was estimated to be at a rate of 110% of the 2020 demand. A parametric study was conducted using the Indirect + Direct–maximize self-consumption scenario (since it proved to be the most effective) to evaluate the variation of the building’s self-consumption to the available indirect flexibility The growth in demand was achieved by multiplying the EV charging demand by a coefficient of growth (between 1 and 5 considered). Further, to reach a feasible solution, especially in the case of high growth coefficients, 2 charging stations with a nominal rated power of 44 kW each were added to the energy system of the building (in fact, this is now the case at Predis-MHI).
Figure 11 shows the results of the parametric study on the effect of increasing EV demand on the self-consumption indicator.From Figure 11, it is observed that the 2020 self-consumption curve continues to increase as the growth coefficient increases (largely due to the fact that the demand of 2020 is significantly smaller than that of 2021). For the 2021 curve however, the curve begins to plateau after a coefficient of 3. The 2 curves, generally show the same trend, however, since the EV demand was significantly less in 2020 (about half of 2021s demand) the saturation point (coefficient for which the gain in self-consumption is not significant) is not very apparent from this curve. Thus given the current energy system, and the annual growth rate of 2.1, the impact of the indirect flexibility on the building’s self-consumption would become more measurable in the near future.
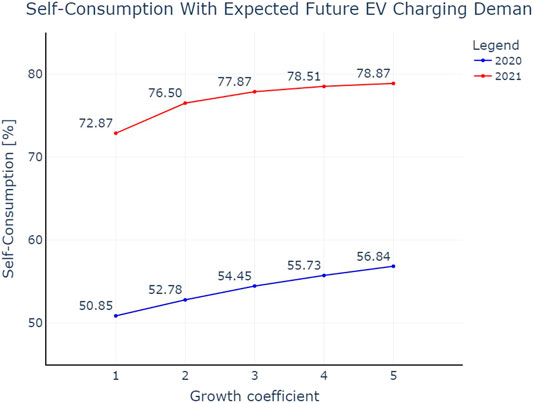
FIGURE 11. Variation of Self-consumption with increasing EV charging demand.
Most technical constraints were accounted for in the proposed MILP model, thus ensuring a technically and physically, and feasible scheduling of all energy sub-systems in the building. This work is, however, based on the fundamental assumption of optimal human behavior (from the EV users). However, in reality, the behaviour of human actors is not a deterministic parameter.
This study did not discount the building’s carbon impact using the exported energy from the solar PV. The objective is to study how direct and indirect flexibilities can be used to reduce net energy exchange with the grid, discounting the carbon impact (when the objective is to minimize CO2) using the exported energy would result in export being a favourable choice (given the right conditions). The carbon impact presented in Figure 9 can therefore be described as conservative, and only shows the CO2 associated with the energy consumed by the building (i.e., the carbon impact is the product of the grid carbon intensity and the imported energy of the building).
Additionally, the study doesn’t consider the grey CO2 associated with the battery (embodied CO2 of the batteries expressed over the projected life cycle of the battery). The aging of the batteries (i.e., the State of Health) of the batteries are also not accounted for.
Further work is required to determine the extent to which the human-in-the-loop can be influenced towards an optimal behaviour, the best type of signalling to use (test messages, push notifications etc). Since energy communities have been identified as a means of influencing human behavior, work needs to be carried out on defining the framework for an energy community of EV users (such as has been presented in this work). As highlighted in Section 7.1, the battery without consideration for the available indirect flexibility, thus a stationary battery sizing approach which takes into account the potential available from indirect flexibilities is also needed.
The study provided a method for assessing the potential impact of indirect flexibility (EV charging in this case) on the self-consumption of an office building (or an energy community). The results show that the indirect flexibility could potentially increase self-consumption rates of the building significantly (approximately 9% in this 2021) and consequently reduce the carbon impact of the buildings energy use (approx 38.2% reduction with respect to the reference). Interestingly, these benefits can be achieved with no additional financial and carbon cost for the building and its users. The results also show that maximizing the self-consumption has a two-fold effect,i.e. it improves the self-consumption and effectively minimizes the building’s carbon impact. In most cases, the reduction of the carbon footprint was comparable if not better than minimizing the grid carbon impact, however, for all scenarios considered this approach did not match up to the self-consumption objective in terms of the self-consumption indicator.
Further, the study showed that direct flexibilities (despite their drawbacks) could be used to compensate for the undesirable behaviors associated with human actors. The life-cycle costs and environmental impact associated with such technical interventions need to be taken into account to ensure that the global energy system remains environmentally friendly. The positive behavioural response associated with belonging to an Energy Community could potentially minimize (if not eliminate) the need for direct flexibilities in the context of increasing self-consumption.
Publicly available datasets were analyzed in this study. This data and associated code can be found here: https://gricad-gitlab.univ-grenoblealpes.fr/NanaKofi/predis_indirect_flexibility.
All authors listed have made a substantial, direct, and intellectual contribution to the work and approved it for publication.
This work was funded and supported by ADEME RETHINE, CARNOT Interebat and ORCEE and the interdisciplinary project IDEX Eco-Sesa (see: eco-sesa), itself supported by ANR project ANR-15-IDEX-02.
The authors declare that the research was conducted in the absence of any commercial or financial relationships that could be construed as a potential conflict of interest.
All claims expressed in this article are solely those of the authors and do not necessarily represent those of their affiliated organizations, or those of the publisher, the editors and the reviewers. Any product that may be evaluated in this article, or claim that may be made by its manufacturer, is not guaranteed or endorsed by the publisher.
The Supplementary Material for this article can be found online at: https://www.frontiersin.org/articles/10.3389/fenrg.2022.874041/full#supplementary-material
Aguilera Gonzalez, A., Bottarini, M., Vechiu, I., Gautier, L., Ollivier, L., and Larre, L. (2019). “Model Predictive Control for the Energy Management of A Hybrid PV/Battery/Fuel Cell Power Plant,” in SEST 2019 - 2nd International Conference on Smart Energy Systems and Technologies (IEEE). doi:10.1109/SEST.2019.8849051
Alyafi, A. A. (2019). Generation of Explanations for Energy Management in Buildings. Ph.D. thesis. Grenoble: Université Grenoble Alpes.
Arcuri, P., Florio, G., and Fragiacomo, P. (2015). Optimal Design of a Small Size Trigeneration Plant in Civil Users: A MINLP (Mixed Integer Non Linear Programming Model). Energy. 80, 628–641. doi:10.1016/j.energy.2014.12.018
Barzegkar-Ntovom, G. A., Chatzigeorgiou, N. G., Nousdilis, A. I., Vomva, S. A., Kryonidis, G. C., Kontis, E. O., et al. (2020). Assessing the Viability of Battery Energy Storage Systems Coupled With Photovoltaics Under a Pure Self-Consumption Scheme. Renew. Energ. 152, 1302–1309. doi:10.1016/j.renene.2020.01.061
Battaglia, M., Haberl, R., Bamberger, E., and Haller, M. (2017). Increased Self-Consumption and Grid Flexibility of PV and Heat Pump Systems With Thermal and Electrical Storage. Energ. Proced. 135, 358–366. doi:10.1016/j.egypro.2017.09.527
Bauwens, T. (2014). What Roles for Energy Cooperatives in the Diffusion of Distributed Generation Technologies? SSRN J. 7, 1–29. doi:10.2139/ssrn.2382596
Bosseboeuf, D., Gynther, L., Lapillonne, B., and Pollier, K. (2015). Energy Efficiency Trends and Policies in the Household and Tertiary Sectors. Tech. Rep. June, Eur. Comm., 1–97. Available at: https://www.odyssee-mure.eu/publications/archives/energy-efficiency-trends-policies-buildings.pdf
Caramizaru, A., and Uihlein, A. (2019). Energy Communities : An Overview of Energy and Social Innovation. Tech. Rep., Jt. Res. Centre (Jrc) Eur. Comm., 1–54. doi:10.2760/180576
Castillo-Chavez, C., Blower, S., van den Driessche, P., Kirschner, D., and Abdul-Aziz, Y. (2002). Mathematical Approaches for Emerging and Reemerging Infectious Diseases: Models, Methods, and Theory. IMA Volumes Mathematics tis Appl. 126, 368. doi:10.1007/978-1-4613-0065-6
Ciocia, A., Amato, A., Leo, P. D., Fichera, S., Malgaroli, G., Spertino, F., et al. (2021). Self-Consumption and Self-Sufficiency in Photovoltaic Systems: Effect of Grid Limitation and Storage Installation. Energies 14, 1591. doi:10.3390/en14061591
Commission de Régulation de l’énergie (2018). Self-consumption. Available at: https://www.cre.fr/en/Energetic-transition-and-technologic-innovation/Self-consumption.
D'Agostino, D., and Mazzarella, L. (2019). What Is a Nearly Zero Energy Building? Overview, Implementation and Comparison of Definitions. J. Building Eng. 21, 200–212. doi:10.1016/j.jobe.2018.10.019
Dargahi, A., Ploix, S., Soroudi, A., and Wurtz, F. (2014). Optimal Household Energy Management Using V2H Flexibilities. COMPEL - Int. J. Comput. Mathematics Electr. Electron. Eng. 33, 777–792. doi:10.1108/COMPEL-10-2012-0223
De Silva, M. N. K., and Sandanayake, Y. G. (2012). “Building Energy Consumption Factors: A Literature Review and Future Research Agenda,” in World Construction Conference 2012 (Colombo), 90–99.
Delinchant, B., Ferrari, J., Laranjeira, T., Wurtz, F., Roussillon, B., and Llerena, D. (2020). “Expérimentation de mécanismes d’incitations de flexibilité énergétique auprès d’employés d’un bâtiment tertiaire,” in Conférence Francophone de l’International Building Performance Simulation Association (Reims).
Delinchant, B., Wurtz, F., Ploix, S., Schanen, J.-L., and Marechal, Y. (2016). “GreEn-ER Living Lab - A Green Building with Energy Aware Occupants,” in 5th International Conference on Smart Cities and Green ICT Systems (SMARTGREENS (Rome: SCITEPRESS), 316–323. doi:10.5220/0005795303160323
Dubilly, A.-L., Fournier, L., Chiche, A., Faure, N., Bardet, R., Alais, J.-C., et al. (2016). A 100% Renewable Electricity Mix? Analyses and Optimisations Testing the Boundaries of Renewable Energy-Based Electricity Development in Metropolitan France by 2050. Tech. Rep. Angers: ADEME - Agence de l’Environnement et de la Maîtrise de l’Energie.
Elsido, C., Bischi, A., Silva, P., and Martelli, E. (2017). Two-stage MINLP Algorithm for the Optimal Synthesis and Design of Networks of CHP Units. Energy. 121, 403–426. doi:10.1016/j.energy.2017.01.014
Fazlollahi, S., Becker, G., and Maréchal, F. (2014). Multi-Objectives, Multi-Period Optimization of District Energy Systems: II-Daily thermal Storage. Comput. Chem. Eng. 71, 648–662. doi:10.1016/j.compchemeng.2013.10.016
Franzoi, N., Prada, A., Verones, S., and Baggio, P. (2021). Enhancing Pv Self-Consumption through Energy Communities in Heating-Dominated Climates. Energies. 14, 4165. doi:10.3390/en14144165
Frieden, D., Tuerk, A., Neumann, C., D’Herbemont, S., and Roberts, J. (2020). Collective Self-Consumption and Energy Communities : Trends and Challenges in the Transposition of the EU Framework. Technical Report., 1–50. doi:10.13140/RG.2.2.25685.04321
Haller, H., Nguyen, V.-b., Debizet, G., Laurillau, Y., Coutaz, J., and Calvary, G. (2017). “Energy Consumption in Smarthome : Persuasive Interaction Respecting User’ S Values,” in 9th IEEE International Conference on Intelligent Data Acquisition and Advanced Computing Systems (Bucharest: IEEE), 804–809. doi:10.1109/idaacs.2017.8095199
Hodencq, S., Brugeron, M., Fitó, J., Morriet, L., Delinchant, B., and Wurtz, F. (2021a). OMEGAlpes, an Open-Source Optimisation Model Generation Tool to Support Energy Stakeholders at District Scale. Energies. 14, 5928. doi:10.3390/en14185928
Hodencq, S., Delinchant, B., and Wurtz, F. (2021b). “Open and Reproducible Use Cases for Energy (ORUCE) Methodology in Systems Design and Operation : a Dwelling Photovoltaic Self-Consumption Example to Cite This Version : HAL Id : Hal-03341883,” in Building Simulation 2021 (Bruges).
Keirstead, J. (2007). Behavioural Responses to Photovoltaic Systems in the UK Domestic Sector. Energy Policy. 35, 4128–4141. doi:10.1016/j.enpol.2007.02.019
Lin, J., Li, N., Ma, G., and Zhou, J. (2016). “The Impact of Eco-Feedback on Energy Consumption Behavior: A Cross-Cultural Study,” in ISARC 2016 - 33rd International Symposium on Automation and Robotics in Construction (Alabama), 274–281. doi:10.22260/isarc2016/0034
Luthander, R., Widén, J., Nilsson, D., and Palm, J. (2015). Photovoltaic Self-Consumption in Buildings: A Review. Appl. Energ. 142, 80–94. doi:10.1016/j.apenergy.2014.12.028
Morgan, J. (2020). Electric Vehicles: The Future We Made and the Problem of Unmaking it. Cambridge J. Econ. 44, 953–977. doi:10.1093/cje/beaa022
Moura, P. S., and de Almeida, A. T. (2010). Multi-objective Optimization of a Mixed Renewable System with Demand-Side Management. Renew. Sustainable Energ. Rev. 14, 1461–1468. doi:10.1016/j.rser.2010.01.004
Nilsson, A., Bergstad, C. J., Thuvander, L., Andersson, D., Andersson, K., and Meiling, P. (2014). Effects of Continuous Feedback on Households' Electricity Consumption: Potentials and Barriers. Appl. Energ. 122, 17–23. doi:10.1016/j.apenergy.2014.01.060
Photowatt (2014). The High Quality Module. Available at: https://www.climasoft.ro/cs-content/cs-docs/8714-1585230139.pdf.
Pinamonti, M., Prada, A., and Baggio, P. (2021). “Demand Side Management and Battery Storage Utilization to Demand Side Management and Battery Storage Utilization to Increase PV Self-Consumption of a Modulating Heat Pump Increase PV Self-Consumption of a Modulating Heat Pump,” in 6th International High Performance Buildings Conference at Purdue (West Lafayette: Purdue University).
Reynier, L., Cosnier, M., Visier, J., Pele, C., and Quenard, D. (2014). Proposition d ’ indicateurs et d ’ un référentiel définissant la maison à énergie positive. Tech. Rep. Paris: Centre Scientifique et Technique du Batiment CSTB.
San Román, T. G., Momber, I., Abbad, M. R., and Sánchez Miralles, Á. (2011). Regulatory Framework and Business Models for Charging Plug-In Electric Vehicles: Infrastructure, Agents, and Commercial Relationships. Energy Policy 39, 6360–6375. doi:10.1016/j.enpol.2011.07.037
Shahid, M. S., Delinchant, B., Roussillon, B., Frederic, W., Llerena, D., Fadhuile, A., et al. (2021). “Designing and Experimenting Nudge Signals to Act on the Energy Signature of Households for Implementing Indirect Energy Flexibility,” in Building Simulation 2021 (Bruges: International Building Performance Simulation Association).
Silva, J. B., Amayri, M., Ploix, S., Reignier, P., and Silva, C. S. (2022). Cooperative and Interactive Learning to Estimate Human Behaviours for Energy Applications. Energy and Buildings 258, 111727. doi:10.1016/j.enbuild.2021.111727
Simoiu, M. S., Fagarasan, I., Ploix, S., Calofir, V., and Iliescu, S. S. (2021). “General Considerations about Simulating Energy Communities,” in 11th IEEE International Conference on Intelligent Data Acquisition and Advanced Computing Systems (Cracow: IEEE), 1126–1131. doi:10.1109/idaacs53288.2021.9661053
SMA (2022). SUNNY TRIPOWER 20000TL.. Available at: https://files.sma.de/downloads/STP15-25TL-30-DS-en-41.pdf.
Stadler, P., Ashouri, A., and Maréchal, F. (2016). Model-based Optimization of Distributed and Renewable Energy Systems in Buildings. Energy and Buildings. 120, 103–113. doi:10.1016/j.enbuild.2016.03.051
Thaler, R. H., and Sunstein, C. R. (2009). Nudge Improving Decisions about Health, Wealth, and Happiness. New York: Penguin Books.
Trujillo Serrano, P. J., Alamillo Davila, C., Martínez Montes, M., De La Rubia, O., Rubio, F., Masa-Bote, D., et al. (2013). Instituto de Sistemas Fotovoltaicos de Concentración Concentration Photovoltaics Hybrid System First Year of Operation and Improvements. Prog. Photovolt: Res. Appl. 21, 1260–1275. doi:10.1002/pip.2366
Urbanucci, L. (2018). “Limits and Potentials of Mixed Integer Linear Programming Methods for Optimization of Polygeneration Energy Systems,” in 73rd Conference of the Italian Thermal Machines Engineering Association (Pisa). doi:10.1016/j.egypro.2018.08.021
Ville de Grenoble (2021). Presqu’Ile - Grenoble.Fr. Available at: https://www.grenoble.fr/545-presqu-ile.htm.
Westskog, H., Winther, T., and Sæle, H. (2015). The Effects of in-home Displays-Revisiting the Context. Sustainability. 7, 5431–5451. doi:10.3390/su7055431
Wurtz, F., and Delinchant, B. (2017). "Smart Buildings" Integrated in "smart Grids": A Key challenge for the Energy Transition by Using Physical Models and Optimization with a "Human-In-The-Loop" Approach. Comptes Rendus Physique. 18, 428–444. doi:10.1016/j.crhy.2017.09.007
Keywords: flexibility, electric vehicles, self-consumption, optimization, human in the loop, energy communities
Citation: Twum-Duah NK, Amayri M, Ploix S and Wurtz F (2022) A Comparison of Direct and Indirect Flexibilities on the Self-Consumption of an Office Building: The Case of Predis-MHI, a Smart Office Building. Front. Energy Res. 10:874041. doi: 10.3389/fenrg.2022.874041
Received: 11 February 2022; Accepted: 08 April 2022;
Published: 08 June 2022.
Edited by:
Giorgos Georgiou, Cyprus University of Technology, CyprusReviewed by:
Massimiliano Manfren, University of Southampton, United KingdomCopyright © 2022 Twum-Duah, Amayri, Ploix and Wurtz. This is an open-access article distributed under the terms of the Creative Commons Attribution License (CC BY). The use, distribution or reproduction in other forums is permitted, provided the original author(s) and the copyright owner(s) are credited and that the original publication in this journal is cited, in accordance with accepted academic practice. No use, distribution or reproduction is permitted which does not comply with these terms.
*Correspondence: Nana Kofi Twum-Duah, bmFuYS1rb2ZpLWJhYWJ1LnR3dW0tZHVhaEBnMmVsYWIuZ3Jlbm9ibGUtaW5wLmZy
Disclaimer: All claims expressed in this article are solely those of the authors and do not necessarily represent those of their affiliated organizations, or those of the publisher, the editors and the reviewers. Any product that may be evaluated in this article or claim that may be made by its manufacturer is not guaranteed or endorsed by the publisher.
Research integrity at Frontiers
Learn more about the work of our research integrity team to safeguard the quality of each article we publish.