
95% of researchers rate our articles as excellent or good
Learn more about the work of our research integrity team to safeguard the quality of each article we publish.
Find out more
ORIGINAL RESEARCH article
Front. Energy Res. , 28 March 2022
Sec. Process and Energy Systems Engineering
Volume 10 - 2022 | https://doi.org/10.3389/fenrg.2022.873749
This article is part of the Research Topic Internal Flow Mechanism of Modern Hydraulic Machinery View all 20 articles
This paper presents a detailed investigation about the modal coherence characteristics of turbomachinery noise. The modal coherence characteristics of ducted noise at high frequencies are investigated by establishing three kinds of ducted sound source distribution models. The results are consistent with the acoustic experimental results of a single-stage axial fan. The results show that acoustic modes of different orders are mutually incoherent, and radial modes within the same circumferential mode have a great degree of coherence. This paper successfully conducted an acoustic measurement on turbomachinery noise by rotating microphone arrays. The acoustic experimental results show that the coherence of some modes has little impact on the measurement of incident acoustic waves in the flow duct, while it leads to about 3 dB deviation in the prediction of the reflected modal sound power and has little influence on the spectral shape of reflected acoustic waves. It was demonstrated that the experimentally measured modal coherence functions give an inner sense of the spatial noise source distribution and enable the investigation of mode scattering within the propagation. Based on the modal coherence characteristics obtained in this paper, more theoretical and methodological studies can be carried out for the turbomachinery broadband noise test.
Ducted broadband noise becomes increasingly important for the noise reduction concept in the modern civil aviation, especially when improved passive absorbers in the engine inlets and bypass sections, modern fan blade configurations, and a cut-off design of the fan rotor and stator become a standard. For the assessment and measurement of broadband noise in a duct, it is of great worth to investigate the multi-mode propagation characteristics and also coherence functions of pairwise modes (Morfey, 1971; Bolleter and Crocker, 1972; Moore, 1979).
Due to the complex mechanism of the broadband noise source inside aero-engines, the acoustic mode identification measurement becomes more difficult than tonal noise. Unlike tonal noise in which the sound energy is mainly concentrated in several dominant modes, the sound energy of turbomachinery turbulent noise is distributed in each cut-on modes. Therefore, in the investigation of turbulent broadband noise, we need to identify all the propagating modes and measure the modal distribution characteristics. Sijtsma and Brouwer (2018) assumed that the sound field of the turbomachine is dominated by a finite number of acoustic modes and proposed an acoustic mode recognition method based on a non-equally spaced microphone array, the deconvolution algorithm is used in the research to increase the dynamic response range in order to overcome the occurrence of multimodal mutual interference. Compared with the traditional beamforming method, the dynamic response range is increased by 10 dB. In order to evaluate and measure the broadband noise, it is necessary to conduct a detailed study on the propagation characteristics and coherence functions of modes in the flow duct and to analyze the error transfer characteristics in the mode recognition (Xu et al., 2018). Enghardt (Enghardt et al., 2004) considered that the turbulent broadband noise still propagates in the form of statistically averaged modal waves inside the turbine duct and proposed a reference correlation method to identify the broadband acoustic mode. This method uses a measured cross-spectrum vector to obtain the amplitude spectrum of the acoustic mode propagating downstream and upstream in the duct. It should be noted that the method used by Deutsches Zentrum für Luft- und Raumfahrt (DLR) in a lot of applications requires the occupation of several rings of microphones, in which the number of sensors is proportional to the total number of modes propagating within the duct. As the frequency under consideration increases, more microphones are required to accurately decompose the broadband noise accordingly. This needs either an array consisting of a large number of fixed sensors, as employed by Ganz et al. (1998), for example, or an array with a smaller number of microphones rotating around the duct axis (Xu et al., 2017a). Kopiev et al. (2017) used a sparse array of 100 microphones to identify and measure the acoustic mode of a turbofan engine. The experiment was carried out in the anechoic chamber of the Russian State University of Technology. The results show that the sparse microphone array can be used to test the circumferential modal distribution of a new generation turbofan engine (Bu et al., 2020). proposed a compressive sensing technology for radial modal recognition of turbomachines based on the previous circumferential modal recognition research (Yu et al., 2018); when the number of microphones is significantly reduced, the tonal noise modal distribution measured by the compressed sensing technology has good accuracy and can effectively suppress the interference of background noise.
An improved version of the broadband noise measurement method was demonstrated by Jürgens et al. (2011) to expound and prove that the measured modal coherence functions give insight into the spatial noise source distribution. Regarding the coherence characteristics between the duct sound field and internal modes, Dyer (1958) pointed out that the modes generated by a monopole mass source with a random location is statistically uncorrelated, but Michalke et al. (1996) indicated that the sound field generated by the random monopole in the time domain is completely correlated, even in the near field of the sound source, which is completely opposite to the conclusion drawn by Dyer. Michalke et al. (1996) proposed an experimental method to predict the correlation of the sound field with the cross-spectrum signals measured by three microphones (Enghardt et al., 2007), and (Jürgens et al., 2010) used the cross-correlation method to investigate the broadband noise modal coherence function in the duct with no flow. A ducted sound field was artificially constructed by the application of two ring loudspeakers, and the results show that the coherence function results between different modal combinations are completely different (Tapken et al., 2014). Constructing the broadband noise in the duct by arranging several rings of monopole sources on the duct wall, the modes in the artificial sound fields are completely incoherent when 20 rings of monopole sources are arranged; this is consistent with the conclusion of Jürgens et al. (2010). On account of the measured coherence function between broadband noise modes in the flow duct, it is possible to explore the characteristics of broadband noise sources, such as the dominant noise source distribution characteristic and appearance of each sound source (Jürgens et al., 2011) and to further investigate the modal characteristics in the airflow duct with different hub ratios (Jeong et al., 2006). However, in order to achieve noise reduction in the sound source aspect and radiation process, it is worthwhile to investigate the coherence characteristics of acoustic modes in turbomachinery and modal distribution characteristics of broadband noise.
The purpose of this paper is to deeply investigate the coherence characteristics between the modes of the turbomachinery duct through theoretical analysis, numerical simulation, and experimental testing methods. Based on the obtained modal coherence features, the design of a new modal identification method is guided to meet the noise test requirement of large-sized fans and large bypass ratio engines. This paper provides the modal coherence characteristic measurements of ducted noise in turbomachinery for comparison with models and numerical investigation. The findings should better inform the future cognition of the broadband noise generation mechanism and allow a basis for the broadband noise reduction design in turbomachinery. The paper is organized as follows. The measurement theory is discussed in the Measurement Theory section, which includes the modal coherence coefficient, details of synthetic sound fields, and ducted sound source distribution models. The characteristics of the synthetized sound fields are provided in the Characteristics of the Synthetized Sound Fields section. In the Experimental Study on the Acoustic Modal Coherence Characteristics section, we present the experimental facility and setup and experimental and theoretical analysis on acoustic modal coherence distribution and broadband modal distribution results. A summary of the findings and future perspectives is provided in the Conclusion section.
The cross-spectrum of two sound pressure measurement points at a single frequency as shown as Figure 1 can be expressed as
In the formula, the superscripted
In the formula,
where
Therefore, the cross-spectrum of the modal amplitude can be written as
In the formula,
In the formula,
The modal amplitude and cross-term between them can be obtained by formula (5), which is defined according to the modal coherence coefficient between the mode
The coherence characteristics between the cut-on modes in the duct can be obtained. It should be noted that the modal amplitude in formula (8) represents the statistical average of the modal amplitude. The sound power carried by each individual mode can be calculated by
with
A numerical analysis was first performed in the synthetic sound fields. It is assumed that the duct is hard walled and has non-reflecting terminations in the following. The duct radius is 0.25 m. An optionally superposed axial flow is represented as a uniform-profile flow. In this section,
The quantity
In the following, the modal cross-spectral density is formulated for an array consisting of
Here
In the actual test, environment reflections can appear upstream or downstream of the sensor array. The impact of the reflections can be integrated into the Green’s function with a method of mirrored sources. For simplicity, the reflection coefficient
In the frame of the numerical study, four substantially different arrangements of point-like monopole sources, denoted by Latin numbers I–IV, are investigated. The detailed information of source configurations is displayed in Table 1. The main difference lies in the number of axial sensor rings and also the total number of point-like monopole sources. At each sensor, the position time series of 700 FFT windows are used in the numerical process.
At high frequency, a large number of modes will be cut on inside the duct according to the Tyler and Sofrin modal theory, which brings great challenges to the experimental test of the modal coherence coefficient. As an alternative strategy, it is necessary to study the modal coherence distribution at a high frequency by pre-assuming the modal amplitude or sound source distribution in the duct. The sound source in the low-speed flow duct is mainly composed of dipole and monopole sound sources. This section will establish three representative sound source models: uniformly distributed monopoles, uniformly distributed dipoles, and equal energy per mode (EEPM) sound source models.
When the incoherent sound sources are uniformly distributed on a certain cross-section in the duct, the non-homogeneous wave equation contains the source term
The source term can be expressed as
in which
Considering the single mode generated by a fixed sound source in a semi-infinite duct, Joseph et al. (2003) indicated that the spatial differentiation of the single mode (the second item on the right of Eq. 16) is equivalent to
Similarly, the time differential in equation is equivalent to
Therefore, when the cross-section in the semi-infinite circular duct is uniformly distributed with incoherent sound sources of spatial order
in which
It can be found that the model formula (20) cannot be unified to formula (19). Therefore, the sound source distribution model is integrated as
in which
The corresponding values of the three models are shown in Table 2; the type of sound source is defined by three Greek letters
Eq. 22 represents a uniformly distributed incoherent monopole sound source
In the frame of the numerical study of modal coherence in a flow duct, four substantially different arrangements of point-like monopole sources displayed in Table 1 are investigated. On one hand, the analytical coherence functions of pairwise modes theoretically obtained by Eq. 16 are compared with that inferred from Eq. 8 in order to assess the characteristics of the simulated sound fields; on the other hand, a comparison of the squared mode amplitudes obtained by Eq. 11 with that calculated by the cross-correlation mode decomposition method (CC-MDM) (Jürgens et al., 2010; Xu et al., 2015), Reference Correlation Mode Decomposition Method (RC-MDM) (Xu et al., 2017a), Combined Sensor Array (CSA method) (Tapken et al., 2014; Xu et al., 2017b), and also the analytical values inferred from Eq. 21 is fulfilled to determine the bias. Figure 3 shows exemplary results in the flow direction for a duct with measurement sensor rings located downstream of the sources rings.
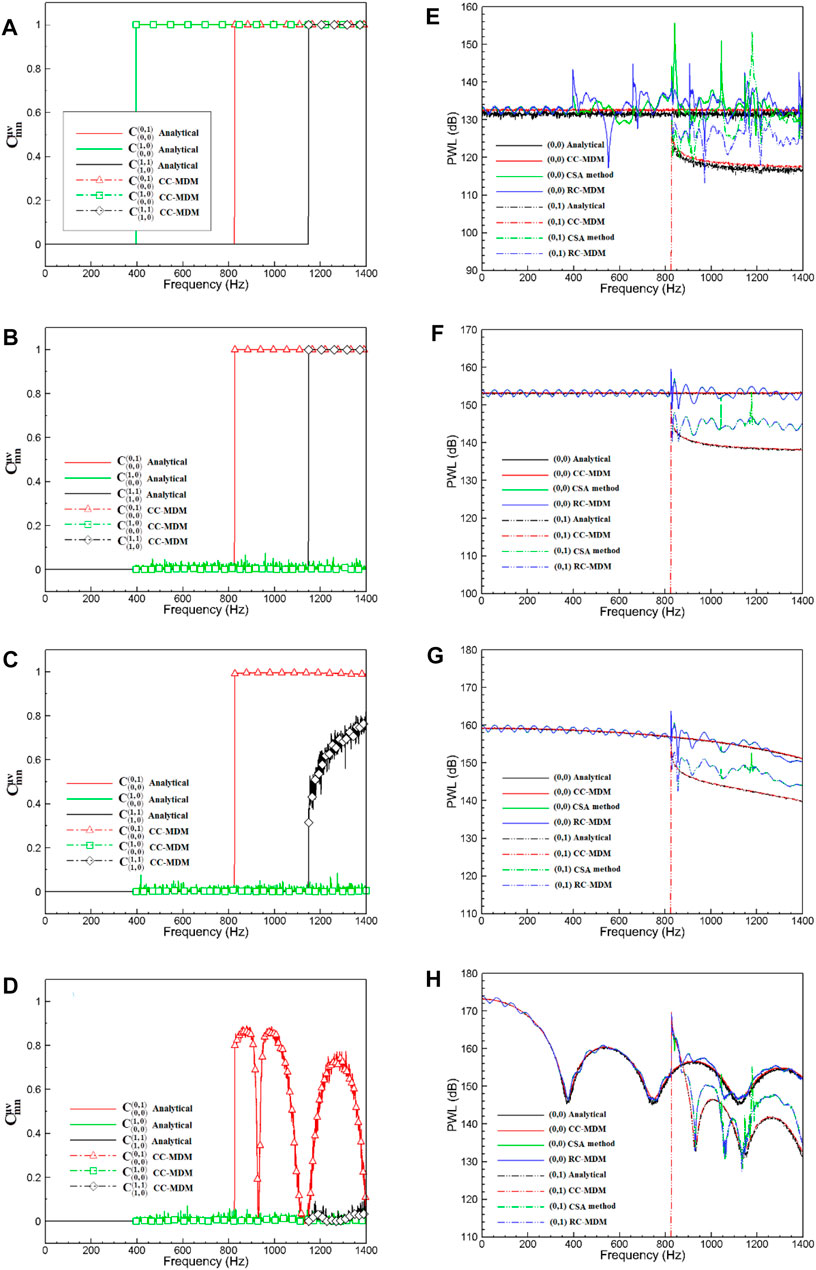
FIGURE 3. Modal coherence and sound power results of CC-MDM, CSA method, and RC-MDM appended with analytical prediction. Broadband sound fields were synthesized by using different ring numbers of incoherent monopole sources shown in Table 2. Diagrams (A–D) depict the mode coherence; diagrams (E–H) show the modal sound power.
The reflected modes are found to have comparatively little difference compared with the deviation of incident modes, so it is not shown in this paper for simplicity. In the left column of Figure 3, the coherence functions of mode pairs (0, 0) and (0, 1), (0, 0) and (1, 0), (1, 0), and (1, 1) are plotted up to 1,400 Hz (corresponding to
The sound field within the duct generated by a single monopole source is completely coherent, i.e., all modes are fully coherent, which is consistent with the investigation (Michalke et al., 1996). When a single ring of
In condition I, mode amplitudes above the cut-on frequency of the non-plane wave are determined with large oscillation error since all mode pairs are fully coherent. In conditions II and III, relatively accurate modal sound power results are determined with CSA and RC-MDM methods up to the cut-on frequency of the first higher radial mode order (i.e.,
It should be noted that the resolved mode amplitudes of mode (0, 1) are always higher than the actual value; the potential reason for this phenomenon is that the energy carried by the modal cross-terms is forced to superimpose over the squared mode amplitudes in the process of mode decomposition. In condition IV, a reasonable sound power solution of mode (0, 0) is determined by the CSA method, although a high degree of coherence appears between the radial modes with the azimuthal mode order m = 0. That is to say, internal modal cross-terms have decayed to sufficiently small values in comparison with the dominant mode when more rings of monopole sources are occupied. The peaks observed in the modal sound power are induced by the numerical instability when they are close to the cut-on frequencies of modes. The corresponding axial wave number is nearly zero when the Mach number is very low, i.e.,
In general, broadband modal decomposition appears to be highly sensitive to the mode coherence characteristics, CSA and RC-MDM methods deliver a comparable estimate of the incident modal sound power within the frequency range in which modes are almost mutually incoherent.
One important aspect of this paper is to experimentally investigate the modal coherence distribution with respect to an axial fan test rig. A schematic of the experimental set-up is shown in Figure 4. It was designed with the intention to capture the most relevant acoustic features of an axial fan. On the inlet side there is a short duct section with a bell mouth nozzle and there are no flow straighteners or screens in the inlet duct. The single-stage axial fan consisting of 19 rotor blades and 18 stator vanes was driven at 3,000 rpm with the help of one motor providing 18.5 kW electric power. The diameter is 0.5 m, and the axial Mach number is 0.1. The outlet duct is equipped with an anechoic termination device; this condition strictly conforms to the international standard ISO 5136 for in-duct sound power determination. The number of stator vanes was designed such that the rotor–stator interaction tone at the blade passing frequency (BPF) is acoustically cut on.

FIGURE 4. Schematic of the experimental setup with the measurement sensor array located upstream of an axial fan rig with an anechoic termination outlet duct.
In order to eliminate noise pollution in the experimental measurement, the acoustic environment of the experiment is particularly important. For example, when the standing wave formed by the external enclosed environment radiates into the duct, it will directly affect the experimental measurement of the fan inlet noise and reduce the signal-to-noise ratio of the acoustic signal. The fan inlet and the acoustic measurement section are placed inside the semi-anechoic chamber to reduce the influence of external reflected noise on the fan inlet noise test; perforated acoustic liners are installed on the inner and outer walls of the fan exhaust duct. The phase lock device (shown as a red square in Figure 4) used in this paper is a photoelectric sensor. The pulse signal can be used to capture the circumferential angle of the fan blade and also the real-time fan rotating speed; the accuracy can be guaranteed to be less than 2°. The sampling frequency is 16,384 Hz, and time series of a length of 60 FFT windows were used here, each window comprising 16,384 data samples. In order to meet the requirements of the designed method, the acoustic measurement section (shown as a red box in Figure 4) is divided into two measurement devices: part A and part B. Part A is a combined sensor array that includes a ring of 16 equiangular installed sensors and a row of 15 equidistant microphones. In part B, a rotating measurement system is designed to be driven by a stepper motor; two axial arrays, each consisting of 14 microphones with equal intervals, are installed in the rotating measurement system that can rotate 360° in the circumferential direction in the experiment.
Figure 5 shows the acoustic modal cut-on function of the fan duct. Figure 5A shows the total mode number propagating in the flow duct; the solid line, dash-dotted line, and dashed line indicate the total number of cut-on modes, maximum circumferential mode order, and maximum radial mode order, respectively. At 3,000 Hz, a total of 55 modes are able to propagate in the flow duct. Taking into account the forward and backward propagation of the modes, there will be 110 modal waves propagating in the duct, of which the maximum circumferential order is
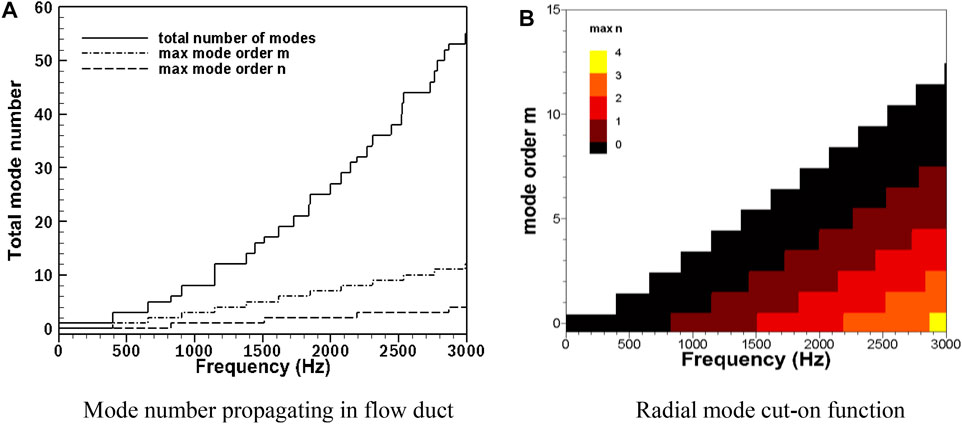
FIGURE 5. Modal cut-on function of a single-stage axial fan: (A) shows the mode number propagating in the flow duct; (B) shows the radial mode cut-on function.
In the turbomachinery, the noise generated by rotor blades is a radially distributed sound source term. It is assumed that the ducted broadband sound field consists of fully incoherent modes, which are the important precondition of the broadband mode decomposition method presented by Enghardt (Enghardt et al., 2004). This assumption has not be verified experimentally so far for turbomachinery noise. Indeed, it is reasonable that specific modes are excited with high degree of coherence if certain conditions with respect to the spatial arrangement of sources are fulfilled; the compactness of the sources and the interference of the in-stationary aerodynamic forces also play an important role on modal coherence.
In the analysis of modal coherence function, the modal combinations are divided into two categories: in the first modal combination, the circumferential orders of modes are different from each other (
The modal coherence coefficients are measured at four operation conditions: 90%, 92%, 96%, and 100% design speed in the single-stage axial fan noise experiment. It should be noted that, although the microphone in the test is equipped with a windshield, the pressure pulsation of the airflow will inevitably affect the sound pressure measurement. The coherence function between modal complex amplitudes will be affected accordingly; the result will not reach the upper and lower limits, i.e., 1 and 0 defined by the formula eventually. Figure 6 shows the modal coherence coefficients of the first mode combination, the coherence coefficient is lower than 0.15 from 300 to 1,100 Hz. The test results can show that the modes of different circumferential orders are incoherent from each other, taking into account the influence of airflow pulsation and acoustic test error. At the BPF, the coherence coefficients of
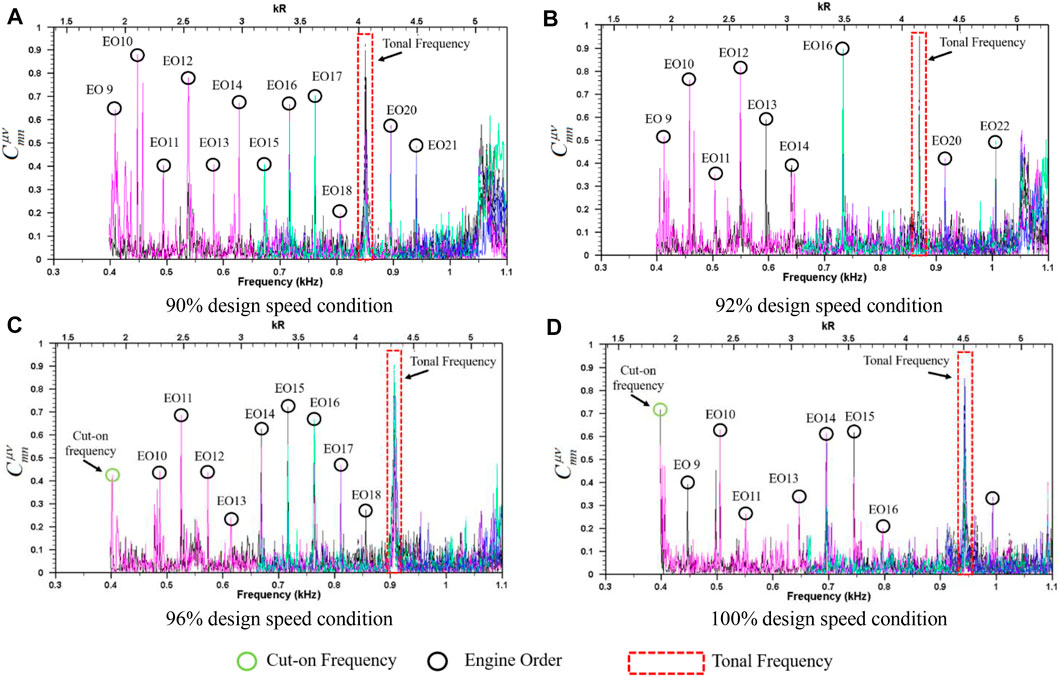
FIGURE 6. Modal coherence coefficients of fan noise under four operating conditions: (A–D) show the modal coherence coefficients of fan noise under 90%, 92%, 96% and 100% design speed condition separately. represents the modal coherence coefficient between and modes.
In addition to the peaks appearing at the tonal noise frequencies, multiple peaks at other frequencies also exist in the experimentally measured coherence coefficient results. The main reasons can be attributed to two categories: (a) when the frequency is close to the mode cut-on frequencies, due to the extreme eigenvalue generated in the process of matrix operation, the instability of numerical calculation leads to unreal complex modal amplitude. The modal coherence coefficients become exaggerated accordingly, which is represented by a green circle in Figure 6; (b) there are many peaks at the shaft frequency and its harmonics. For example, in Figure 6C, the fundamental shaft frequency (engine order [EO]) is 47.6 Hz; the modal coherence coefficients existing peak at 666, 714, 761.5, and 809 Hz. These frequencies correspond to EO14, EO15, EO16, and EO17, which are marked with black circles in Figure 6. The amplitudes of these coherence coefficient peaks are relatively small to that of tonal noise, and the occurrence frequencies are determined regularly. It can be considered to be the mechanical noise generated by the rotating shaft. Therefore, they have limited influence on the acoustic modal coherence characteristics of the flow duct.
Figure 7 shows the coherence coefficients of the second type of mode combination. At four operating conditions, the results of
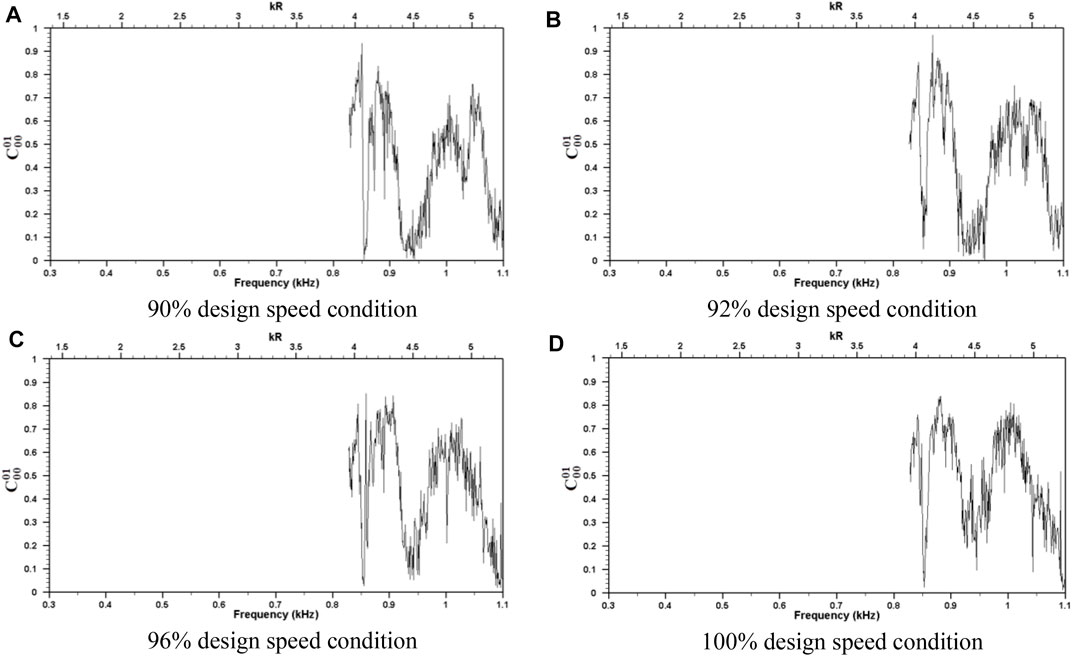
FIGURE 7. Modal coherence coefficient between mode (0, 0) and mode (0, 1): (A–D) show the modal coherence coefficient between mode (0, 0) and mode (0, 1) under 90%, 92%, 96% and 100% design speed condition separately. represents the modal coherence coefficient between and modes.
For turbomachine aerodynamic noise, the hypothesis of the incoherence of internal modes has not been experimentally verified. The experimental results above show that the modes with different circumferential orders are statistically incoherent. As for the specific radial modes with the same circumferential order, the reason for appearing high relevance is closely related to the spatial distribution, compactness of the sound source, and also the individual sound source terms generated by the unsteady aerodynamic force. At low frequencies, a high degree of coherence characteristics appears between the radial modes with the same circumferential order. This may be caused by the self-noise generation mechanism of the blade row, which means that each blade can be regarded as a compact sound source compared to a long sound wavelength at low frequencies. However, it can be expected that the coherence characteristics existing between some modes may change at high frequencies because the characteristic wavelength of the sound wave becomes shorter relative to the blade spanwise length.
The Characteristics of the Synthetized Sound Fields Section and Acoustic Modal Coherence Distribution of the Single-Stage Axial Fan section investigated the modal coherence distribution between modes in synthetized sound fields and a single-stage axial fan and finally came to important conclusions. As the frequency gradually increases, the number of modes will increase exponentially, and the number of sound pressure measurement points required for experimental measurement will also increase exponentially; this requirement results in a great challenge to the acoustic experiment of turbomachines.
In this section, theoretical analysis methods will be used to further expand the research on the acoustic modal coherence in flow duct at high frequencies in the hope of drawing conclusions over a wider frequency range. The modal amplitude distribution function in the duct can be obtained by using three ducted sound source distribution models proposed in the Ducted Sound Source Distribution Models section. Based on the ducted noise propagation model, the sound pressure values at different positions of microphone array measurement can be obtained by complex modal sound pressure superposition; combined with the broadband noise modal coherence analysis method, it can be achieved to further investigate the modal coherence function in a theoretical way. The advantage of this research is that the modal amplitude obtained by the mode decomposition method can be used to verify the reliability of the model based on the preknowledge of the modal amplitude distribution function. The modal coherence is deliberated on the basis of successful verification to make the results more reliable.
The influence of different ducted sound source models on modal coherence is discussed first in theoretical analysis. Figure 8 shows the modal coherence results of three sound source models at 5,412 Hz, in which the expected values are calculated with a statistical average process. A total of 170 modes are cut on in the flow duct at 5,412 Hz, including the maximum circumferential order
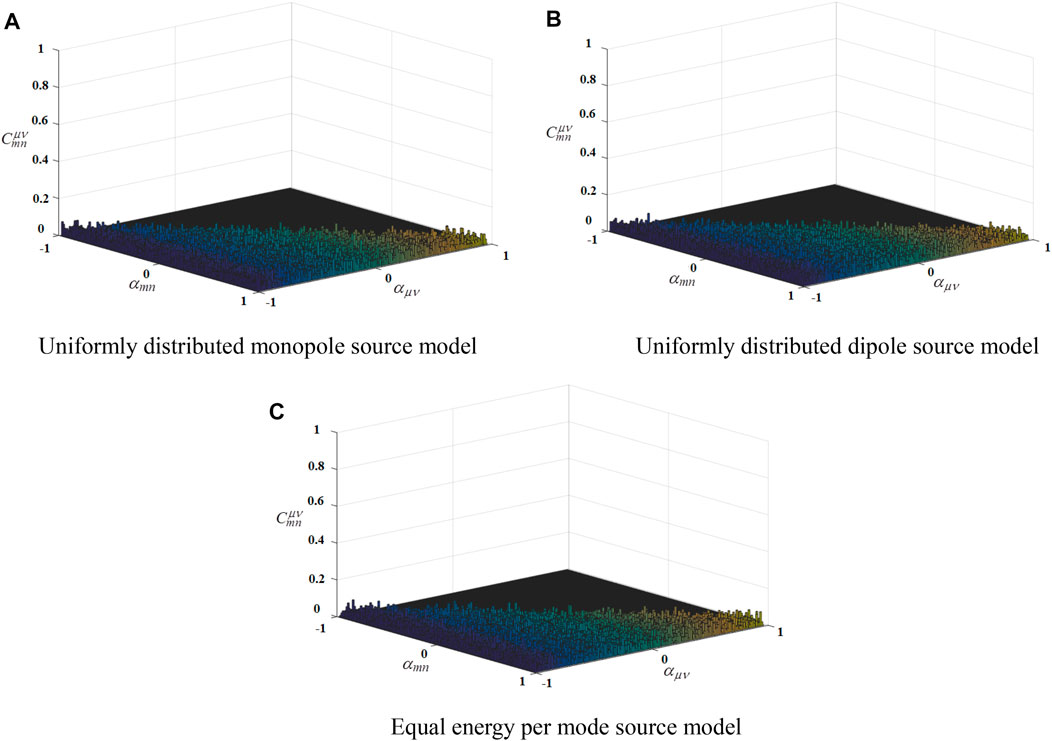
FIGURE 8. Modal coherence results of three sound source distribution models: (A) shows the results of uniformly distributed monopole source model; (B) shows the results of uniformly distributed dipole source model; (C) shows the results of equal energy per mode source model. represents the modal coherence coefficient between and modes.
Figure 9 shows the modal coherence coefficients of different radial modes within the circumferential mode m = 0, m = 1 and m = 2 at 5,412 Hz. Abscissa
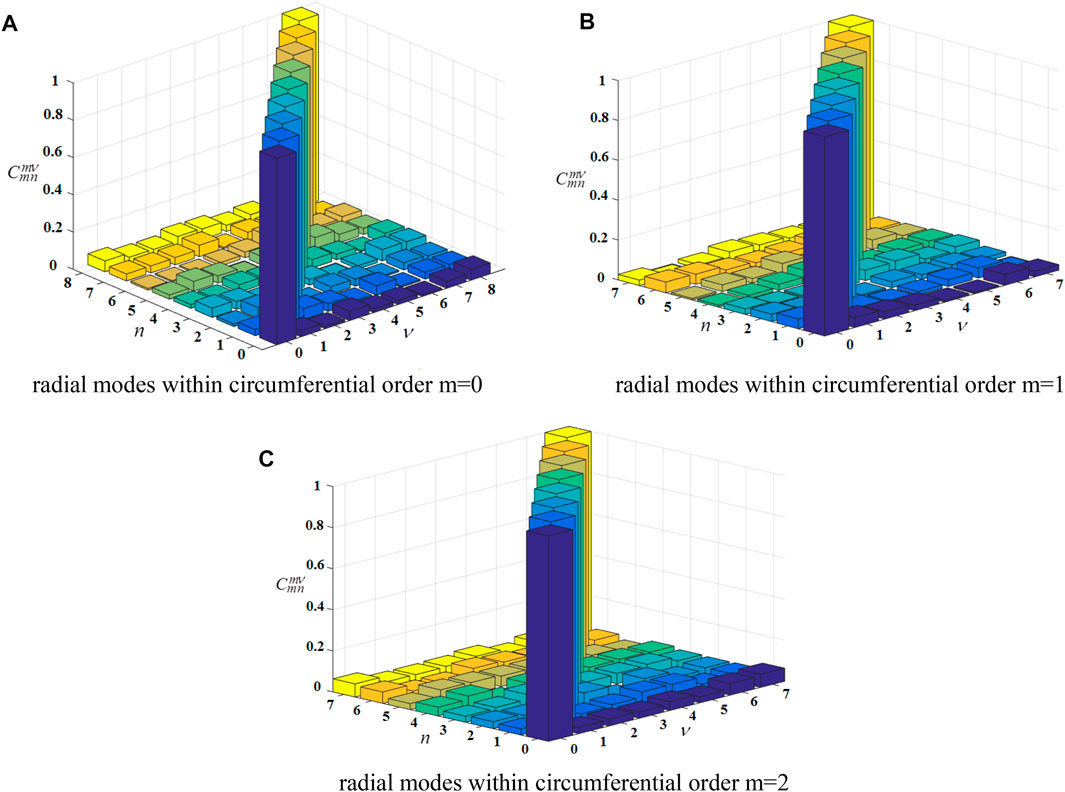
FIGURE 9. Modal coherence results between radial modes with same circumferential order: (A–C) show the radial modes within circumferential order m=0, m=1, m=2 separately. represents the modal coherence coefficient between and modes.
In this section, three kinds of ducted sound source distribution models are established, and the modal coherence characteristics at high frequencies are investigated theoretically for the first time by using the artificially constructed ducted sound fields. The results show that all the modes are incoherent at different frequencies, and the modal coherence characteristics are independent of the sound source distribution models. The coherence characteristics of the three ducted sound source models are approximately the same. At high frequencies, the radial modes within the same circumferential mode are incoherent to each other.
Different modal identification methods (RC-MDM, CSA method) make relevant assumptions and simplifications about the modal coherence; the influence of this simplified treatment on the sound power and modal amplitude distribution of turbomachinery ducted noise field, which we are most concerned about, needs to be further studied. Figure 10 shows the sound power results of incident and reflected sound waves calculated by different modal decomposition methods. The red and blue lines represent the computed sound power results calculated by the RC-MDM and CC-MDM, respectively, and the black line represents the sound power results computed by the CSA method. A series of simplifications of complex modal amplitude cross-terms are carried out in CSA and RC-MDM methods. It can be seen from Figure 10 that the shape of sound power spectral calculated by the three methods are consistent with each other, both in the incident and reflected sound waves.

FIGURE 10. Comparison of sound power results calculated by different mode decomposition methods: (A) shows the sound power of incident sound wave; (B) shows the sound power of reflected sound wave. Blue line, red line and black line represents the results applying CC-MDM, RC-MDM and CSA method separately.
The cross-terms
Under the framework of Sino-European cooperation, the NUMECA is the name of an internationally renowned computational fluid dynamics business company, conducted a numerical acoustic simulation on the single-stage axial fan duct device used in this research. As shown in Figure 11, the broadband mode decomposition result calculated by the RC-MDM with rotating sensor arrays is marked as a black solid line; the thick red line is the predicted broadband noise result calculated by NUMECA, using the adaptive spectral reconstruction method. The red circle symbol indicates the predicted tonal noise result. The results of the broadband noise spectrum are in good agreement in the frequency range (50–1,600 Hz), and the overall magnitude is around 68 dB. The broadband noise spectral characteristics are also very consistent at a special frequency, for example, the leap in sound power spectra at 400 Hz. In the tonal noise part, less than 1 dB deviation appears at 1BPF, and less than 0.5 dB arises at 2BPF. At 3BPF, the deviation increases to 1.5 dB. In general, fan noise measurements based on RC-MDM method using the rotating microphone array can be added to the aircraft turbomachinery noise database as standard data, which can provide evaluation and verification criteria for other broadband noise measurement methods or numerical simulation algorithms.
Figure 12 shows the sound power distribution of the incident and reflected modes of fan broadband noise identified by the rotating microphone array. The abscissa is set as the circumferential mode order m, ranging from −12 to +12, and the ordinate is set as the frequency, ranging from 0 to 3,000 Hz. In order to display the sound power results of incident and reflected sound waves more clearly, the legend range of incident sound waves is set to 40–80 dB, while the value of reflected sound waves is set to 35–75 dB, 5 dB lower than incident waves. When the fan operating speed is 3,000 rpm, the 1BPF and 2BPF tones are clearly visible in the incident sound waves; the sound power is mainly concentrated in the −6∼+6 circumferential modes. The 1BPF and 2BPF tonal tones can still be seen in the reflected sound waves, but different from the incident sound wave, the dominant mode in the reflected sound wave is not the rotor–stator interference modes but the plane sound wave. In the whole frequency range of reflected sound waves, the modal acoustic power is mainly concentrated in the −2∼+2 circumferential modes, and is approximately distributed symmetrically with the m = 0 mode as the center. This paper uses an equally spaced axial array to test the fan noise. For large ventilation facilities, this kind of device is often difficult to meet. How to use the obtained modal coherence characteristics to design a new test method needs further research, and the correlation between error characteristics in mode identification and microphone array design aspects also requires further study.
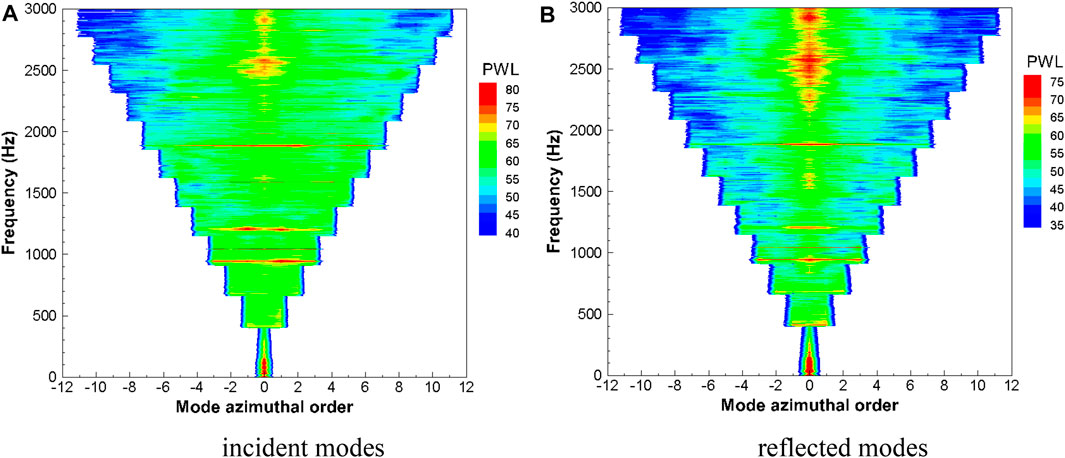
FIGURE 12. Broadband modal sound power distribution: (A) shows the modal sound power distribution map of incident modes; (B) shows the modal sound power distribution map of reflected modes.
In this paper, the modal coherence characteristics of turbomachinery noise are studied in detail for the first time. The distribution characteristics of complex acoustic pressure in the flow duct are studied by constructing the ducted sound fields artificially, establishing three kinds of ducted sound source distribution models and an acoustic testing of a single-stage axial fan.
The simulation results of artificially constructed ducted sound fields show that the broadband noise power calculated by the RC-MDM, CSA, and CC-MDM are in good agreement. Due to the simplified processing of acoustic modal coherence characteristics, the RC-MDM and CSA methods are extremely sensitive to the phase variation precision of modal wave propagation in the axial direction. Therefore, it is necessary to design microphone arrays with sufficient axial measurement positions for accurately measuring the phase variation resulting from acoustic modal wave axial propagation. The modal coherence characteristics of ducted noise at high frequencies are investigated by establishing three kinds of ducted sound source distribution models. The results are consistent with the acoustic experimental results of a single-stage axial fan. The results show that the acoustic modes of different orders are mutually incoherent, and the radial modes within the same circumferential mode have a great degree of coherence.
It was demonstrated that the experimentally measured mode coherence functions give an inner sense of the spatial noise source distribution and enable the investigation of mode scattering within the propagation. In order to further study the influence of the distribution characteristics of modal coherence on the mode identification of turbomachinery noise, this paper successfully conducted acoustic measurement on turbomachinery noise by rotating microphone arrays. The acoustic experimental results show that the coherence of some modes has little impact on the measurement of incident acoustic waves in the flow duct, while it leads to about 3dB deviation in the prediction of reflected modal sound power and has little influence on the spectral shape of reflected acoustic waves. The acoustic modal distribution results show that the incident mode waves are mainly concentrated in the m = -6 to m = +6 modes; the reflected acoustic waves are concentrated in the m = −2 to m = +2 mode and are approximately distributed symmetrically around the m = 0 mode. In conclusion, although some internal modes of turbomachinery-ducted noise have strong coherence characteristics, the influence of such characteristics on the acoustic measurement of turbomachinery-ducted noise can be ignored. Based on the modal coherence characteristics obtained in this paper, more theoretical and methodological studies can be carried out for the turbomachinery broadband noise test.
The raw data supporting the conclusion of this article will be made available by the authors, without undue reservation.
KX is responsible for the whole project. CL is responsible for the experiment and the data processing. FT is responsible for the numerical investigation and also the experimental plan design. WQ designs the structure of the thesis and propose suggestions.
This work was financially supported by National Natural Science Foundation of China (Grant No.12002150), also supported by The Ministry of education of Humanities and Social Science project (Grant No. 20YJCZH196), also supported by Natural Science Foundation of Jiangsu Province, China (Grant No. BK20201041), also supported by Key Laboratory of Aerodynamic Noise Control of China Aerodynamics Research and Development Center (Grant No. ANCL20190306), also supported by Scientific Research Fund of high-level talents in Nanjing Institute of Technology (Grant No. YKJ201906).
The authors declare that the research was conducted in the absence of any commercial or financial relationships that could be construed as a potential conflict of interest.
All claims expressed in this article are solely those of the authors and do not necessarily represent those of their affiliated organizations, or those of the publisher, the editors and the reviewers. Any product that may be evaluated in this article, or claim that may be made by its manufacturer, is not guaranteed or endorsed by the publisher.
Bolleter, U., and Crocker, M. J. (1972). Theory and Measurement of Modal Spectra in Hard‐Walled Cylindrical Ducts. The J. Acoust. Soc. America. 51, 1439–1447. doi:10.1121/1.1912994
Bu, H., Huang, X., and Zhang, X. (2020). A Compressive-Sensing-Based Method for Radial Mode Analysis of Aeroengine Fan Noise. J. Sound Vibration. 464, 114930. doi:10.1016/j.jsv.2019.114930
Dyer, I. (1958). Measurement of Noise Sources in Ducts. J. Acoust. Soc. America. 30, 833–841. doi:10.1121/1.1909783
Enghardt, L., Holewa, A., and Tapken, U. “Comparison of Different Analysis Techniques to Decompose a Broadband Ducted Sound Field in its Mode Constituents [C],” in 13th AIAA/CEAS Aeroacoustics Conference, AIAA-2007-3520.
Enghardt, L., Lowis, C., and Neuhaus, L. (2004). “Broadband Sound Power Determination in Flow Ducts [C],” in 10th AIAA/CEAS aeroacoustic conference, AIAA-2004-2940. Manchester, UK.
Ganz, U. W., Joppa, P. D., Patten, T. J., and Scharpf, D. F. (1998). Boeing 18-inch Fan Rig Broadband Noise Test. Seattle: NASA. Technical Report CR-1998-208704.
Jeong, W., Lee, S., and Joseph, P. (2006). A wall-mounted Source Array for the Excitation of Incoherent Broadband Sound fields with Prescribed Modal Distributions in Ducts [J]. J. Sound Vibration. 290 (1), 490–499. doi:10.1016/j.jsv.2004.12.025
Joseph, P., Morfey, C. L., and Lowis, C. R. (2003). Multi-mode Sound Transmission in Ducts with Flow. J. Sound Vibration. 264 (3), 523–544. doi:10.1016/s0022-460x(02)01205-1
Joseph, P., and Morfey, C. L. (1999). Multimode Radiation from an Unflanged, Semi-infinite Circular Duct. J. Acoust. Soc. America 105 (5), 2590–2600. doi:10.1121/1.426875
Jürgens, W., Pardowitz, B., and Enghardt, L. (2011). “Separation of Broadband Noise Sources in Aeroengine Ducts with Respect to Modal Decomposition,” in 17th AIAA/CEAS aeroacoustic conference. AIAA-2011-2879. Portland, USA.
Jürgens, W., Tapken, U., Pardowitz, B., Kausche, P., Bennett, G. J., and Enghardt, L. “Technique to Analyse Characteristics of Turbomachinery Broadband Noise Sources [C],” in 16th AIAA/CEAS Aeroacoustics Conference, AIAA-2010-3979.
Kim, Y., and Nelson, P. A. (2004). Estimation of Acoustic Source Strength within a Cylindrical Duct by Inverse Methods [J]. J. Sound Vibration. 275 (1-2), 391. doi:10.1016/j.jsv.2003.06.032
Kopiev, V. F., Bersenev, Y. V., Viskova, T. A., Burdakov, R. V., Palchikovskiy, V. V., Belyaev, I. V., et al. (2017). Azimuthal Modes Measurement in an Intake Duct for a Turbofan Engine. Proced. Eng. 176, 273–277. doi:10.1016/j.proeng.2017.02.319
Michalke, A., Arnold, F., and Holste, F. (1996). On the Coherence of the Sound Field in a Circular Duct with Uniform Mean Flow. J. Sound Vibration. 190 (2), 261–271. doi:10.1006/jsvi.1996.0061
Moore, C. J. (1979). Measurement of Radial and Circumferential Modes in Annular and Circular Fan Ducts. J. Sound Vibration. 62 (2), 235–256. doi:10.1016/0022-460x(79)90024-5
Morfey, C. L. (1971). Sound Transmission and Generation in Ducts with Flow. J. Sound Vibration. 14 (1), 37–55. doi:10.1016/0022-460x(71)90506-2
Nelson, P., and Yoon, S. (2000). Estimation of Acoustic Source Strength by Inverse Method: Part I, Conditioning of the Inverse Problem [J]. J. Sound Vibration. 233 (4), 643–668. doi:10.1006/jsvi.1999.2837
Sijtsma, P., and Brouwer, H. (2018). Deconvolution of Azimuthal Mode Detection Measurements. J. Sound Vibration. 422, 1–14. doi:10.1016/j.jsv.2018.02.029
Tapken, U., Gutsche, D., and Enghardt, L. (2014). “Radial Mode Analysis of Broadband Noise in Flow Ducts Using a Combined Axial and Azimuthal Sensors Array [C],” in 20th AIAA/CEAS Aeroacoustics Conference. Atanta, GA. AIAA-2014-3318
Xu, K. B., Qiao, W. Y., and Huo, S. Y. (2017a). Experimental of Fan Broadband Noise Determination Based on Rotating Axial Arrays. J. Acta Aeronautica Astronautica Sinica 38 (11), 121–132. doi:10.7527/S1000-6893.2017.121132
Xu, K. B., Qiao, W. Y., and Chang, X. Y. (2017b). Fan Broadband Noise Based on Combined Sensor Array Method. J. Acta Aeronautica Astronautica Sinica. 38 (12), 121324. doi:10.7527/S1000-6893.2017.121324
Xu, K. B., Qiao, W. Y., and Huo, S. Y. (2018). Research of Mode Identification and Error Transfer Property on Fan Tonal Noise [J]. J. Propulsion Technology. 39 (1), 185–195. doi:10.13675/j.cnki.tjjs.2018.01.021
Xu, K. B., Qiao, W. Y., and Wang, L. F. (2015). Experimental Research of Broadband Sound Power Determination in Axial Fan [J]. Acta Aeronautica et Astronautica Sinica. 36 (9), 2939–2946. doi:10.7527/S1000-6893.2015.0080
Keywords: broadband noise, mode amplitude, array, turbomachinery, axial fan
Citation: Xu K, Liu C, Tong F and Qiao W (2022) Numerical and Experimental Investigations of Modal Coherence Characteristics for the Determination of Broadband Noise in Flow Ducts. Front. Energy Res. 10:873749. doi: 10.3389/fenrg.2022.873749
Received: 11 February 2022; Accepted: 21 February 2022;
Published: 28 March 2022.
Edited by:
Kan Kan, College of Energy and Electrical Engineering, ChinaReviewed by:
Guangyao An, North China Electric Power University, ChinaCopyright © 2022 Xu, Liu, Tong and Qiao. This is an open-access article distributed under the terms of the Creative Commons Attribution License (CC BY). The use, distribution or reproduction in other forums is permitted, provided the original author(s) and the copyright owner(s) are credited and that the original publication in this journal is cited, in accordance with accepted academic practice. No use, distribution or reproduction is permitted which does not comply with these terms.
*Correspondence: Kunbo Xu, eHVrdW5ib0Buaml0LmVkdS5jbg==
Disclaimer: All claims expressed in this article are solely those of the authors and do not necessarily represent those of their affiliated organizations, or those of the publisher, the editors and the reviewers. Any product that may be evaluated in this article or claim that may be made by its manufacturer is not guaranteed or endorsed by the publisher.
Research integrity at Frontiers

Learn more about the work of our research integrity team to safeguard the quality of each article we publish.