- 1The State Key Laboratory of Advanced Electromagnetic Engineering and Technology, School of Electrical and Electronic Engineering, Huazhong University of Science and Technology, Wuhan, China
- 2The Hubei Electric Power Testing and Research Institute, Wuhan, China
Recently, with the fast development of renewable energy, various power-electronic-based devices have been widely incorporated in power systems, and controller saturation limiters have been broadly utilized, such as in voltage-source converter. It has been well recognized that these saturation limiters make sustained oscillations possible. To study the impact of saturation limiters, by considering the dynamical response of double saturation limiters in both the d-axis and q-axis of the alternating current control, this paper establishes single-input-single-output models for two novel phenomena including the double-clipped oscillation and single-clipped oscillation, based on the describing function. Then the describing-function-based Nyquist criterion is used to obtain the amplitude and frequency of the sustained oscillations. The model accuracy is verified by the electromagnetic transient simulation, and the influences of control parameters are extensively studied. All these findings clearly demonstrate that the saturation limiters play an active role in sustained oscillations in power-electronic-based power systems.
1 Introduction
The energy reform worldwide has been gradually promoting the reconstruction of power system with renewable energies as its main energy source, by transforming traditional power system into power-electronic-based power system (Yuan et al., 2017; Wang and Blaabjerg, 2019). The voltage-source converter (VSC) has become a dominant power electronic device and its control diversity and nonlinearity have made the system analysis very complicated. The oscillation problems related to the renewable energy integration, such as sub-synchronous (or super-synchronous) oscillation, high-frequency resonance, and wide-frequency-band oscillation (or called multi-frequency oscillation), have become popular topics in power systems (Larose et al., 2013; Sun et al., 2018; Chi et al., 2019), and the underlying mechanism remains to be uncovered.
For the ubiquitous oscillation problems in power systems, within the framework of nonlinear system theory, the sustained oscillation is generally believed as a limit cycle, which is induced by a supercritical Hopf bifurcation (Ji and Venkatasubramanian, 1995; Ma et al., 2020). Whereas within the framework of linear system theory, two dominant methods include the eigenvalue analysis based on the state space model in time domain (Kalcon et al., 2012; Wang et al., 2018; Yang et al., 2020a) and the Nyquist criterion based on the impedance/admittance model in complex frequency domain (Harnefors et al., 2007; Sun, 2011; Wen et al., 2016). Both can accurately analyze the system small-signal stability under small disturbances. Their equivalence was proved recently (Amin and Molinas, 2017; Rygg et al., 2017; Yang et al., 2020b). Basically, they are useful for analyzing oscillations in transient process, for either stable or unstable, and they cannot be used for analyzing sustained oscillations. On the other hand, as the saturation limiters have been widely installed for any power electronic device, it is generally believed that the saturation limiter plays an active role (Shah et al., 2019; Xue et al., 2019). Namely, in the initial short period, the voltage or current shows an exponential growth due to the system instability. Its continuous increase inevitably triggers the saturation limiter. Hence after the transient process, sustained oscillation becomes possible and persists (Reddy and Hiskens, 2005; Shah and Parsa, 2019). This route to sustained oscillations in power systems has been widely accepted.
When the saturation limiter is considered, two methods are usually employed including the electromagnetic transient (EMT) simulation (Liu et al., 2017; Xue et al., 2020) and the describing function (DF) (Gelb and Vander Velde, 1968; Wang, 2017; Liu et al., 2019). The ETM is purely numerical and usually used to verify the model accuracy. In a contrast, the DF method deals with the stationary input-output relation of nonlinear device by its fundamental-frequency, linear component, by using the Fourier expansion technique. It is workable for system analysis and has attracted widespread attention in the academic field. For instance, Vidal et al. (2001) used the DF to the analysis and design of oscillators and showed that the DF method can calculate the oscillation amplitude and frequency and determine the degree of distortion of the output signal. The DF method was also used to describe the pulse modulation of a DC-DC converter and analyze the system stability (Li et al., 2018). Recently, Xu et al. (2020) established a grid-tied VSC model by considering the alternating current control (ACC) and the phase-locked loop and analyzed the impact of the limiter on the system stability. In their work, the reference value of q-axis current in the ACC was always set to zero and their approach might ignore some phenomena that should be present in the system. Very recently, by considering the voltage outer loop, the DF-based Nyquist criterion was used to determine the amplitude and frequency for sustained oscillations (Wu et al., 2021).
As it is well known that the saturation limiters are ubiquitous in power electronic devices, such as the VSC. When the controller parameters are within the unstable regions, wide-frequency-band oscillation may occur. At this time, due to the nonlinearity and limited overload capability of the VSC, the oscillation phenomenon often starts from the divergence of the negative damping of the small signal, and finally ends in a nonlinear sustained oscillation (Xie et al., 2018). In this process, no matter in the initial divergence stage or the sustained oscillation stage, each limiter in the control system may be triggered or act simultaneously, so that the system may appear rich dynamics, such as the sustained oscillation phenomena. Meanwhile, the characteristics of the wide-frequency-band oscillation, such as oscillation frequency and amplitude, are easily affected by many factors such as wind and solar intensity, grid strength, and controller parameters. Therefore, the studies of the influence of controller parameters and the distribution of parametric stability region are important. All these will be studied in this paper.
This paper studies the grid-tied VSC system by considering the dynamics of the double saturation limiters, which are located on the d-axis and q-axis of the ACC. This is believed as a key difference with previous works (Xu et al., 2020; Wu et al., 2021). While improving the model, we also discover different oscillation phenomena and obtain the parametric stability regions that engineers and researchers are concerned about. As the double saturation limiters are considered, two different types of sustained oscillation are found, including the double-clipped oscillation (DCO) and single-clipped oscillation (SCO). Here the DCO refers to the phenomenon that the outputs of both saturation limiters show sustained oscillations, whereas the SCO refers to that the output of one limiter remains constant at the limiter boundary, and the other limiter has sustained oscillation. It is found that both the DCO and SCO are well analyzed by the DF method, and they are expected to be broadly observable in real systems.
The main contributions of the paper are as follows:
1) The paper establishes a multi-input-multi-output (MIMO) model of grid-tied VSC which considers the dynamics of both the d-axis and q-axis saturation limiters in the ACC. By separating the linear and the nonlinear parts, the MIMO model is simplified into a single-input-single-output (SISO) model, which can be easily further analyzed by the DF-based Nyquist criterion (DFNC). With these analyses, both the amplitude and frequency of sustained oscillations are analytically obtainable. The model accuracy is further verified by the EMT simulation.
2) The paper also studies the parametric stability region based on the state space method. Outside of the stable region, the influences of controller parameters and limiter boundary on the sustained oscillations are explored in detail. Again, these results are verified by the EMT simulation. They are expected to be helpful for controller design and parameter adjustment.
The structure of the paper is organized as follows. The DF and the DFNC with saturation limiter are introduced in Section 2. With the aid of the DF, Section 3 builds the grid-tied VSC model by considering the impact of the double saturation limiters. In Section 4, the influences of the control parameters and limiter boundary on the oscillation amplitude and frequency are investigated, and all results are compared with the EMT simulation. Finally, Section 5 is devoted to conclusion and discussions.
2 Principles of Describing Function and DF-Based Nyquist Criterion
2.1 Describing Function of Saturation Limiter
The DF has been widely used in nonlinear analysis and control in electronic power engineering (Vidal et al., 2001; Wang, 2017; Li et al., 2018; Liu et al., 2019; Xu et al., 2020; Wu et al., 2021). The DF of the nonlinear devices refers to the ratio of the fundamental component of the output signal to the input sinusoidal signal. It is essentially a method that uses the fundamental-frequency, linear characteristics to approximately describe the nonlinear characteristics of the devices. The nonlinear devices can be saturation limiter, dead zone, hysteresis loop, etc.
Generally, the DF can be expressed as
Where X denotes the amplitude of the input sinusoidal signal [x (t) = Xsin (ωt)], and B1+jA1 represents the output amplitude under the fundamental frequency (ω).
For an input sinusoidal signal, x (t) = Xsin (ωt), the output after the nonlinear device is usually non-sinusoidal. But we can express it by using the Fourier expansion as
where
For the saturation limiter studied in the paper, its input and output waveforms are illustrated in Figure 1, and its nonlinear characteristics is described by
where a denotes the limiter boundary.
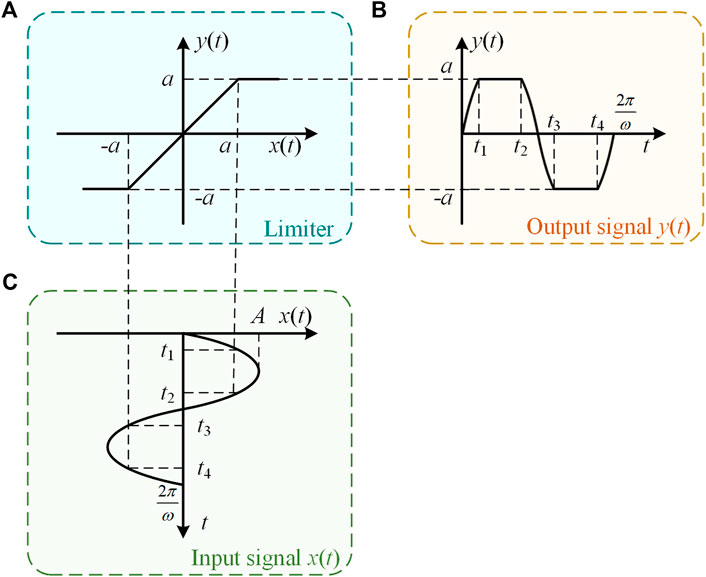
FIGURE 1. Schematic show for the input and output signals of the saturation limiter used in the describing function method. a is the limiter boundary, and A is the oscillation amplitude of the input signal. Both t1 to t2 and t3 to t4 represent the time when the limiter works.
Since the output signal is an odd function, Ai = 0 for all i = 0, 1, 2, …. The fundamental-frequency output signal can be simply expressed as
Therefore, we obtain the DF of the saturation limiter explicitly
Here we can find that the DF is a real function, and we will see that this is convenient for the oscillation analysis.
2.2 Stability Analysis Based on DF-Based Nyquist Criterion
First assume that the saturation limiter N(X), as the only one nonlinear component, can be separated from all linear components in the system [denoted by G(s) after linearization]. They form a unit negative feedback system, as shown in Figure 2, where letters r, e, and c represent the input, error, and output signals, respectively.
As the saturation limiter can be represented by a DF [N(X)], we obtain the transfer function of the closed-loop system
With the closed-loop characteristic equation
Therefore, the system stability should be determined by the relative position of the curve of N(X)G(s) and the point (−1, j0). As we know that the DF of the saturation limiter N(X) does not contain frequency variable s and G(s) does not contain any information of the saturation limiter, G(s) and N(X) can be separately analyzed. Based on the DFNC, we have.
1) If the curve of the transfer function G(s) surrounds the curve of −1/N(X), the closed-loop system is stable.
2) If the curve of the transfer function G(s) does not surround the curve of −1/N(X), the closed-loop system is unstable.
3) If the curve of the transfer function G(s) intersects the curve of −1/N(X), the closed-loop system should have a sustained oscillation (or a limit cycle in the language of nonlinear system). The oscillation amplitude and frequency can be further determined by the intersection directly.
These three cases are schematically shown in Figures 3A–C, respectively. The dashed lines in Figures 3A,B represent the Nyquist curve of G(s) when s starts from j0− and bypasses the origin to reach j0+. The arrow on the curve G(s) represents the increase direction of ω (s = jω). The arrow on the horizontal line N(X) represents the direction with the increase of X. Note that as the DF of the saturation limiter is always a positive, real function, −1/N(X) is exactly located on the negative real axis and it moves left with the increase of X, as shown in Figure 3.
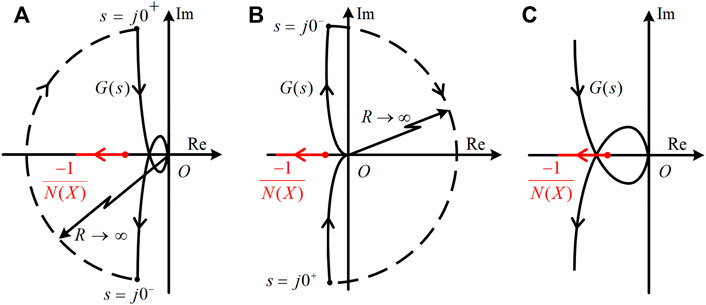
FIGURE 3. Three different cases of the DFNC for the relations between G(s) and -1/N(X): (A) the system is stable, (B) the system is unstable, and (C) the system has a sustained oscillation.
Consequently, based on the intersection of these two functions [G(s) and −1/N(X)], we can obtain its oscillation frequency from
And the oscillation amplitude from
The next step should be separating the saturation limiter from other linear parts for our specific grid-tied VSC system.
3 Grid-Tied Voltage-Source Converter Model Considering Double Saturation Limiters
3.1 System Description
Now we attempt to study the grid-tied VSC with the ACC and the phase-locked loop (PLL) and focus on the two different types of sustained oscillation caused by the saturation limiter: the DCO and SCO. The structure of the whole system is shown in Figure 4. Without losing generality, two saturation limiters are assumed to install at the outputs of the d-axis and q-axis PI controllers of the ACC. Here different with the previous relevant works (Xu et al., 2020; Wu et al., 2021), the reference value of the q-axis current i*qg is not fixed as zero, and the dynamics of both the d-axis and q-axis currents in the ACC will be studied. This treatment may better reflect the fact that saturation limiters are omnipresent in any realistic converters.
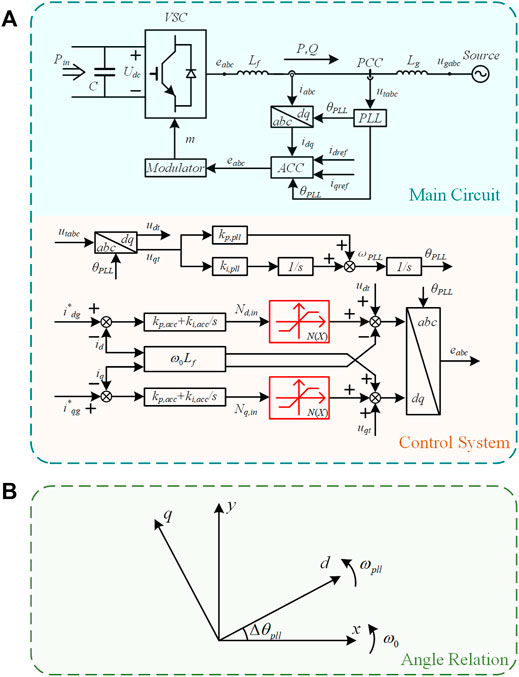
FIGURE 4. (A) Schematic show for the main circuit (top) and the control system (bottom) in the grid-tied VSC system. Two saturation limiters (highlighted by red) are installed at the output of the PI controller of the d-axis and the q-axis to limit the overcurrent, and their impacts on sustained oscillations are the main objective of this paper. (B) Schematic show for the angle relation between the constant synchronous xy frame and the PLL dq frame.
In the main circuit in Figure 4A, Lf and Lg represent the filter inductance and the equivalent grid inductance, respectively. In our study, the capacitor of the main circuit is regarded as a constant voltage source, i.e., Udc is a constant. We use ugabc to denote the three-phase voltage at an infinite grid, utabc the voltage at the point of common coupling, and eabc the terminal voltage of the VSC. The parameters kp,pll and ki,pll are the proportional and integral coefficients of the PLL, respectively. kp,acc and ki,acc are the proportional and integral coefficients of the ACC, respectively. Two saturation limiters denoted by N(X) are installed at the output of the PI controller of the d-axis and the q-axis to limit the overcurrent. Nd,in and Nq,in are the input signal of the d-axis limiter and the q-axis limiter, respectively. As usual, the controls rely on the classical vector-control method, and all the controllers work in the phase-locked dq frame. The angle relation between the phase-locked dq and the constant synchronous xy frames is schematically shown in Figure 4B. Hence the two coordinates rotate at frequencies ωpll and ω0, respectively, and their angle mismatch in the dynamical process is △θpll. Since the focus of this paper is mainly on the sub-synchronous and super-synchronous oscillation, we assume that the outer-loop voltage control at slower timescales and the signal modulation at faster timescales are ignored (Ma et al., 2020; Ma et al., 2021). Thus, the modulator can ideally output the internal voltage of the VSC (eabc).
3.2 Describing Function Model for the Double-Clipped Oscillation
The difference between the two phenomena, i.e., the DCO and the SCO, is clear. Their output waveforms are different. In the DCO, both limiters show a sustained oscillation, whereas in the SCO, only one limiter shows a sustained oscillation, and the output of the other limiter keeps constant.
First let us analyze the DCO. Based on the Kirchhoff Voltage Law, we obtain the following equations for the main circuit
where the subscripts x and y represent the electrical quantity within the synchronous xy frame. ω0 is the frequency of the system at the steady state.
Since the VSC is tied to an infinite grid, uxg and uyg are constant. Their corresponding small-signal equations are
As shown in Figure 4A, to improve stability, we consider the voltage feedforward and cross decoupling links in the ACC. When the DCO occurs, the output voltage for either the d-axis or the q-axis is composed of three parts: the output of the limiter, the feedforward voltage, and the cross-decoupling term. Therefore, we obtain the small-signal model for the ACC
where the subscripts d and q represent the electrical quantity in the PLL dq frame, Gacc(s) = kp,acc + ki,acc/s for the transfer function of the PI controller, and N(X) denotes the DF of the saturation limiter.
Based on the angle relation between the two different coordinates in Figure 4B, we have
where fx0 and fy0 represent the electrical quantity (voltage or current) in the steady state. Therefore, we obtain the q-axis voltage at the common point
As the input signal of the PLL is the q-axis voltage at the common point, the small-signal model for the PLL is given by
where Gpll(s) = kp,pll + ki,pll/s for the PI controller of the PLL. Combining Eqs 15–17 yields
Based on the above small-signal models of the main circuit, ACC, PLL, and saturation limiters in Eqs 12–18, we obtain
Finally, substituting Eq. 13 into Eq. 19 and eliminating △uyt yield
Where
These MIMO relations between [△ixg, △iyg] and [△i*dg, △i*yg] can be expressed in a compact form
Where
Figure 5A shows the corresponding MIMO model for the DCO, with the saturation limiter and other linear links well characterized and separated. Observing that both G’0_d(s) and N′(X) are diagonal matrices, we can further simplify the model into two independent, identical SISO models with the same structure and parameters, and the system stability should be solely determined by.
In addition, expanding the first element G11(s) in G’0_d(s), we obtain that its denominator contains s2 + Uxt0kp,plls + Uxt0ki,pll, Lfs2, and Lfs2 + [kp,accN(X)]s + ki,accN(X). Therefore, all these three denominator terms should have no any positive, real solution, and they do not intersect the positive real axis. Thus, G11(s) has no right-half-plane pole and it has no contribution to the system stability. Similarly, we can prove that the other three elements of the G’0_d(s) are similar. Therefore, we deduce that the system stability should be determined by G0_d(s) and N(X) only.
3.3 Describing Function Model for the Single-Clipped Oscillation
First for the SCO we assume that the output of the d-axis limiter is constant, i.e., it is fixed at the limiter boundary, but the output of the q-axis limiter oscillates. Therefore, the only difference between the DCO and SCO is the output of the d-axis in the ACC. Under this situation, the output of the q-axis is the same, but the linearized output of the d-axis should be composed of the feedforward voltage and cross-decoupling terms only. Hence correspondingly the small-signal dynamics of the ACC can be expressed as
The parts of the main circuit and the PLL are the same as that for the DCO. Combining Eqs 12, 13, Eqs 15–18, and Eq. 23, we obtain the SISO model of the system
where
Again, similar to the DCO, for G1_s(s) we obtain that its denominator term is Lfs2. Therefore, G1_s(s) has no right-half-plane pole and it has no effect on the system stability. The system stability should depend on G0_s(s) and N(X) only. The corresponding SISO model is given in Figure 5B. From Figure 5, it can be seen that for both the DCO and the SCO, the nonlinear limiter has been well separated from the other parts. In particular, for the DCO, the original MIMO model can be simplified into a SISO model. Therefore, for the analyses of the DCO and SCO, they share the same control diagram, expect the different, explicit forms of G0_d(s) for the DCO and G0_s(s) for the SCO. Next it is ready to use the DFNC to calculate the oscillation amplitude and frequency.
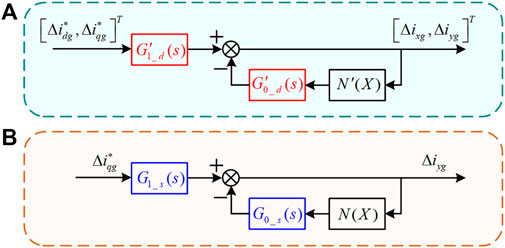
FIGURE 5. DF models for (A) the DCO and (B) the SCO. In (A), after the analyses of the DCO, the MIMO model can also be simplified as a SISO model.
4 Influencing Factor Analysis of Sustained Oscillations Based on DF-Based Nyquist Criterion
In this section, we will verify the above theoretical models by using the EMT simulations. In addition, we will analyze the influences of the control parameters and the limiter boundary on the oscillation amplitude and frequency. All these results should be helpful for stability assessment and oscillation suppression.
4.1 Model Verification
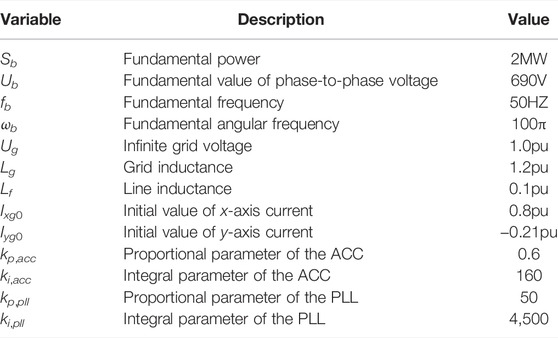
We carry out the EMT simulation for the grid-tied VSC system based on MATLAB/Simulink. As one example, without losing generality, the grid inductance Lg = 1.2 is chosen to represent a weak grid, and the other parameters are set as Lf = 0.1, Ug = 1.0, Ixg0 = 0.8, Iyg0 = −0.21. All these parameters are listed in Table 1 (Yang et al., 2020a; Ma et al., 2021). In addition, in Supplementary AppendixS1, we give the details for how to obtain the state-space model and the associated Jacobian matrix. All these can be used for small-signal stability analysis. Accordingly, the parametric stability regions for the ACC and the PLL are calculated and shown in Figures 6A,B, respectively. Within the stable regions, each variable converges to a stable fixed point. While outside of the stable regions, complex dynamic behaviors such as limit cycles or chaos may occur and lead to the action of the saturation limiters. Next, we will focus on exploring self-sustained oscillations and studying the limiter effects within the unstable regions.

FIGURE 6. (A) Parametric stability region for the ACC with a fixed Gpll = 50 + 4,500/s, and (B) that for the PLL with a fixed Gacc = 0.6 + 160/s. Both are in the weak grid.
First, the typical controller parameters are chosen: kp,acc = 0.6, ki,acc = 160, kp,pll = 310, and ki,pll = 10,000. The input waveforms of the d-axis and q-axis limiters from the EMT simulation are shown in Figures 7A,B, respectively. The corresponding waveform of the VSC terminal voltage ed is shown in Figure 7C. From Figures 7A–C it can be seen that the two limiters show sustained oscillations with a constant frequency and amplitude. Their frequency and amplitude are measured and presented in the panels. In addition, other variables also show a sustained oscillation with the same frequency. Therefore, the system exhibits the DCO for double-clipped oscillation for both d-axis and q-axis limiters.
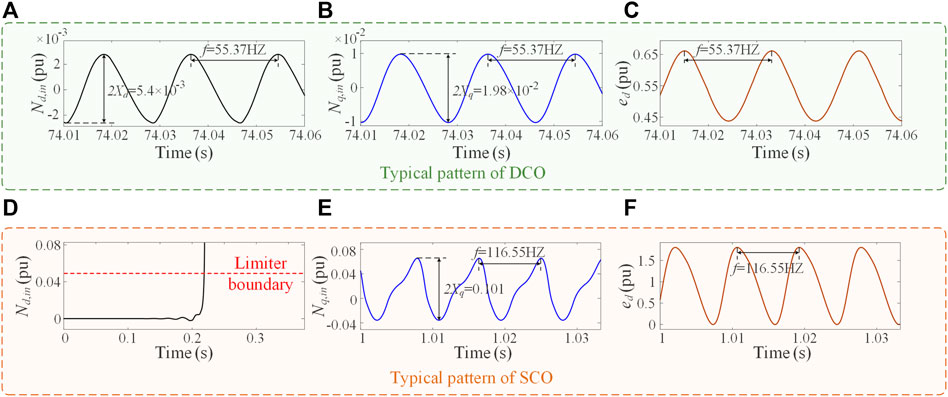
FIGURE 7. (A–C) are the typical pattern of DCO. (D–F) are the typical pattern of SCO. Different with the DCO, only one limiter at the q-axis exhibits a sustained oscillation, whereas the other one at the d-axis keeps constant after the action of the limit boundary. (A) and (D) are the input waveforms of the d-axis limiter. (B) and (E) are the input waveforms of the q-axis limiter. (C) and (F) are the waveforms of VSC terminal voltage ed.
Next, if we change the control parameters, the system dynamics could substantially change. For instance, when the parameters kp,acc = 0.6, ki,acc = 160, kp,pll = 315, and ki,pll = 20,000 are chosen, the typical pattern of SCO appears, as shown in Figures 7D–F. From Figure 7D, it can be seen that the input signal of the d-axis limiter does not show oscillation, and after it touches the limiter boundary (indicated by a dashed curve), it is fixed and remains constant. In a sharp contrast to this, in Figure 7E the q-axis limiter still exhibits a sustained oscillation with a constant amplitude. Again, the frequency is the same for all other variables, as shown in Figure 7F.
To further verify the accuracy of the theoretical model, the time-domain waveforms of id and iq under these two types of oscillation are given in Figure 8. Figures 8A,B are the waveforms under the first set of parameters. Oppositely, Figures 8C,D show the waveforms under the second set of parameters. It can be seen from the EMT simulation that the corresponding currents in the PLL dq frame also oscillate at 55.73HZ and 116.55HZ, respectively. The oscillation frequencies are consistent with the two cases in Figures 7C,F. Therefore, we can see that under these two sets of parameters, all system variables show sustained oscillations, indicating that both limiters need to be considered.
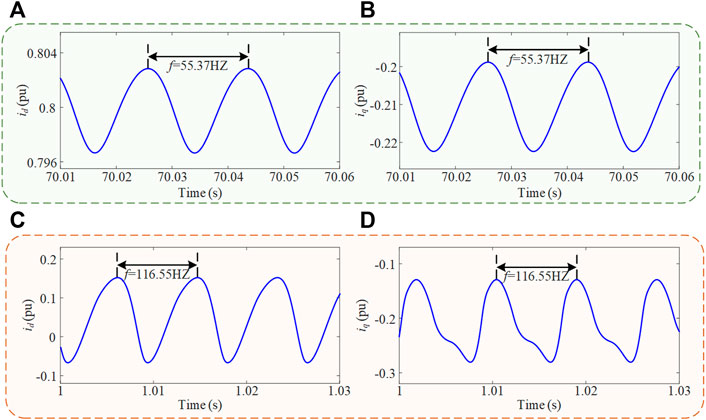
FIGURE 8. Current waveforms of id and iq under two types of oscillation: (A) and (B) for the DCO, and (C) and (D) for the SCO.
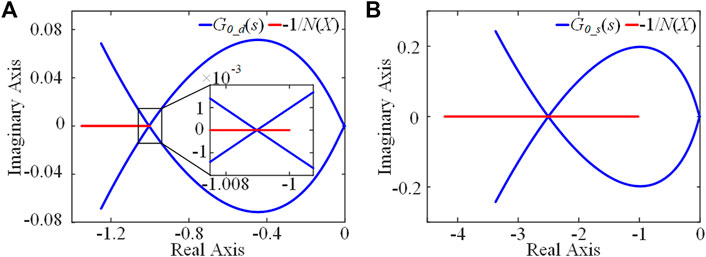
Then these EMT simulation results are compared with the DF models for both the DCO and SCO. We bring these two sets of controller parameters into G0_d(s) in Eq. 20 and G0_s(s) in Eq. 24 and plot their corresponding DFNC analytical results in Figures 9A,B, respectively. From these results, we can see that indeed the Nyquist curve of G0_d(s) and G0_s(s) intersect the negative reciprocal curve of the DF, −1/N(X), for the DCO and SCO, respectively, indicative of an occurrence of sustained oscillation. The detailed quantitative results are summarized in Table 2, where fmodel is the oscillation frequency from the DF model, fsim is the oscillation frequency from the EMT simulation, correspondingly Xmodel is the oscillation amplitude from the DF model, Xsim is the oscillation amplitude from the EMT simulation, and Ef and EX are their corresponding relative errors. Clearly for both the DCO and SCO, the mismatches are less than 10%, and comparatively the error for the SCO is much smaller. These comparisons well demonstrate the validity of the DF theoretical model.
4.2 Influence of Alternating Current Control Parameters
It is well-known that control parameters have a significant influence on the oscillations (Xue et al., 2019; Ma et al., 2020). We take the SCO model as an example. We still calculate the oscillation amplitude and frequency based on the DFNC and compare them with the corresponding EMT simulation results.
In this subsection, we study the ACC parameters. The parameters of the PLL are kp,pll = 315 and ki,pll = 20,000, with other parameters keeping unchanged. As the first study, we select the proportional coefficient of the ACC as kp,acc = 0.6 and gradually increase its integral coefficient ki,acc as 150, 160, and 170. The corresponding Nyquist curves of G0_s(s) for different ki,acc and −1/N(X) are shown in Figure 10A. Similarly, we keep ki,acc = 240 and gradually increase kp,acc as 0.8, 0.9, and 1.0, with the corresponding results shown in Figure 10B.
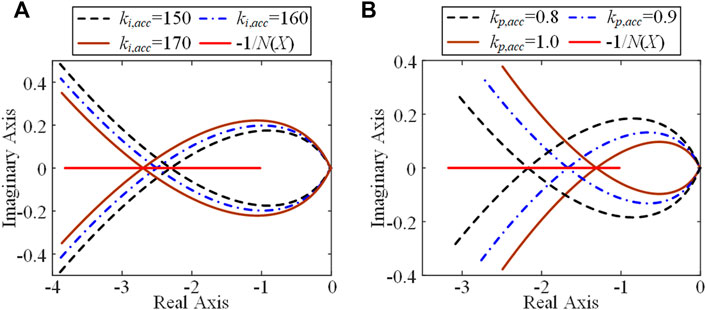
FIGURE 10. Six analytical results for different parameters of the ACC: (A) changes of ki,acc, and (B) changes of kp,acc.
From Figure 10 we can see that for different parameters, G0_s(s) always intersects with −1/N(X), i.e., the system always has sustained oscillations. In addition, from Figure 10A one can find that with increasing ki,acc, the oscillation amplitude gradually increases, as the intersection point moves left. Note that roughly N(X) is a monotonic-decrease function of X for a fixed a in Eq. 5. From Figure 10B, one can find that oppositely with increasing kp,acc, the oscillation amplitude gradually decreases, as the intersection point moves right.
The corresponding time-domain waveforms of the q-axis limiter under the above six different parameters are illustrated in Figure 11, for the variations of ki,acc and kp,acc, respectively. From these plots, we can see that the system really shows the predicted tendency of oscillation amplitude and frequency with the parameters, consistent with the DF analysis. For quantitative comparisons, Table 3 lists the oscillation amplitude and frequency from the model analyses and the numerical simulations, accompanying with their mismatches by relative errors. Basically, the error is tiny. Therefore, they have well proved the correctness of the DF analysis.
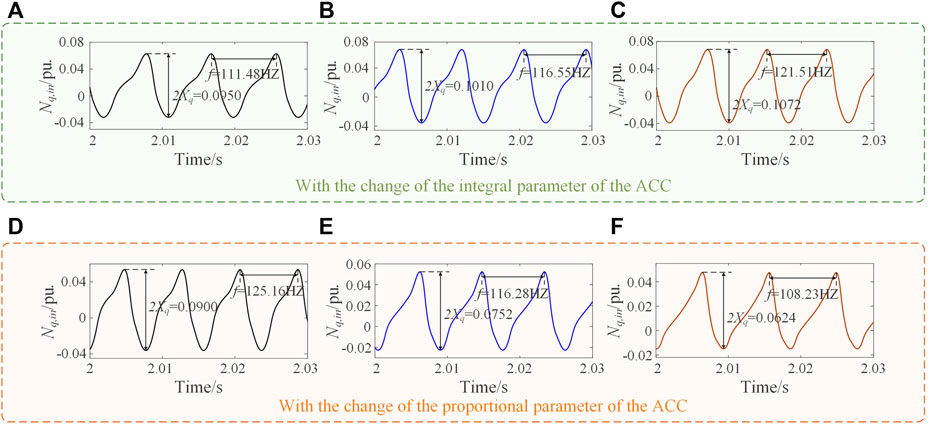
FIGURE 11. (A–C) are the time-domain waveforms of the q-axis limiter with the change of the integral parameter of the ACC. (D–F) are the Time-domain waveforms of the q-axis limiter with the change of the proportional parameter of the ACC. (A) Gacc = 0.6 + 150/s, (B) Gacc = 0.6 + 160/s, and (C) Gacc = 0.6 + 170/s. (D) Gacc = 0.8 + 240/s, (E) Gacc = 0.9 + 240/s, and (F) Gacc = 1.0 + 240/s.

TABLE 3. Comparison of theoretical model and numerical simulation under different parameters of the ACC.
4.3 Influence of Phase-Locked Loop Parameters
Now we study the PLL parameters. We keep the parameters of the ACC and change the proportional and integral parameters of the PLL. The corresponding DF results are shown in Figure 12. In Figure 12A, ki,pll = 15,000, 16,000, and 17,000. In Figure 12B, kp,pll = 290, 300, and 310. The DFNC plots again show that the system has the sustained oscillations for all these six cases. In addition, we know that for smaller ki,pll in Figure 12A and larger kp,pll in Figure 12B, the oscillation amplitude should increase.
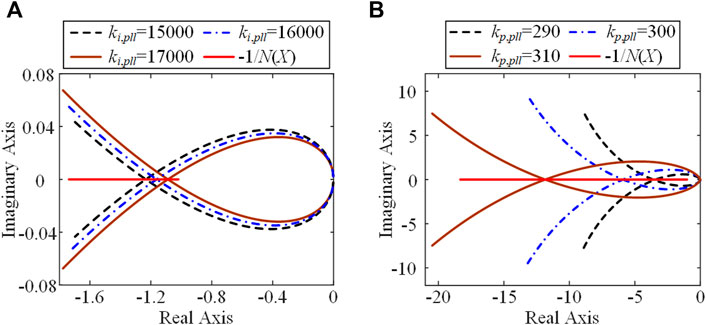
FIGURE 12. Six analytical results for different parameters of the PLL: (A) changes of ki,pll, and (B) changes of kp,pll.
For these six parameters of the PLL, the corresponding EMT simulation results are shown in Figure 13. Clearly the tendencies of the oscillation amplitude and frequency are consistent with the theoretical model. Again, the quantitative comparisons in Table 4 demonstrates that the oscillation amplitude and frequency predicted by the theoretical model are perfect. Finally, if we compare the variation ranges for all these four different parameter sets ki,acc, kp,acc, ki,pll, and kp,pll in Tables 2, 3, we can find that comparatively kp,pll has a greater influence than all other parameters. This might infer that kp,pll is a key parameter for oscillation suppression and stability improvement.
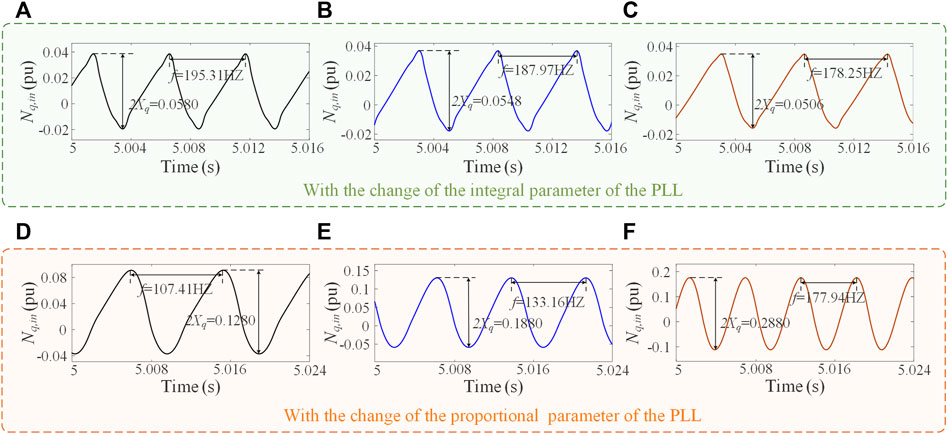
FIGURE 13. (A–C) are the time-domain waveforms of the q-axis limiter with the change of the integral parameter of the PLL. (D–F) are the time-domain waveforms of the q-axis limiter with the change of the proportional parameter of the PLL. (A) Gpll = 330 + 15000/s, (B) Gpll = 330 + 16000/s, and (C) Gpll = 330 + 17000/s. (D) Gpll = 290 + 30000/s, (E) Gpll = 300 + 30000/s, and (F) Gpll = 310 + 30000/s.

TABLE 4. Comparison of theoretical model and numerical simulation under different parameters of the PLL.
4.4 Influence of Limiter Boundary
For the system with the double saturation limiters, no matter whether the system has the DCO or SCO, we know that −1/N(X) is always located at the negative real axis, and G(s) is independent of the saturation limiter. In addition, according to the explicit DF for the saturation limiter in Eq. 5, the limiter boundary a is positively correlated with the oscillation amplitude X. Therefore, we may deduce that the size of the limiter boundary should affect the oscillation amplitude, but not the oscillation frequency, and in addition the oscillation amplitude should monotonically increase with the limiter boundary a.
These predictions have been well verified by the EMT simulation. For example, we keep all the main circuit parameters and the controller parameters unchanged, and set the limiter boundaries of the q-axis as 0.03, 0.028, and 0.026. Under these parameters, the Fourier spectrum analyses of the input signal of the q-axis limiter in Figure 14A shows that the oscillation frequencies are unchanged, but their amplitudes increase with the increase of a. Clearly this phenomenon is the same as what has been reported in the grid-tied VSC system with a single saturation limiter in the recent study (Wu et al., 2021).

FIGURE 14. (A) Frequency spectra of the input signal of the q-axis limiter under different limiter boundaries. (B) Comparison of waveforms of the input of the q-axis of the ACC, with and without the limiter.
In the end, let us study the extreme case of an infinite limiter boundary, i.e., the limiter is completely ignored. The EMT simulations are shown in Figure 14B, where clearly in the absence of the saturation limiter, the input of the q-axis of the ACC diverges after the initial exponential increase, whereas with the limiter, a sustained oscillation appears. Therefore, the limiter is a key factor for the appearance of sustained oscillation.
5 Conclusion and Discussions
In conclusion, this paper analyzes the sustained oscillations of the grid-tied VSC system with double saturation limiters by using the DF and the DFNC. With these methods, both the amplitude and frequency of the sustained oscillations can be well recognized. The model accuracy has been well verified by the EMT simulation. Different with previous works, both the d-axis and q-axis saturation limiters are considered. Thus, under this situation, the phenomena of not only the DCO but also SCO are widely observable. As we know, the saturation limiters have been broadly used in power electronic devices, and hence the study in the present work is believed as necessary and important. In addition, as the sustained oscillations are highly influenced by the control parameters, still by using the DF technique, the impacts of the PI controller parameters of the ACC and the PLL are studied. We find that the proportional coefficient of the PLL has the most significant influence. We also find that the limiter boundary size only affects oscillation amplitude, but not oscillation frequency, and the oscillation amplitude monotonically increases with the limiter boundary. All these findings are of significance for characteristic analysis of sustained oscillations in power-electronic-based power systems, where controller saturation effect is always unignorable.
Finally, it is necessary to give some necessary discussions:
1) Compared with the relevant recent studies of describing functions in (Xu et al., 2020; Wu et al., 2021), here we consider both the d-axis and q-axis saturation limiters, which are more realistic for electrical power engineering. In the instability process, the system variables may move away from the steady-state values and both the d-axis and q-axis saturation limiters may be triggered and act simultaneously. Generally, the impact of neither the d-axis nor the q-axis saturation limiters can be ignored. Based on this new model, we observe two new oscillation phenomena (DCO and SCO), which are not mentioned in all previous work due to the neglect of q-axis dynamics. To study these phenomena, we establish the corresponding transfer function and describing function matrix and find that even with these two saturation limiters, for the DCO, the original MIMO systems can be simplified as two identical SISO systems, and both the DCO and SCO can be analyzed in a similar manner. It is demonstrated that the describing function method is efficient. Therefore, compared with the previous papers (Xu et al., 2020; Wu et al., 2021), our model study has three key contributions in its integrity, phenomenology, and theory. We believe that our paper moves a big step to the study of self-sustained oscillations in grid-tied VSCs in more practical environments. In the future, other outer controllers, such as active power, reactive power, AC voltage, and DC voltage, should be considered.
2) Compared with the relevant recent studies of sustained oscillations in (Ji and Venkatasubramanian, 1995; Ma et al., 2020), the DF is only useful for sustained oscillations, which are induced by the saturation limiters, as we have seen in Figure 14B. For this phenomenon, we call it saturation-induced oscillation. In fact, there are other unusual phenomena, such as saturation-induced instability and saturation-restricted oscillation due to different bifurcation scenarios. Their dynamical nature and relation should be further studied.
3) As all oscillations reported in this paper have a wide frequency range, they may belong to the wide-frequency-band oscillation (Yuan et al., 2017; Chi et al., 2019; Wang and Blaabjerg., 2019). It seems that all controller parameters can have a contribution to the sustained oscillations, and comparatively kp,pll has a greater influence. The underlying mechanism needs to be investigated.
4) The characteristics of the saturation phenomenon is related to the fact that the input and output of the limiter are no longer the same. In this case, the closed-loop response characteristics of the entire system are greatly affected, so that the overshoot of the system increases and the adjustment time is prolonged (Peng et al., 1996; Shin and Park., 2012). In order to solve this problem, the anti-windup limiter was usually recommended (Murad et al., 2021), with the aim to eliminate the deterioration of closed-loop response characteristics caused by the limiter through some add-on compensators. The extended impact of the DF method on the anti-windup controller remains to be considered.
5) Finally, as this paper focuses on the saturation of the PI controller in the ACC and the associated sub-synchronous or super-synchronous oscillations, in future work it is interesting to consider the influence of the saturation limiter in the power control, voltage control, or modulator and explore low-frequency oscillation or ultra-high-frequency oscillation, which are also concerned in practical engineering.
Data Availability Statement
The original contributions presented in the study are included in the article/Supplementary Material, further inquiries can be directed to the corresponding author.
Author Contributions
YH, RM, and MZ contributed to the investigation, conception and design of the study, and revised it critically for important content. KC and CY contributed to case studies and result analysis. YH wrote the first draft of the manuscript. All authors contributed to the article and approved the submitted version.
Funding
This work was supported by the Science and Technology Project of State Grid, HUST-State Grid Future of Grid Institute under Grant 5100-202199549A-0-5-ZN.
Conflict of Interest
The authors declare that the research was conducted in the absence of any commercial or financial relationships that could be construed as a potential conflict of interest.
Publisher’s Note
All claims expressed in this article are solely those of the authors and do not necessarily represent those of their affiliated organizations, or those of the publisher, the editors and the reviewers. Any product that may be evaluated in this article, or claim that may be made by its manufacturer, is not guaranteed or endorsed by the publisher.
Supplementary Material
The Supplementary Material for this article can be found online at: https://www.frontiersin.org/articles/10.3389/fenrg.2022.873013/full#supplementary-material
References
Amin, M., and Molinas, M. (2017). Small-Signal Stability Assessment of Power Electronics Based Power Systems: A Discussion of Impedance- and Eigenvalue-Based Methods. IEEE Trans. Ind. Appl. 53 (5), 5014–5030. doi:10.1109/tia.2017.2712692
Chi, Y., Tang, B., Hu, J., Tian, X., Tang, H., Li, Y., et al. (2019). Overview of Mechanism and Mitigation Measures on Multi-Frequency Oscillation Caused by Large-Scale Integration of Wind Power. CSEE J. Power Energy Syst. 5 (4), 433–443. doi:10.17775/CSEEJPES.2019.01100
Gelb, A., and Vander Velde, W. E. (1968). Multiple-input Describing Functions and Nonlinear System Design. New York: McGraw-Hill Book Company.
Harnefors, L., Bongiorno, M., and Lundberg, S. (2007). Input-admittance Calculation and Shaping for Controlled Voltage-Source Converters. IEEE Trans. Ind. Electron. 54 (6), 3323–3334. doi:10.1109/tie.2007.904022
Ji, W., and Venkatasubramanian, V. (1995). Hard-limit Induced Chaos in a Single-Machine-Infinite-Bus Power System. Proc. 1995 34th IEEE Conf. Decis. Control 4, 3465–3470. doi:10.1109/CDC.1995.479121
Kalcon, G. O., Adam, G. P., Anaya-Lara, O., Lo, S., and Uhlen, K. (2012). Small-signal Stability Analysis of Multi-Terminal VSC-Based DC Transmission Systems. IEEE Trans. Power Syst. 27 (4), 1818–1830. doi:10.1109/tpwrs.2012.2190531
Larose, C., Gagnon, R., Prud'Homme, P., Fecteau, M., and Asmine, M. (2013). Type-III Wind Power Plant Harmonic Emissions: Field Measurements and Aggregation Guidelines for Adequate Representation of Harmonics. IEEE Trans. Sustain. Energy 4 (3), 797–804. doi:10.1109/tste.2013.2252209
Li, H., Shang, J., Zhang, B., Zhao, X., Tan, N., and Liu, C. (2018). Stability Analysis with Considering the Transition Interval for PWM DC-DC Converters Based on Describing Function Method. IEEE Access 6, 48113–48124. doi:10.1109/access.2018.2857846
Liu, H., Xie, X., He, J., Xu, T., Yu, Z., Wang, C., et al. (2017). Subsynchronous Interaction between Direct-Drive PMSG Based Wind Farms and Weak AC Networks. IEEE Trans. Power Syst. 32 (6), 4708–4720. doi:10.1109/tpwrs.2017.2682197
Liu, Q., Li, C., Song, X., Liu, Q., and Chen, Y. (20192019). “Analysis of Governor’s Dead Band on Frequency Stability of System Based on Describing Function Method,” in IEEE 8th International Conference on Advanced Power System Automation and Protection (APAP), 621–625. doi:10.1109/APAP47170.2019.9224728
Ma, R., Qiu, Q., Kurths, J., and Zhan, M. (2021). Fast-Slow-Scale Interaction Induced Parallel Resonance and its Suppression in Voltage Source Converters. IEEE Access 9, 90126–90141. doi:10.1109/ACCESS.2021.3091510
Ma, R., Yang, Z., Cheng, S., and Zhan, M. (2020). Sustained Oscillations and Bifurcations in Three‐phase Voltage Source Converter Tied to AC Grid. IET Renew. Power Gener. 14 (18), 3770–3781. doi:10.1049/iet-rpg.2020.0204
Murad, M. A. A., Liu, M., and Milano, F. (2021). Modeling and Simulation of Variable Limits on Conditional Anti-windup PI Controllers for VSC-Based Devices. IEEE Trans. Circuits Syst. I 68 (7), 3079–3088. doi:10.1109/TCSI.2021.3073103
Peng, Y., Vrancic, D., and Hanus, R. (1996). Anti-windup, Bumpless, and Conditioned Transfer Techniques for PID Controllers. IEEE Control Syst. 16 (4), 48–57. doi:10.1109/37.526915
Reddy, P. B., and Hiskens, I. A. (2005). Limit-induced Stable Limit Cycles in Power Systems. IEEE Russ. Power Tech. 1-5. doi:10.1109/ptc.2005.4524706
Rygg, A., Molinas, M., Zhang, C., and Cai, X. (2017). On the Equivalence and Impact on Stability of Impedance Modeling of Power Electronic Converters in Different Domains. IEEE J. Emerg. Sel. Top. Power Electron. 5 (4), 1444–1454. doi:10.1109/jestpe.2017.2744988
Shah, S., Koralewicz, P., Gevorgian, V., Wallen, R., Jha, K., Mashtare, D., et al. (2019). Large-signal Impedance-Based Modeling and Mitigation of Resonance of Converter-Grid Systems. IEEE Trans. Sustain. Energy 10 (3), 1439–1449. doi:10.1109/tste.2019.2903478
Shah, S., and Parsa, L. (2019). Impedance-based Prediction of Distortions Generated by Resonance in Grid-Connected Converters. IEEE Trans. Energy Convers. 34 (3), 1264–1275. doi:10.1109/tec.2019.2904674
Shin, H.-B., and Park, J.-G. (2012). Anti-windup PID Controller with Integral State Predictor for Variable-Speed Motor Drives. IEEE Trans. Ind. Electron. 59 (3), 1509–1516. doi:10.1109/TIE.2011.2163911
Sun, J. (2011). Impedance-based Stability Criterion for Grid-Connected Inverters. IEEE Trans. Power Electron. 26 (11), 3075–3078. doi:10.1109/tpel.2011.2136439
Sun, K., Yao, W., and Wen, J. (2018). Mechanism and Characteristics Analysis of Subsynchronous Oscillation Caused by DFIG-Based Wind Farm Integrated into Grid through VSC-HVDC System. Proc. Chin. Soc. Electr. Eng. 38 (22), 6520–6533. doi:10.13334/j.0258-8013.pcsee.172415
Vidal, E., Poveda, A., and Ismail, M. (2001). Describing Functions and Oscillators. IEEE Circuits Devices Mag. 17 (6), 7–11. doi:10.1109/101.968910
Wang, T. (2017). Analyzing Oscillators Using Describing Functions. Available at https://arxiv.org/abs/1710.02000v1.
Wang, X., and Blaabjerg, F. (2019). Harmonic Stability in Power Electronic-Based Power Systems: Concept, Modeling, and Analysis. IEEE Trans. Smart Grid 10 (3), 2858–2870. doi:10.1109/tsg.2018.2812712
Wang, Y., Wang, X., Chen, Z., and Blaabjerg, F. (2018). Small-signal Stability Analysis of Inverter-Fed Power Systems Using Component Connection Method. IEEE Trans. Smart Grid 9 (5), 5301–5310. doi:10.1109/tsg.2017.2686841
Wen, B., Boroyevich, D., Burgos, R., Mattavelli, P., and Shen, Z. (2016). Analysis of D-Q Small-Signal Impedance of Grid-Tied Inverters. IEEE Trans. Power Electron. 31 (1), 675–687. doi:10.1109/tpel.2015.2398192
Wu, T., Jiang, Q., Shair, J., Mao, H., and Xie, X. (2021). Inclusion of Current Limiter Nonlinearity in the Characteristic Analysis of Sustained Subsynchronous Oscillations in Grid-Connected PMSGs. IEEE Trans. Energy Convers. 36 (3), 2416–2426. doi:10.1109/tec.2020.3045296
Xie, X., Liu, H., He, J., Liu, H., and Liu, W. (2018). On New Oscillation Issues of Power Systems. Proc. CSEE 38 (10), 2821–2828+3133. doi:10.13334/j.0258-8013.pcsee.172662
Xu, Y., Gu, Z., and Sun, K. (2020). Characterization of Subsynchronous Oscillation with Wind Farms Using Describing Function and Generalized Nyquist Criterion. IEEE Trans. Power Syst. 35 (4), 2783–2793. doi:10.1109/tpwrs.2019.2962506
Xue, A., Fu, X., Wang, J., Li, C., and Qiao, D. (2020). Switched Chaotic Oscillation and Non-smooth Bifurcation Characteristics of DFIG System. Electr. Power Autom. Equip. 40 (9), 170–176. doi:10.16081/j.epae.202009005
Xue, A., Fu, X., Wang, Z., and Wang, J. (2019). Analysis of Sub-synchronous Band Oscillation in a DFIG System with Non-smooth Bifurcation. IEEE Access 7, 183142–183149. doi:10.1109/access.2019.2960527
Yang, Z., Ma, R., Cheng, S., and Zhan, M. (2020a). Nonlinear Modeling and Analysis of Grid-Connected Voltage-Source Converters under Voltage Dips. IEEE J. Emerg. Sel. Top. Power Electron. 8 (4), 3281–3292. doi:10.1109/jestpe.2020.2965721
Yang, Z., Mei, C., Cheng, S., and Zhan, M. (2020b). Comparison of Impedance Model and Amplitude-phase Model for Power- Electronics-Based Power System. IEEE J. Emerg. Sel. Top. Power Electron. 8 (3), 2546–2558. doi:10.1109/JESTPE.2019.2927109
Keywords: grid-tied voltage-source converter, double saturation limiters, sustained oscillations, describing function, oscillation amplitude and frequency
Citation: Huang Y, Ma R, Zhan M, Cao K and Ye C (2022) Describing Function Analysis of Sustained Oscillations in Grid-Tied Voltage-Source Converter With Double Saturation Limiters. Front. Energy Res. 10:873013. doi: 10.3389/fenrg.2022.873013
Received: 10 February 2022; Accepted: 20 April 2022;
Published: 26 May 2022.
Edited by:
Thi Ha Nguyen, University of Connecticut, United StatesReviewed by:
Meng Huang, Wuhan University, ChinaTran The Hoang, Commissariat à l'Energie Atomique et aux Energies Alternatives (CEA), France
Copyright © 2022 Huang, Ma, Zhan, Cao and Ye. This is an open-access article distributed under the terms of the Creative Commons Attribution License (CC BY). The use, distribution or reproduction in other forums is permitted, provided the original author(s) and the copyright owner(s) are credited and that the original publication in this journal is cited, in accordance with accepted academic practice. No use, distribution or reproduction is permitted which does not comply with these terms.
*Correspondence: Meng Zhan, emhhbm1lbmdAaHVzdC5lZHUuY24=
 Yifan Huang
 Rui Ma
 Meng Zhan1*
