 Ziwei Cheng1*
 David W. Gao1,2Fiona M. Powers1,3
 Ricardo Navar1
 Juan H. Leal1Oyelayo O. Ajayi4
 Troy A. Semelsberger1*
- 1Material Physics Applications Division, Los Alamos National Laboratory, Los Alamos, NM, United States
- 2Department of Chemical and Biomolecular Engineering, University of California, Los Angeles, United States
- 3Department of Mechanical Engineering, Montana State University, Bozeman, MT, United States
- 4Applied Materials Division, Argonne National Laboratory, Argonne, IL, United States
Continuous feeding, processing, and handling of biomass powders is pivotal to the economic viability of integrated biorefineries. However, current challenges associated with the operational reliability of bulk solids handling and transport greatly impact the process economics and ultimately the widespread commercialization of integrated biorefineries. In this work, we examine the effect of moisture and feedstock variability on the flow behavior of corn stover biomass particles. The total flow energy, compressibility, shear properties, and wall friction angles were measured for corn stover samples A and B containing 0%, 15%, 25%, 50%, and 75% (mass fraction) moisture contents using a FT4 powder rheometer. In general, the flowability of both A and B was reduced when moisture was present as indicated by the stability and variable flow rate, compressibility, and shear tests. The 15% moisture sample had the highest flow energy, revealing the interplay between the increased surface tension and looser packing both of which were caused by liquid bridging. The 75% moisture sample had the highest compressibility and the lowest flowability factor (ffc). The trend in wall friction angle was found to be dependent upon the surface hydrophobicity of the wall material. The wall friction angle on the hydrophilic, stainless-steel surface increased with moisture and therefore poses additional handling challenges. On the other hand, the wall friction angle on the hydrophobic polymer surfaces were the lowest for samples with intermediate moisture contents. Sample B had greater bulk density, smaller compressibility, and greater flowability than the sample A, as suggested by the compressibility and shear tests. The wall friction angle of sample B was higher than or equal to that of sample A depending on both the type and the surface roughness of the wall material.
1 Introduction
As global fossil fuel resources continue to diminish and awareness on greenhouse gas emissions and national energy security grow, the industrial and research communities have been seeking alternative renewable sources to produce fuels and chemicals. Non-edible biomass such as forestry and agricultural wastes has become an attractive option because it is renewable, abundant, and does not compete with the global food supply. Biorefineries are processing facilities that convert biomass into value-added products such as biofuels, biochemicals, bioenergy, and other biomaterials (Ng et al., 2017). An integrated biorefinery (IBR) employs various combinations of feedstock and conversion technologies to produce a variety of products. Despite decades of research and development, IBRs have still not been commercialized due to challenges in their economic viability. Achieving the economic viability of IBRs calls for the continuous, reliable operation of biomass processing and handling equipment. However, existing bulk solids handling equipment was often designed for the continuous flow of coal, and it is common for biomass-sourced bulk solids to clog, jam, and form arches and ratholes in them. These flow stoppages result in down times and increased operational costs associated with shutting down, unclogging, cleaning, and restarting the equipment, hampering the process economics. It is therefore crucial to understand the flow behavior of biomass so that processing and handling equipment can be redesigned to ensure continuous flow.
The flow behavior of biomass is based upon many intrinsic and extrinsic factors, such as particle size, shape, chemical composition, degree of self-heating, ash content, and moisture. Among these properties, moisture in general negatively impacts the flow of biomass bulk solids and therefore has been extensively researched. Prior literature works on the flow behavior of biomass-sourced bulk solids have demonstrated that the indicators for flowability can be either sensitive or insensitive to moisture depending on the type of biomass and the moisture content being studied. Mattsson et al. (Mattsson and Kofman, 2003) determined the bridging tendency of willow shoot particles with different particle sizes and moisture contents using an in-house built bridging apparatus. Two moisture levels from each particle size group were studied, ranging from 15.7 wt% to 58.1 wt%. The critical diameter to avoid bridging was always higher for the high moisture sample. In a follow-up work from the same group, Jensen et al. (2004) determined the bridging tendency of whole trees, logging residues, and roundwood fuels processed by different chippers with various moisture contents. When the type of wood, processing equipment, and particle size distribution were kept constant, while sample moisture was adjusted through drying, a decrease in the tendency to bridge was observed in most samples. For a few samples, drying did not affect the tendency to bridge. Thompson and Ross (1983) reported that the coefficient of friction (µ) of wheat grain on a steel surface increased with increasing moisture content from 8 to 20%, but at 24% moisture content, it decreased.5Afzalinia and Roberge (2007) studied the wall friction coefficient of alfalfa and barley straw on a stainless steel surface. Both materials had increased wall friction angles with moisture. For alfalfa, µ showed a quadratic relationship within the range of 12.0–42.2 wt% moisture content. For barley straw, however, µ showed a linear relationship within the range of 12.2–45.7 wt% moisture content. Ileleji and Zhou (2008) measured the angle of repose of high moisture (63.2 wt% water) and low moisture (7.2 wt% water) bulk corn stover particles; they found the high moisture sample has much higher angle of repose than the low moisture sample. Littlefield et al. (2011) studied the effect of moisture on the compression, angle of repose, and shear properties of pecan shells. Five samples, ranging from 4.2 to 24.6 wt% moisture were used. It was discovered that the bulk density, particle density and tap density linearly decreased with increase in moisture. Both the compressibility and angle of repose increased with the increase in moisture. As for the shear properties, the cohesion significantly increased with the increase in moisture, and the flowability factor dropped from free-flowing regime (ffc > 10) to the cohesive regime (2 < ffc < 4) with the increase in moisture. The angle of internal friction, however, was not affected by the change in moisture. Gil et al. (2013) investigated the effect of moisture on the shear properties and wall friction angles of poplar and corn stover powders using a Jenike shear cell tester. Again, only a low moisture (7–9 wt% water) and a high moisture (28–33 wt% water) sample were used. The cohesion, unconfined yield stress, major principal stress, and static and effective angles of internal friction were all higher in the high moisture poplar and corn stover samples than the low moisture samples. The wall friction angle on the stainless steel surface was higher for the high moisture poplar and corn stover sample, while the wall friction angle on the high molecular polyethylene (HMPE) surface was lower for the high moisture poplar and corn stover samples. Crawford et al. (2016) studied the effect of moisture on the compression, shear, and wall friction properties of corn stover using a Freeman FT4 powder rheometer. Only one stainless steel surface was used for the wall friction test. Only a 50 wt% (water) and a dry sample were used for comparison. The corn stover sample had greater compressibility, static and effective angles of internal friction, cohesion, unconfined yield stress, major principal stress and wall friction angle than the dry corn stover sample. These conclusions were in good agreement with the work of Gil et al. (2013), Stasiak et al. (2019) used a Jenike shear tester and a Schulze ring shear tester to measure the shear properties of pine sawdust, shavings and pellets as a function of moisture. Six wet samples (10, 20, 30, 40, 50 and 60 wt% water) were used. They have also constructed a vane shear tester (VST) to measure the torque exerted by the sample. It was observed that the torque measured by the VST increases monotonically with moisture for all three types of pine samples on both testers. However, the moisture did not significantly affect the cohesion, apparent shear stress or the flowability factor.
Although the aforementioned studies have investigated the effect of moisture on the flow properties of corn stover and other biomass feedstocks, most studies focused on shear properties and dynamics data were lacking. In addition, only a few moisture levels within a narrow moisture range of no more than 50 wt% was covered in these studies, and flowability data on biomass powders with high moisture contents are very limited. Little studies were focused on the difference in flow properties of agricultural biomass materials harvested from different bales. Surface property measurements, such as surface energy and surface area, have been not used alongside rheological measurements to correlate flow to surface properties. To bridge these gaps, the effect of moisture and feedstock variability on the rheological properties of corn stover powders was investigated. The objective of this study is to measure the dynamics, bulk, shear, and surface properties of dry and wet corn stover samples harvested from different bales and evaluate how these properties are affected by moisture in these different bales. A wide range of moisture contents will be covered, ranging from 0 wt% to 75 wt%, to obtain a complete moisture profile.
2 Materials and Methods
2.1 Corn Stover Samples
Corn stover refers to non-edible portions of the plant—including the stem, leaves, stalk and cob. Corn stover is the largest single agricultural resource with an estimated production of 154–232 million dry metric tons per annum (Leal et al., 2019). The abundance of corn stover therefore makes it a desirable biomass feedstock. The corn stover samples referred to as A and B used in this work were from two different bales that were both harvested from Poweshiek County in Iowa, United States. Both were baled using a Heston 2270XD square baler in October 2018. The ash contents of A and B were very similar - 7% and 6%, respectively. The grinding and milling were carried out at Idaho National Laboratory (INL, Idaho Falls, Idaho, USA). The bales were processed through a Vermeer BG480 bale processer with a 75 mm screen then a Bliss Hammermill with a 25 mm screen at the Biomass Feedstock National User Facility (BFNUF) located at INL. Select samples were collected after the second mill, then milled to pass a 2 mm screen (Ray et al., 2020). Particle size distributions were provided by Idaho National Laboratory and are presented in the Supplementary Tables S1, S2.
2.2 Sample Preparation
The subsequent drying and wetting for the as-received A and B was carried out at Los Alamos National Laboratory (Los Alamos, New Mexico, United States). Samples were placed through various drying and wetting steps, indicated by
(1) Drying of the as-received sample
(2) Wetting at x wt% moisture
(3) Drying of the wet sample
(4) Re-wetting of the sample using x wt% moisture
(5) Re-drying of the sample
SCHEME 1. The wetting and drying protocol for corn stover A.
The as-received A and B samples were placed in an oven kept at 45°C for 24 h to remove any existing moisture. The dried A and B were referred to as
where mwater is the mass of water added, and mDCS is the mass of the dry corn stover.
Four mixtures containing 15%, 25%, 50% and 75% moisture content were prepared for each corn stover sample (Figure 1). Samples were labelled as AX and BX, where X is the moisture wt% Photos of dry and wet A samples are shown in Supplementary Figure S1. These wet A and B samples, together with A0 and B0, were analyzed using a powder rheometer with details provided in Section 2.3. Additionally, all dried samples were analyzed with Inverse Gas Chromatography (IGC) to study the changes in the surface of the biomass.
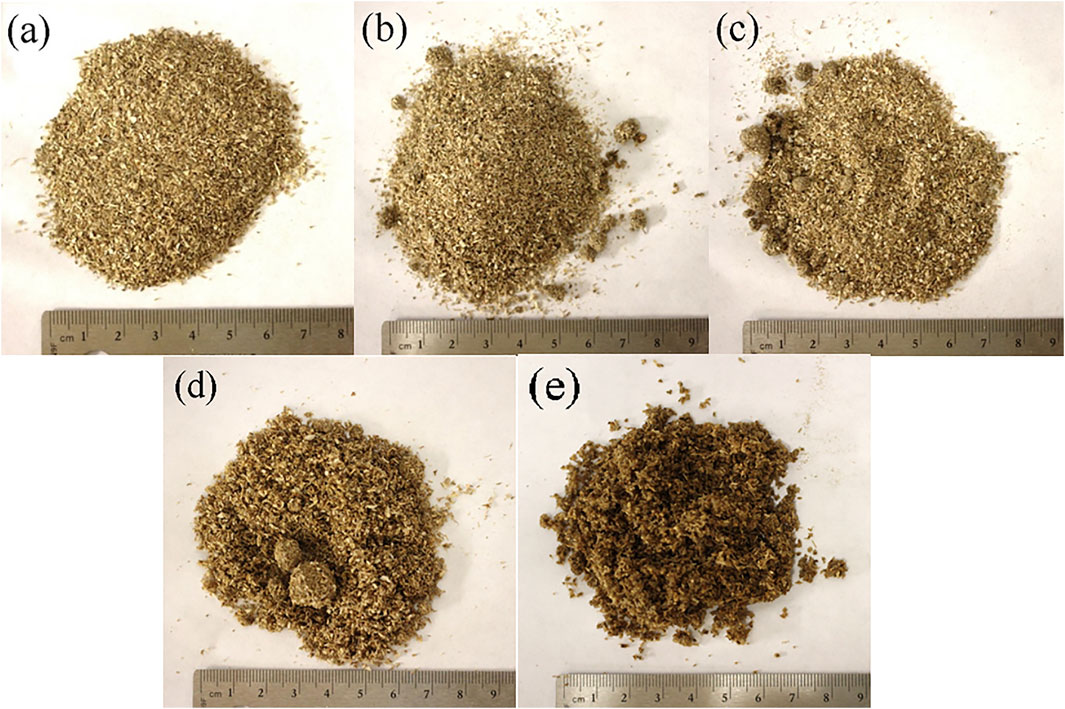
FIGURE 1. Images of the (A) dry, (B) 15% moisture, (C) 25% moisture, (D) 50% moisture, and (E) 75% moisture A samples. The ruler is included in each image for scale.
For the wetting-redrying study, a separate batch of as-received corn stover A was first dried to remove any existing moisture (i.e.,
2.3 Powder Rheometer
The rheological properties of the dry and wet samples A and B were analyzed using a Freeman FT4 powder rheometer (Freeman Technology Ltd., UK). The instrument can run shear, bulk, and dynamics properties testing. Because powders can be subject to shear, stirring and compression forces during processing and handling, all three types of testing need to be conducted to understand the flow behavior of powders when they are subject to different types of forces. Shear properties testing measures the flow properties of a powdered sample when its top surface is subject to shear. These include shear and wall friction tests. Bulk property testing measures the properties of the powder as a bulk, such as bulk density and % compressibility under different consolidation pressures. Dynamics properties testing measures the flow properties of the powder under constant stirring, such as the flow energy. In this work, we conduct all three types of tests to access the flow behavior of corn stover in different powder handling processes. The details in the test methods are provided in Section 2.3.1 through Section 2.3.4.
Four types of fixtures—a 48 mm diameter blade, a 48 mm diameter vented piston, a 48 mm diameter shear cell, and a 48 mm diameter wall friction disk assembly were used. Different fixtures were attached to the instrument depending on the type of test performed. For the stability and variable flow rate test, a sample holder 160 ml in volume and 50 mm in inner diameter was used. For the other tests, a sample holder 85 ml in volume and 50 mm in inner diameter was used. Each testing program starts with one or more conditioning cycles where the blade rotates into the bottom of the powder bed and rotates back up to the initial position. This blade action eliminates any prior stress history of the sample. Next, the top portion of sample was manually split off using the splitting mechanism on the sample holder shown in Figure 2, so that the amount and height of the sample was always consistent before the start of testing steps. Each test was run repeatedly for at least five times to ensure reproducibility. The error bars were calculated as the standard deviation of these five runs.
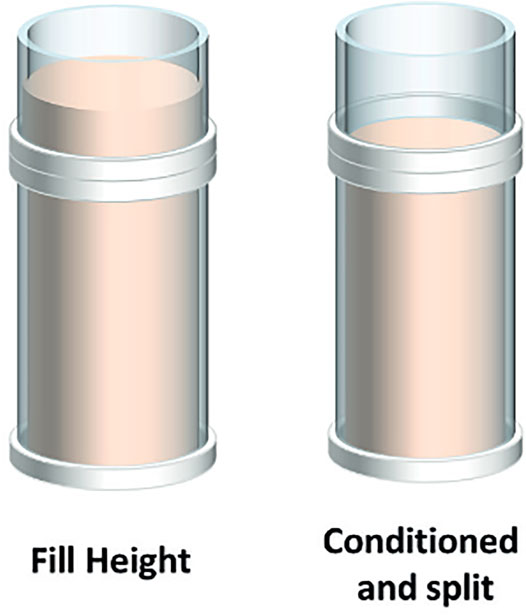
FIGURE 2. Splitting mechanism on all the sample holders used in this work. Adapted with permission from Freeman et al. (2015).
2.3.1 Shear Test
Shear testing yields rich information about the strength of the bulk solid and the interaction among the particles themselves. During shear testing, the sample was first conditioned once using the 48 mm diameter blade to remove any previous stress history. Next, a vented piston 48 mm in diameter was used to compress the sample to 9 kPa of normal stress. Then the top portion of the sample was split off, the vented piston was removed and a shear cell 48 mm in diameter was attached. The shear cell has 18 blades. The shear cell was first lowered into the powder bed to be in contact with the sample to reach 9 kPa normal stress. This is also referred to as “pre-shear” stress. Then the shear cell started rotating at an angular velocity of 18°/min. The sample was sheared at 9 kPa until the shear stress reaches a steady state as defined by the measured shear stresses having less than 1% difference. Subsequently, the normal stress was reduced, allowing room for the particles to distend and move past one another. At that point, a yield stress could be measured (Crawford et al., 2016). The sample was again pre-sheared at 9 kPa and then sheared at a smaller normal stress of 7 kPa. The pre-shear/shear cycles were repeated at decreasing normal stresses of 6, 5, 4, 3, 2, and 1 kPa. The shear stress vs. normal stress plot was referred to as the yield locus. The yield locus was then analyzed using the FT4 data analysis software. Mohr’s stress circle analysis was carried out to find the cohesion, unconfined yield strength (UYS), major principal stress (MPS), static angle of internal friction (ϕi), and effective angle of internal friction (ϕe). The flowability factor, ffc, is defined as the ratio between the major principal stress to the unconfined yield strength and is used to compare the flowability of the samples.
2.3.2 Compressibility Test
The compressibility test measures changes in sample volume (%) as a function of a series of mechanical forces (normal pressures) applied downward on the vertical axis via a vented piston. Initially, an accurate estimation of the sample volume was problematic as the loading of the wet sample produced poor consolidation resulting in large voids within the bulk. To overcome this, the initial conditioning step was replaced with the following steps:
(1) Load 1/6 (volume) of the sample into the sample holder
(2) Place a flat 50 g weight over sample
(3) Tap weight 3 times, elevating the weight at ca. 2 inches from the sample
(4) Split off portion above split level
(5) Attach 48 mm vented piston
Steps 1–3 were repeated 3 times, until the final volume was 2/3 full (over the sample split-level). The piston started compressing the sample at a range of increasing applied normal stresses between 0.5 and 15 kPa. The compressibility of the sample (C), as can be seen in Eq. 2, is calculated as follows:
where V0 is the volume of the sample before compression and V is the volume of the sample at a given applied normal stress. Aside from compressibility, this test also outputs the initial bulk density of the sample before compression. Photos of the dry and wet samples before and after compression are given in Supplementary Figure S1.
2.3.3 Stability and Variable Flow Rate Test
The stability and variable flow rate test measures the amount of work a blade exerts to move through a bed containing the powdered sample. First, the sample was conditioned once using the 48 mm diameter blade, and the top portion was then split off. The testing procedure involves 11 alternating conditioning and testing cycles. In each conditioning cycle, the blade rotates down clockwise into the sample holder to 35 mm above the bottom of the powder bed; then, it travels up clockwise to the initial height. In each testing cycle, the blade rotates clockwise as it travels to 35 mm above the bottom of the sample holder. The 35 mm minimum height was chosen to avoid force and torque overloads when running the wet samples with high flow energies. Photos of sample A with 75% moisture
The work the blade has done during each test cycle was calculated from force and torque recordings and referred to as the total energy (E), as shown in Eq. 3:
where H is the instantaneous penetration depth, T is the measured torque, R is the radius of the blade, α is the blade helix angle, and F is the measured axial force. A helix angle of 5° was used for all the tests.
The linear velocity of the blade was 100 mm/s for the first eight testing cycles, and decreases to 70, 40, and 10 mm/s for the ninth, tenth and eleventh testing cycles, respectively. An illustration of the test setup and calculation of the total energy is shown in Figure 3.
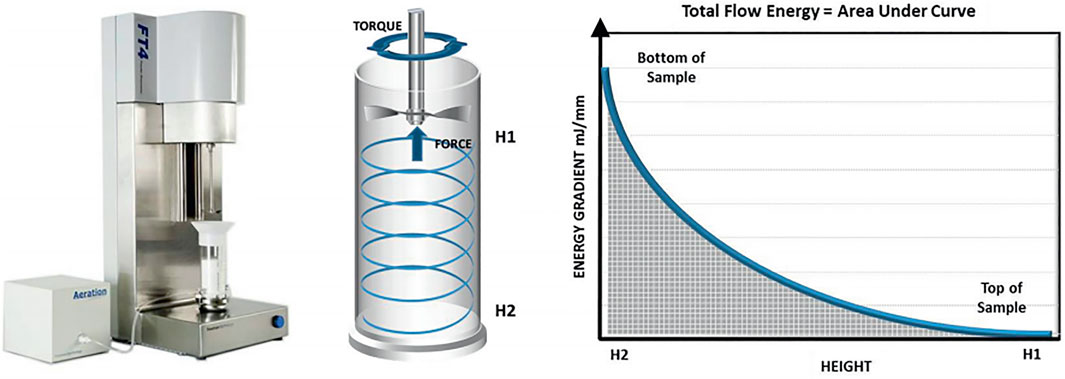
FIGURE 3. Stability and variable flow rate test setup. The graph on the right depicts the calculation of the total energy of a test cycle. Adapted with permission from Freeman et al. (2015).
The total energy (TE) of the seventh test is defined as the basic flowability energy (BFE).
The stability of the sample was evaluated by calculating the stability index (SI). SI (Eq. 4) is used as an indicator for the change in flow energy during repeated testing:
The sensitivity of flow energy to blade rotation speed was evaluated by calculating the Flow rate Index (FRI) (Eq. 5):
2.3.4 Wall Friction Test
The wall friction test measures the amount of wall shear stress between the bulk solid and the wall material of the storage or processing equipment given a series of wall normal stresses. In this test, the sample was first conditioned once using the 48 mm diameter blade, and then consolidated to 9 kPa normal stress using the 48 mm diameter vented piston. Next, the wall friction disk assembly was attached to the instrument. The wall friction disk assembly consists of a rod, a 48 mm diameter disk, and a screw that holds the rod and the disk together. The assembly was lowered to get in contact with the top surface of the sample until the normal stress reaches 9 kPa. Then the disk started rotating at an angular velocity of 18°/min, creating a shear stress on the surface of the powder bed. The sample underwent one pre-shear step where the normal stress used for the pre-shear cycle was kept at 9 kPa, followed by five successive shear steps where the normal stress used started out at 7 kPa and went down to 6, 5, 4, and 3 kPa. The measured wall shear stress vs. the wall normal stress was called the wall yield locus. The wall yield locus was fitted using linear regression with a coefficient of determinization (R2) greater than 0.99, and the wall friction angle (Eq. 6) was calculated as the inverse tangent of the slope of the best-fit line:
where ϕw denotes wall friction angle, τw and σw are the wall shear and normal stresses, respectively.
Three wall friction disks were used in this study:
(1) Stainless-steel disk (manufacturer supplied); average roughness factor (Ra) 1.2 µm
(2) In-house manufactured polytetrafluoroethylene (PTFE) disk; average Ra 0.480 µm
(3) In-house manufactured high-density polyethylene (HDPE) disk; average Ra 0.094 µm
The stainless-steel disks were cut out from a large sheet with the grain being lateral across the face of the disk. The Ra value represents the average surface roughness of the entire sheet. The Ra of the PTFE and HDPE disks were measured using a Bruker Contour GT optical profilometer, as can be seen in Supplementary Figures S3, S4. The Ra of the PTFE disk is 0.48 µm in the X direction and 0.48 µm in the Y-direction. The Ra of the HDPE disk is 0.094 µm in the X direction and 0.107 µm in the Y-direction. At the pre-shear step, it was found that each wall material required a different amount of time for the shear stress to reach equilibrium. Therefore, different disks were made to rotate over different angles at the same angular velocity. The stainless-steel disk was made to rotate for 60°, while the PTFE and HDPE disks were made to rotate for 240° and 180°, respectively.
In the wetting-drying study, to preserve any structure within the wetted-and-dried A samples
2.4 BET Surface Area
Multipoint BET specific surface area (SSA) was collected using a Micromeritics 3Flex instrument. All BET analyses data were obtained using nitrogen as the adsorbate gas. The secondary drying step and outgassing consisted of samples with masses ranging from 1.3 to 1.6 g; these were further conditioned with low pressure at 45°C until isobaric conditions were reached (≤1 × 10⁻⁵ mmHg). This step was crucial in obtaining reproducible and reliable results. The typical masses lost during this final drying step for all samples was less than 0.5 mg. BET range was determined from a linear fit of the BET plot. The linear fit was selected using seven increasing points (1-p/p°) up to the maximum on the Rouquerol transform plot. All experiments performed produced positive BET “C” constants.
2.5 Surface Energy via Inverse Gas Chromatograph
The impact of wetting and drying on at the microscale was investigated by tracking surface chemistry changes with surface energy measurements. These measurements were performed via Inverse Gas Chromatography (IGC) using a Surface Energy Analyzer (SEA) from Surface Measurement Systems (SMS). After surface area data collection, samples
3 Results and Discussion
3.1 Effect of Moisture and Feedstock Variability on Corn Stover Flow Behavior
3.1.1 Shear Testing
The shear properties of dry and wet samples A and B obtained by performing Mohr’s stress circle analysis on the yield locus are presented in Figure 4. As depicted in Figure 4A, the flowability factors (ffc) of both A and B sharply decrease with the increase in moisture from 0% to 25%, and then slowly decrease with the increase in moisture to 50%. The ffc of the samples with 50% and 75% moisture contents are very similar. Both
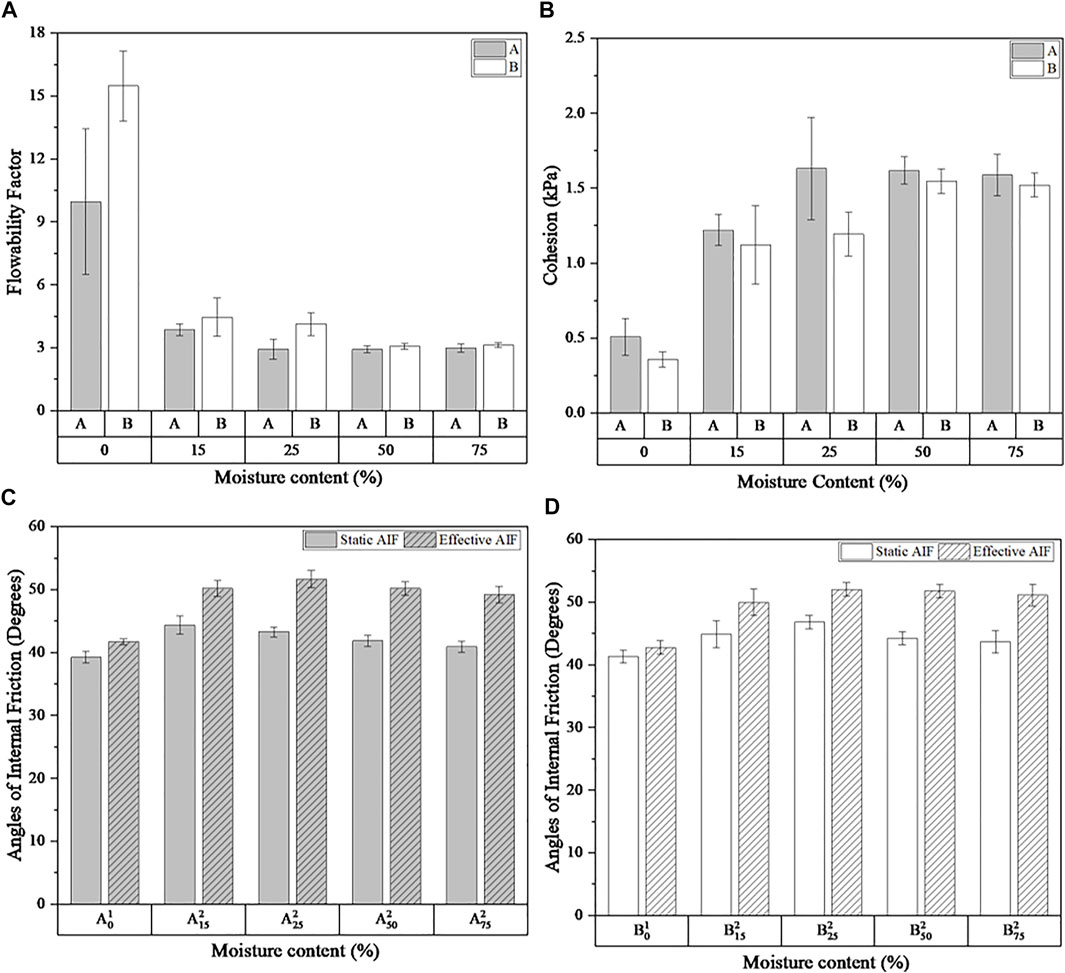
FIGURE 4. Shear test results for A and B. (A) Flowability factor for A and B at 0, 15, 25, 50, and 75% moisture contents. (B) Cohesion for A and B at 0, 15, 25, 50, and 75% moisture contents. (C) Static and effective angles of internal friction of A with 0, 15, 25, 50, and 75% moisture contents. (D) Static and effective angles of internal friction of B with 0, 15, 25, 50, and 75% moisture contents. Data points were obtained from steps
3.1.2 Compressibility and Bulk Density
As shown in Figures 5A,B, the compressibility of both A and B increase monotonically with the moisture content at each applied normal stress level. At lower moistures (0%–15%), the liquid bridges loosen the packing of the particles, therefore increasing the amount of void space between the particles thus increasing the compressibility. As shown in Figures 5C,D, there is a slight decrease in bulk density from 0% to 15% moisture. At higher moistures (25%, 50%, and 75%), larger agglomerates form and the packing becomes even looser. The bulk density, however, reaches a minimum at 25% moisture and starts to increase rapidly at higher moistures (Figures 5C,D). This sharp increase is expected due to the density of water being much higher than the bulk density of the dry corn stover.
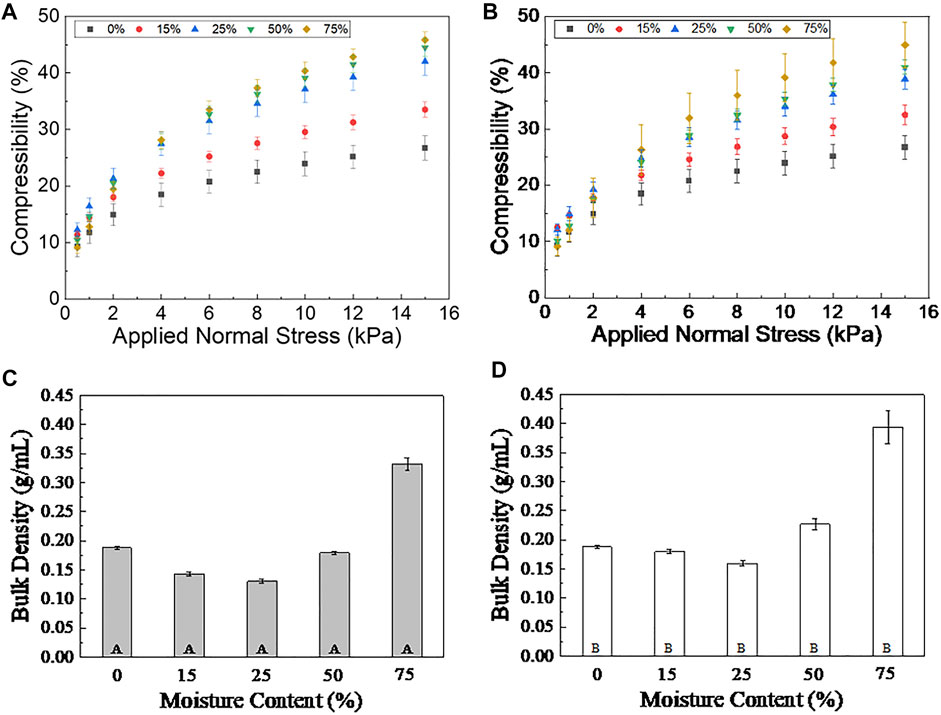
FIGURE 5. (A) The % compressibility as a function of applied normal stress for (A) A samples and (B) B samples, and the bulk density for (C) A samples and (D) B samples with 0, 15, 25, 50, and 75% moisture contents. Data points were obtained from steps
3.1.3 Stability and Variable Flow Rate Test
The full total energy profile of the dry and wet A and B samples, obtained by the stability and variable flow rate test, is depicted in Figure 6. By comparing Figures 6A,B, one can see the total energy of dry sample B is higher than that of the dry sample A. Taken together with the bulk density data in Figures 5C,D, the higher total energy of dry sample B can be attributed by the greater number of particles impinging upon the blade. To better observe the effect of repeated testing and blade speed on the total energy, the stability index (SI) and flow rate index (FRI) were calculated, with the results given in Supplementary Figure S6. Due to the inhomogeneous and polydisperse nature of the samples, large relative standard deviations (>10%) in both SI and FRI were observed. The SI for samples A and B with 0% through 50% moisture contents are similar and close to 1, suggesting that the flow energy measured at each testing cycle was relatively stable. The SI values for the 75% moisture samples are smaller than that of the other samples. The smaller SI is most likely due to the deagglomeration of the large clusters within the highly wet sample as it was being made to flow. The FRI for all the dry and wet samples A and B were similar and close to 0.8, which suggests that all the samples are sensitive to the blade speed and exhibits a pseudoplastic behavior.
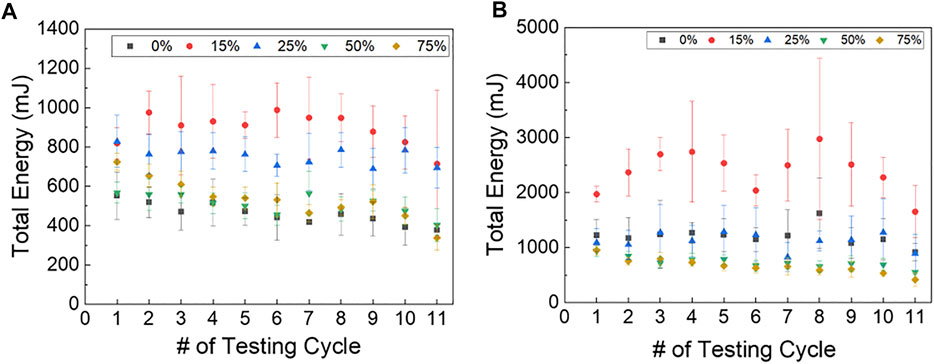
FIGURE 6. The total energy of the 11 test cycles for (A) A samples and (B) B samples, with 0, 15, 25, 50, and 75% moisture contents. Data points were obtained from steps
The BFE values for A and B with different moisture contents (Supplementary Figure S7) were examined. Interestingly, the BFE values of A samples increase as the moisture content rises from 0 to 15% and goes through a maximum at 15% moisture (Supplementary Figure S7A). As the moisture further increase, the BFE starts to decrease. However, the BFE at 75% moisture is still slightly higher compared to the BFE of the dry sample. This non-monotonic trend, when taken together with the previously observed trends in cohesion and compressibility, can be attributed to the formation of liquid bridges between the particles. On one hand, liquid bridges increase the cohesive forces between the particles, therefore leading to greater resistance to the blade and causing increased flow energy. On the other hand, the liquid bridges can result in looser packing in the bulk structure which decreases the resistance to the blade by decreasing the interaction between the blade and the more loosely packed particles. When the moisture content is less than or equal to 15%, the effect of the cohesive forces dominates, so that the BFE increases with the moisture content and reaches a maximum at 15%. However, as moisture further increases to 25% and the packing of the powder becomes looser due to the formation of more and larger liquid bridges, the effect of the looser packing becomes dominant, so that the BFE starts to decrease. As moisture increases to 50%, the cohesion stops increasing (Figure 4B) while the compressibility continues to increase as the packing becomes even looser. The BFE continues to decrease but the BFE at 75% moisture is still higher than that of the dry sample. At this point, it is unclear whether water has completely saturated some of the particles and formed liquid films around them. However, since the BFE at 75% is still higher than that of the dry sample, the flow-resisting effect of liquid bridges outweighs the flow-enhancing effect that the liquid films have. For the B samples, the BFE still peaks at 15% moisture and decreases as the moisture further increases (Supplementary Figure S5B). However, different from Sample A, the BFE of sample B at 75% moisture content is lower than that of the dry sample B.
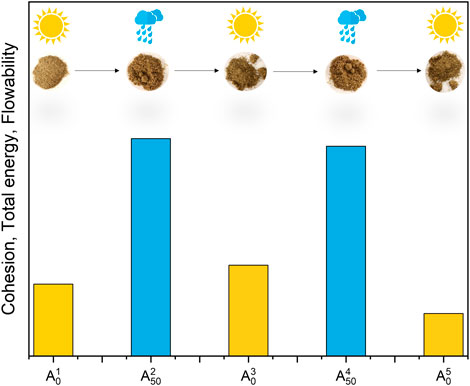
The role of water on the flow behavior on non-biomass powders, such as coal, has been more thoroughly studied. For example, Lu et al. (Lu et al., 2018) studied the effect of moisture on the flowability of pulverized coal. A shear test and a stability and variable flow rate test were conducted using an FT4 powder rheometer. As expected, the ffc kept decreasing with moisture in the 1.6 to 29 wt% moisture range. The cohesion first increased at a slow rate and then started increasing more rapidly when the moisture went above 15 wt%. Surprisingly, the BFE of coal first decreased as moisture increased from 1.6 to 15 wt%, and then increased as moisture further increased to 29 wt%. The authors then predicted the interparticle forces using a microscale approach with the Rumpf equation combined with the shear testing data as well as using a theoretical approach by combining the Kelvin equation and the Laplace–Young equation. Based on the cohesion and BFE data, and visual observations of the wet coal samples, the authors categorized their samples into four different regimes—the dry regime, the dispersed moisture regime, the consolidated moisture regime and the slurry regime (Figure 7). In the dry regime, there is little to no water between the coal particles and the bulk appears powdery. As the moisture content increased, the powder entered the dispersed moisture regime where coal particles started to agglomerate as water starts to form liquid bridges between the particles and driving up the interparticle capillary forces. As the moisture content keeps increasing, small liquid bridges merge and form large ones which leads to faster increase in the capillary forces, hence the consolidated moisture regime. Adding moisture beyond the consolidated moisture regime resulted in the slurry regime—defined as the point where all particles are completely surrounded by water.
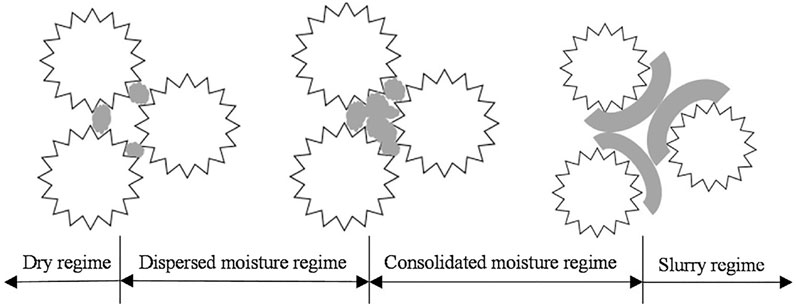
FIGURE 7. Schematic of contacting particles with increasing moisture content. The white shapes with coarse edges represent particles and the gray dots and lines represent water droplets. Adapted with permission from Lu et al. (2018).
Pictures of the dry
3.1.4 Wall Friction
Three commonly used materials for constructing powder handling and storage units are chosen for the wall friction test. Among them, stainless steel represents a hydrophilic surface while PTFE and HDPE both represent hydrophobic surfaces.
The wall friction angles of A and B samples as a function of moisture content on all three surfaces is given in Figure 8. The dry sample B has a slightly higher ϕw than the dry sample A. The ϕw for both A and B on the stainless-steel surface first increases when the moisture content increases from 0% to 50%. This can be attributed to the increasing number of liquid bridges between the particles which increases the adhesive forces between the stainless steel surface and the sample. ϕw stops increasing as the moisture reaches 50% and above, indicating that liquid bridges have taken up all the available spaces between the particles.
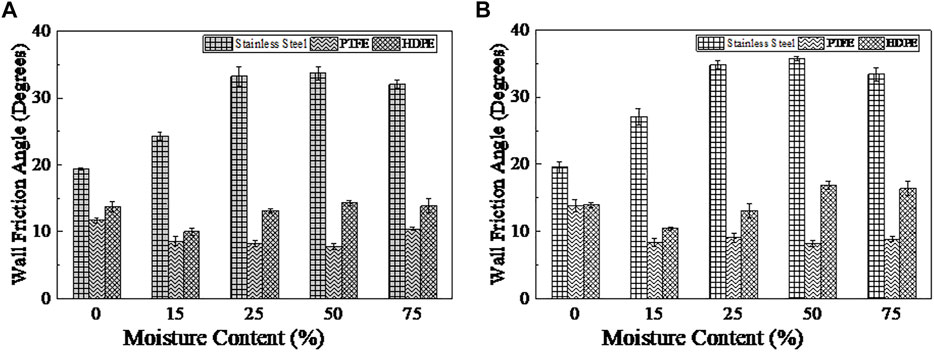
FIGURE 8. The wall friction angles of the (A) A and (B) B samples, with 0, 15, 25, 50, and 75% moisture contents on stainless steel, PTFE and HDPE surfaces. The Ra value of the stainless-steel surface is 1.2 µm. The Ra of the PTFE disk is 0.48 µm in the X direction and 0.48 µm in the Y-direction. The Ra of the HDPE disk is 0.094 µm in the X direction and 0.107 µm in the Y-direction.
The ϕw values of A and B on both PTFE and HDPE surfaces first decreased when the moisture content increases (0%–50% for PTFE and 0%–25% for HDPE). This trend aligned with the change in wall friction angle on the HMWPE surface with moisture for poplar and corn stover observed by Gil et al.8 In another study conducted by Schulze (Schulze, 2008), it was found that the wall friction angle of flue gas desulfurization (FGD) gypsum powders on a mild steel surface increased with moisture content, but the wall friction angle of the same powder on the ultra-high molecular weight polyethylene (UHWM-PE) surface decreased with moisture content. According to Schulze (Schulze, 2008), on poorly wetted, hydrophobic materials such as PTFE, no liquid bridges can form. Instead, liquid films form between the PTFE and the particles, creating lubrication which lowers the ϕw of the particles. Nevertheless, the wall friction angles go through a minimum at intermediate moisture levels (50% for PTFE and 25% for HDPE), and then starts to increase at higher moisture levels (75% for PTFE and 50% for HDPE). This increase is likely due to the presence of free water in the sample holder which makes the powder to slightly float, enabling a greater amount of powders to be in contact with the hydrophobic disks and exerting greater resistance on them.
In general, a ϕw equal to or greater than 30° signifies a high potential for material binding to vessel walls during discharge (Crawford et al., 2016). The wall friction data given in Figure 8 suggested that vessels constructed with stainless steel walls of Ra = 1.2 µm will pose greater challenges when processing corn stover compared to with PTFE and HDPE walls.
3.2 Re-Drying the Wet Sample
To further elucidate the effect of moisture addition to the dried corn stover sample,
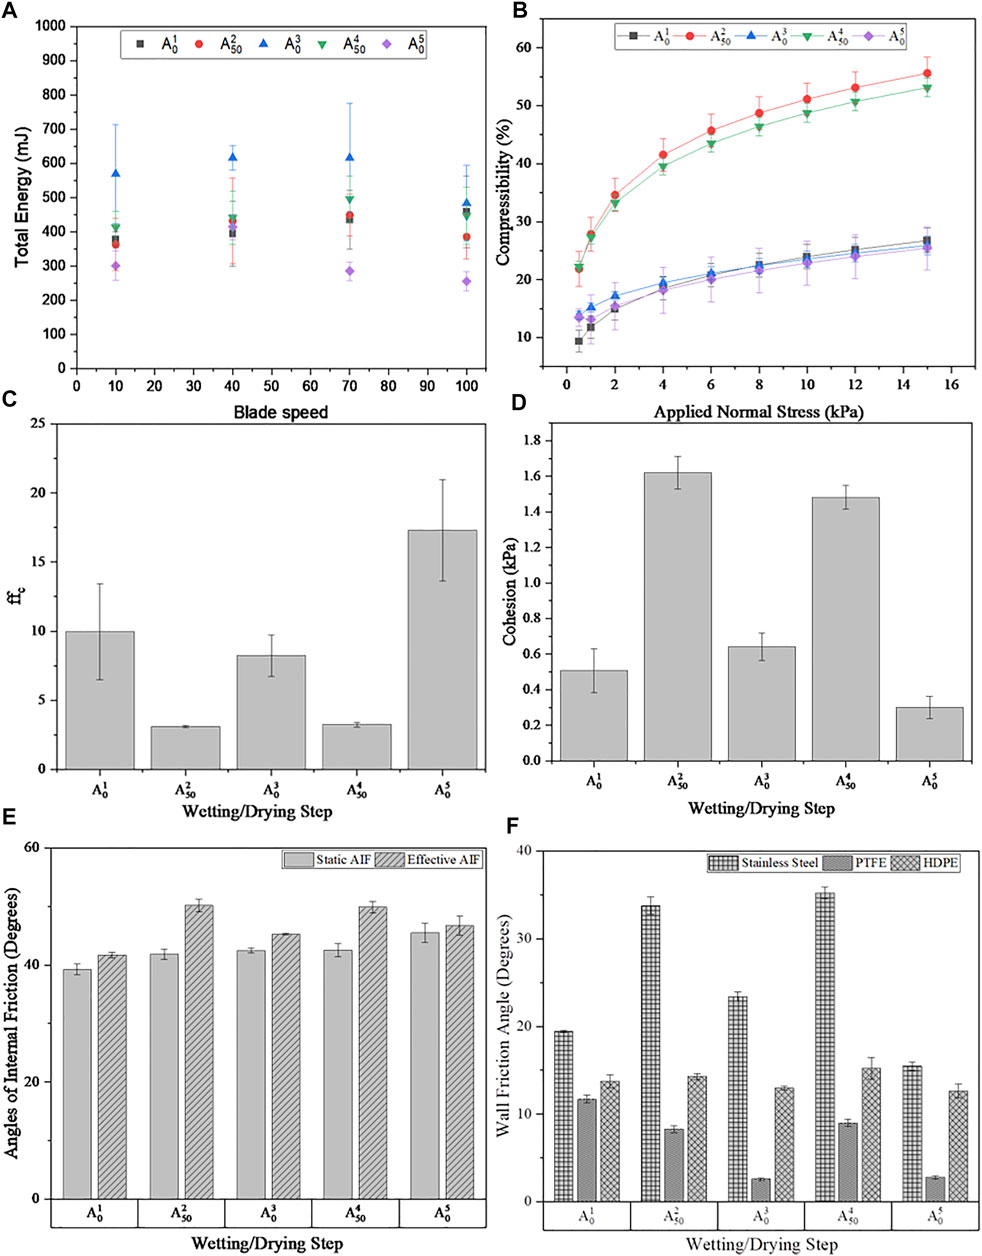
FIGURE 9. The (A) total energy, (B) compressibility, (C) flowability factor, (D) cohesion, (E) static and effective angles of internal friction and (F) wall friction angles as a function of repeated wetting/drying of sample A.
As illustrated in Figure 9A,
3.3 Surface Area, Brunauer–Emmett–Teller Approach
Sample mass and surface area values are required input during method development for IGC experiments—the targeted surface coverage relies on an accurate estimate of surface area in the column. The resulting surface areas for samples
3.4 Surface Energy via Inverse Gas Chromatography
In certain situations, the forces governing particle-particle interactions at the microscale can often be significant enough to influence bulk solid flow through cohesive mechanisms such as caking, ratholing, or adhesive methods such as gumming up equipment. The effect of wetting and drying on surface energy with sample A was investigated. Figure 10 illustrates the percent changes of surface energy in sample A relative to the native sample,
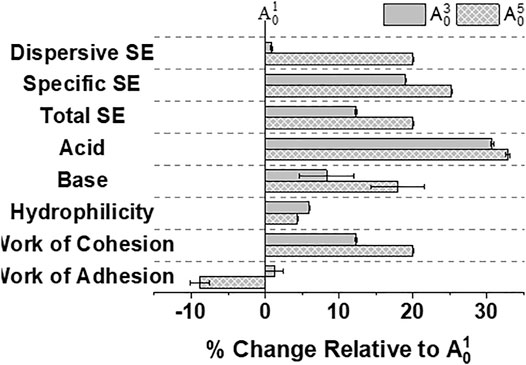
FIGURE 10. Percentage changes in surface energy as a function of wetting and drying cycles for Sample A. Note: all quantified changes are relative to the initial corn stover sample.
The process of wetting and drying may have facilitated the removal of water-soluble extracts or surface contaminants as well as migration of bulk (internal) moieties towards the surface (external) through a leaching process, thus exposing a new surface. These modified surfaces appeared as a result of continued cycling which exhibited a decreased adhesion to liquid water. The data suggested that internal moieties favorable towards the adhesion of water migrate towards the surface in the first cycle and remain on the corn stover surface throughout the drying
The approximate surface energies of the wall materials under study can be found throughout the literature. Although the values may differ slightly from article to article, the general trend for total surface energy follows that stainless steel > HDPE > PTFE. In addition, the chemical nature of stainless steel surface has a profound effect as well, i.e., oxidized or reduced. The low specific surface energy of PTFE is responsible for the degree of hydrophobicity and decreased interactions with hydrophilic surfaces, i.e. water and corn stover.
4 Conclusion
The flow energy, compressibility, shear properties and wall friction angles were measured for corn stover samples from two different bales—A and B, with 0% (dry), 15%, 25%, 50% and 75% moisture contents. All the wet samples showed greater basic flowability energy, compressibility, cohesion, unconfined yield strength, angles of internal friction and lower flowability factor (ffc) than the dried samples. Of all the dry and wet A and B samples, the A and B samples with 15% moisture had the highest basic flowability energy. The A and B samples with 75% moisture was the most compressible and had the smallest ffc. Among all the wall materials tested, the wall friction angle on the stainless-steel surface were in general greater than those on the PTFE and HDPE surfaces. Although samples A and B showed slight variations in their rheological properties, these values do not significantly differ to hinder the overall processing of these samples; both samples were similarly affected by the different moisture content, where they both exhibited the same trends at different wt%. In general, the feedstock variability observed among two disparate samples, originating from two different bales typically lead to significant changes in critical material attributes such as (but not limited to) ash content, crystallinity, surface energy, composition, and surface area; however, our study showed that the rheological properties were not impacted by feedstock variability. Wetting and then drying the corn stover leads to lower flow energies, higher compressibility, higher unconfined yield strength, and higher angles of internal friction compared to the initial, dry sample, pointing to the looser packing and formation of new clusters during wetting. However, when repeating the process, some changes could be observed, particularly in the cohesion, ffc, and UYS. Rheological data indicated that the sample was more free-flowing when applying more wetting and subsequent drying steps, possibly modifying how the particles are interacting with one another, as evidenced by surface energy analysis carried out in the IGC. Such changes can be crucial when it comes to the handling of the feedstock along with potentially showing that undergoing wetting-drying steps can be considered as a pre-treatment to attain a better-flowing feed, aiding in the overall discharging and handling operation.
Data Availability Statement
The original contributions presented in the study are included in the article/Supplementary Material, further inquiries can be directed to the corresponding authors.
Author Contributions
DG assisted in revising the manuscript. FP assisted in data collection. RN assisted in data collection and revision. JL assisted in data collection and revision. OA assisted in profilometry. TS assisted in final revision.
Funding
This work was supported by the U.S. Department of Energy, Bioenergy Technologies (BETO) Office as part of the FCIC: Feedstock Conversion Interface Consortium (CPS Agreement Number: 33740).
Conflict of Interest
The authors declare that the research was conducted in the absence of any commercial or financial relationships that could be construed as a potential conflict of interest.
The handling editor AR declared a past collaboration with the author(s) TS.
Publisher’s Note
All claims expressed in this article are solely those of the authors and do not necessarily represent those of their affiliated organizations, or those of the publisher, the editors and the reviewers. Any product that may be evaluated in this article, or claim that may be made by its manufacturer, is not guaranteed or endorsed by the publisher.
Acknowledgments
The authors would like to thank Mr. Rajeev Dattani, Ms. Laura Monington, and Mr. Nicholas Monroe from Freeman Technology Ltd. As well as Dr. Greg Mehos from Greg Mehos & Associates LLC for their help and discussions on the experimental data. The authors would also like to thank Dr. Michael Heidlage for offering suggestions on improving the manuscript.
Supplementary Material
The Supplementary Material for this article can be found online at: https://www.frontiersin.org/articles/10.3389/fenrg.2022.868050/full#supplementary-material
References
Afzalinia, S., and Roberge, M. (2007). Physical and Mechanical Properties of Selected Forage Materials. Canadian Biosystems Engineering 49.
Crawford, N. C., Nagle, N., Sievers, D. A., and Stickel, J. J. (2016). The Effects of Physical and Chemical Preprocessing on the Flowability of Corn Stover. Biomass Bioenergy 85, 126–134. doi:10.1016/j.biombioe.2015.12.015
Freeman, T., Brockbank, K., and Armstrong, B. (2015). Measurement and Quantification of Caking in Powders. Procedia Eng. 102, 35–44. doi:10.1016/j.proeng.2015.01.104
Gil, M., Schott, D., Arauzo, I., and Teruel, E. (2013). Handling Behavior of Two Milled Biomass: SRF Poplar and Corn Stover. Fuel Process. Technol. 112, 76–85. doi:10.1016/j.fuproc.2013.02.024
Hargreaves, K. K., Zielińska, M., and Cenkowski, S. (2013). “Flowability of Distiller’s Spent Grains Processed with Air and Superheated Steam Drying,” in 2010 North Central ASABE/CSBE Conference. doi:10.13031/2013.36289
Ileleji, K. E., and Zhou, B. (2008). The Angle of Repose of Bulk Corn Stover Particles. Powder Technol. 187 (2), 110–118. doi:10.1016/j.powtec.2008.01.029
Jensen, P. D., Mattsson, J. E., Kofman, P. D., and Klausner, A. (2004). Tendency of Wood Fuels from Whole Trees, Logging Residues and Roundwood to Bridge over Openings. Biomass Bioenergy 26 (2), 107–113. doi:10.1016/S0961-9534(03)00101-6
Leal, J. H., Moore, C. M., Sutton, A. D., and Semelsberger, T. A. (2019). Surface Energy of Air Fractionated Corn Stover. Industrial Crops Prod. 137, 628–635. doi:10.1016/j.indcrop.2019.05.046
Littlefield, B., Fasina, O. O., Shaw, J., Adhikari, S., and Via, B. (2011). Physical and Flow Properties of Pecan Shells-Particle Size and Moisture Effects. Powder Technol. 212 (1), 173–180. doi:10.1016/j.powtec.2011.05.011
Lu, H., Guo, X., Jin, Y., and Gong, X. (2018). Effect of Moisture on Flowability of Pulverized Coal. Chem. Eng. Res. Des. 133, 326–334. doi:10.1016/j.cherd.2018.03.023
Mattsson, J. E., and Kofman, P. D. (2003). Influence of Particle Size and Moisture Content on Tendency to Bridge in Biofuels Made from Willow Shoots. Biomass Bioenergy 24 (6), 429–435. doi:10.1016/S0961-9534(02)00178-2
Ng, D. K. S., Ng, K. S., and Ng, R. T. L. (2017). “Integrated Biorefineries,” in Encyclopedia of Sustainable Technologies, 299–314. doi:10.1016/B978-0-12-409548-9.10138-1
Ray, A. E., Williams, C. L., Hoover, A. N., Li, C., Sale, K. L., Emerson, R. M., et al. (2020). Multiscale Characterization of Lignocellulosic Biomass Variability and its Implications to Preprocessing and Conversion: A Case Study for Corn Stover. ACS Sustain. Chem. Eng. 8 (8), 3218–3230. doi:10.1021/acssuschemeng.9b06763
Rennie, P. R., Chen, X. D., Hargreaves, C., and MacKereth, A. R. (1999). Study of the Cohesion of Dairy Powders. J. Food Eng. 39 (3), 277–284. doi:10.1016/S0260-8774(98)00158-7
Schulze, D. (2008). Powders and Bulk Solids: Behaviour, Characterization, Storage and Flow, 22. Springer.
Stasiak, M., Molenda, M., Bańda, M., Wiącek, J., Parafiniuk, P., Lisowski, A., et al. (2019). Mechanical Characteristics of Pine Biomass of Different Sizes and Shapes. Eur. J. Wood Prod. 77 (4), 593–608. doi:10.1007/s00107-019-01415-w
Teunou, E., and Fitzpatrick, J. J. (1999). Effect of Relative Humidity and Temperature on Food Powder Flowability. J. Food Eng. 42 (2), 109–116. doi:10.1016/S0260-8774(99)00087-4
Keywords: corn stover, moisture, wettability, feedstock variability, powder rheology, FT4, surface energy, cohesion
Citation: Cheng Z, Gao DW, Powers FM, Navar R, Leal JH, Ajayi OO and Semelsberger TA (2022) Effect of Moisture and Feedstock Variability on the Rheological Behavior of Corn Stover Particles. Front. Energy Res. 10:868050. doi: 10.3389/fenrg.2022.868050
Received: 02 February 2022; Accepted: 28 April 2022;
Published: 27 June 2022.
Edited by:
Allison E. Ray, Idaho National Laboratory (DOE), United StatesReviewed by:
Naveen Mani Tripathi, Rajiv Gandhi Institute of Petroleum Technology, IndiaMinliang Yang, Berkeley Lab (DOE), United States
Copyright © 2022 Cheng, Gao, Powers, Navar, Leal, Ajayi and Semelsberger. This is an open-access article distributed under the terms of the Creative Commons Attribution License (CC BY). The use, distribution or reproduction in other forums is permitted, provided the original author(s) and the copyright owner(s) are credited and that the original publication in this journal is cited, in accordance with accepted academic practice. No use, distribution or reproduction is permitted which does not comply with these terms.
*Correspondence: Ziwei Cheng, bHpjaGVuZ0B1ZGVsLmVkdQ==; Troy A. Semelsberger, dHJveUBsYW5sLmdvdg==