 Yong Sun1,2
 Yutong Huang
95% of researchers rate our articles as excellent or good
Learn more about the work of our research integrity team to safeguard the quality of each article we publish.
Find out more
ORIGINAL RESEARCH article
Front. Energy Res. , 26 April 2022
Sec. Wind Energy
Volume 10 - 2022 | https://doi.org/10.3389/fenrg.2022.867719
This article is part of the Research Topic Advanced Data-driven Methods for Monitoring Solar and Wind Energy Systems View all 5 articles
As errors in point forecasts of wind power are unavoidable, interval forecasts can adequately describe the uncertainty in wind power and thus provide further guidance to dispatchers in their decision making. Current interval prediction methods are still incomplete in terms of tapping into the physical variability of wind power, especially for the specific time scale of the ultra-short term. This paper therefore proposes a new framework for interval forecasting of ultra-short-term wind power that incorporates the power fluctuation process. Firstly, a fluctuating process of wind power series is defined and a Kalman-SOM method for clustering the fluctuating processes of wind power is constructed. Secondly, a quantile regression forest interval prediction model is constructed for multiple fluctuation processes for ultra-short-term time scales. Finally, the effectiveness of the overall framework is validated at a wind farm in Jilin Province, China. Compared with the traditional interval prediction method. The interval bandwidth is reduced by 0.86% on average, and the interval coverage is increased by 1.4% on average. The results demonstrate the effectiveness and feasibility of the method in this paper.
The development of new energy sources is particularly important due to current fossil fuel resource constraints (Zhang et al., 2021). The current scale of grid-connected wind power is gradually increasing, imposing a large number of disorderly shocks on the grid during the operation of the power system, and high-precision wind power forecasting has become a necessary operational technique for a high proportion of new energy sources to be connected to the power system (Xue and Yu, 2015). The current point prediction is the most widely used form of prediction when doing wind power prediction, but the point prediction form of wind power cannot completely reflect the uncertainty of wind power. Due to the random nature of the wind power series, errors in point forecasting are inevitable. Wind power interval prediction constructs prediction intervals that quantify the prediction uncertainty, which is a representation of the uncertainty of wind power in the time series, and thus provides further guidance to the dispatching department for decision making, improving wind power consumption and grid decision making (Alexandre et al., 2008; Wan and Cui, 2021).
Traditionally, research on wind power has focused on improving the accuracy of point prediction (Wu and Qiao, 2017; Ma et al., 2019), but due to the random, intermittent and fluctuating nature of wind power, its uncertainty has diverse characteristics, and interval prediction can adequately describe the uncertainty of wind power. Research on interval prediction methods for wind power has achieved some results, mainly including physical methods (Bludszuweit et al., 2008), parametric methods (Bruninx and Delarue, 2014; Yuan et al., 2019), non-parametric methods (He and Zhang, 2020; Gu et al., 2021), artificial intelligence methods (Wan et al., 2013; Qi et al., 2020), etc. Physical methods require high accuracy for numerical weather forecast information, and their modelling process is more complicated due to the need for a large amount of historical data for calculation. Parametric methods for fitting the error distribution of wind power mainly include Gaussian distribution, Beta distribution, generalised error distribution (Ye and Ren, 2016), etc. The modelling process of parametric methods is relatively simple, but the accuracy rate is low. Non-parametric methods such as kernel density estimation (KDE) and Monte Carlo (Yang and Dong, 2021) are too dependent on sample data and their estimated intervals are too conservative. The use of intelligent algorithms such as extreme learning machines and BP neural networks also has the problem of large data requirements.
In order to further describe the uncertainty of wind power, a single error analysis method cannot accurately portray the uncertainty of wind power, and interval prediction is improved by the division of prediction error scenarios into intervals, e.g., In Ref. (Ye and Ren, 2016), used the magnitude and fluctuation characteristics of the error to do the stratification of the error; In Refs (Pinson and Kariniotakis, 2010; Xue et al., 2020; Yang and Dong, 2021). divided the error scenarios according to Numerical Weather Prediction (NWP) wind speed class and wind power output level; In Refs. (Jyotirmayee et al., 2019; Zhao et al., 2020), divided the error scenarios and interval prediction by season or month, respectively; In Ref. (Qiao et al., 2021), considered the time-series-conditional nature of the errors, thus enhancing the interval prediction effect. None of these error scenario partitioning methods can provide an accurate portrayal of the fluctuating nature of wind power. The current research on the fluctuating nature of wind power focuses on wind power point prediction, and studies such as Ref. (Wang and Wang, 2013), give a fractal scheme for different fluctuation types through the analysis of wind power fluctuation characteristics, and put forward a new idea of ultra-short-term prediction based on the mining of low-frequency class fluctuation processes and dynamic fusion. In Refs. (Lin and Wen, 2012; Yang and Qi, 2015; Yang et al., 2021), by fitting the fluctuation changes of wind power It is also pointed out that the prediction accuracy of wind power is not only related to the mathematical model used, but also related to the fluctuation characteristics of wind power itself. In Ref. (Yang and Zhang, 2020), the SEI index proposed can more accurately describe the uncertainty characteristics of wind power fluctuation, thus making a stronger correlation between the proposed index and the prediction error. All the above analyses of wind power fluctuation characteristics are applied to wind power point prediction, which improves the accuracy of point prediction, but does not provide an adequate description of the uncertainty of wind power.
In summary, many scholars have done a lot of in-depth research on interval prediction, but most of the prediction models built only use a single statistical or physical method, resulting in the prediction models built not being able to fully reflect the impact of the fluctuating characteristics of wind power historical data on the power at the time to be predicted. The current error scenario classification method also cannot fully reflect the impact of the fluctuating characteristics of wind power on the uncertainty of wind power. In Ref. (NICOLAI, 2006). A Quantile Regression Forest (QRF) combined with QR was proposed. As a non-parametric integrated machine learning method, QRF has the advantages of fast computing speed, low model performance influenced by parameters, and high noise tolerance. Therefore, this paper combines the fluctuating characteristics of wind power and the advantages of QRF, and we propose an interval forecasting framework that considers the clustering division of fluctuating processes and QRF for the ultra-short-term time scale of wind power forecasting. The main contributions of this paper are as follows:
1) The Kalman filter is used to remove the randomness of the original sequence and to analyse the components at the lower frequencies that reflect the trend of the wind power sequence.
2) A clustering division of power fluctuation process and Self-organizingmap (SOM) is proposed. The fluctuation process of wind power is divided into several types, and the construction of error scene based on physical process and data-driven fusion is realized.
3) In this study, an interval predictive quantile regression forest model is built for ultra-short-term time scale and considering the clustering division of wave process.
4) Using 6 months of data from a wind farm in Jilin, China, the proposed interval prediction framework was compared and analyzed against several parametric and non-parametric models at multiple time spans, with optimal performance at 80, 90, and 95% confidence intervals.
The paper is structured as follows: Section 3 describes how the clustering of the wind power fluctuation process was carried out and the proposed interval prediction model based on QRF. Section 4 describes in detail the comparative analysis of the data analysis and the interval prediction results. Section 5 draws a final conclusion.
The new framework for interval prediction proposed in this paper obtains the final wind power interval results by clustering and dividing the fluctuation process of the wind power series and then using QRF. This is then compared and analysed by other interval prediction models. The framework is illustrated in Figure 1 and is described as follows:
1) The input of NWP data and historical wind power series data is used to obtain ultra-short-term point predictions for different steps and to calculate the distribution of their errors, which are used for subsequent interval predictions and comparisons.
2) Filtering the original sequence to remove the sequence uncertainty components. In turn, the fluctuation process of wind power is defined and relevant features are extracted. The fluctuating process is clustered and classified by SOM.
3) A QRF model was constructed for ultra-short-term forecasting under multiple volatility process types. The interval prediction results of different volatility process types are reorganized to obtain interval prediction results
4) The results of step 16, step 12, step 8 and step 4 are compared with those of parametric methods such as Gaussian distribution, t-distribution and non-parametric methods such as KDE, QR and Monte Carlo method at different confidence levels.
5) Framework of the novel wind power interval prediction hybrid
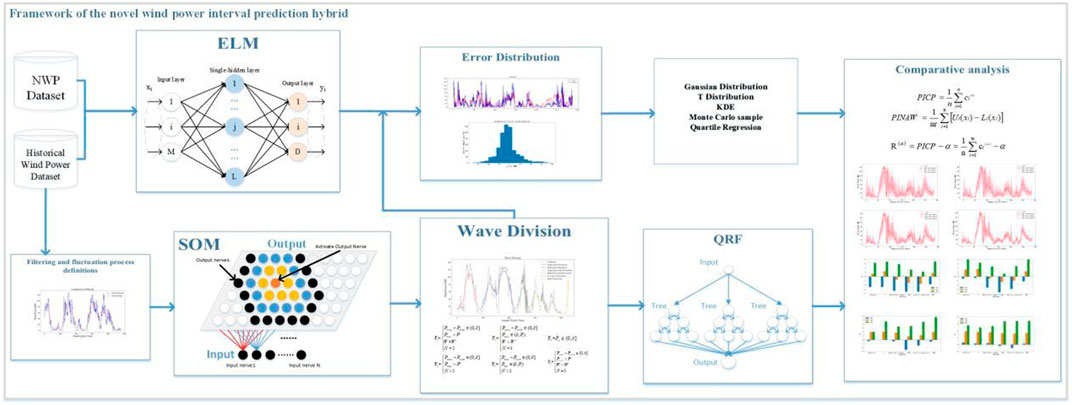
FIGURE 1. The framework of the proposed combined prediction.
High frequency disturbances in the time series of wind power disturb the wind power output, which is unpredictable (Liu et al., 2018; AasimSingh and Mohapatra, 2019). Therefore, the Kalman filter is used in this paper to perform the filtering process. As shown in Figure 2, the comparison of the wind power series before and after filtering is shown. The filtered series can reflect the main trend changes in power.
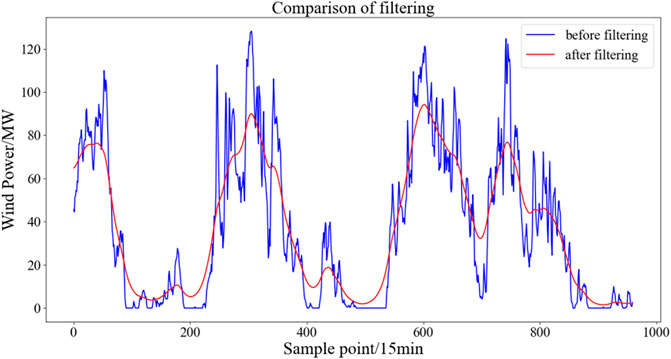
FIGURE 2. Comparison before and after filtering of wind power sequence.
A fluctuating process is defined as follows: In this paper, from the time scale of the extreme value parameter of the wind power series, a period of power series that grows from a local minimal value below the threshold (through the statistical characteristics of the local wind farm historical power data) to a local maximal value, and then decays from a local maximal value to a local minimal value below the threshold is a fluctuating process.
The purpose of the definition and classification of the fluctuation process is to organize the long-period irregular and wind power series into several minimum research units, so as to characterize and extract the fluctuation process by considering the time scale parameters, i.e., the extreme value to define the wave process and cluster it. The wind power is normalised, and the fluctuating process is clustered using the SOM, which is a competitive learning unsupervised neural network that maps similar sample points in a high-dimensional space to proximity neurons in the output layer of the network to obtain clustering results, as shown in the structure of the SOM neural network in Figure 3.
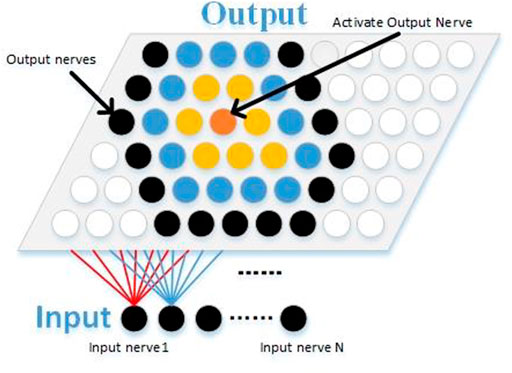
FIGURE 3. Structure of SOM neural network.
In this paper, the feature vector K of the fluctuation process will be used to input into the SOM neural network for the classification of the fluctuation process. The input features K are shown in (1)
where
(1) Single-peaked large fluctuations: The minimum value at both ends of the fluctuation. 143 process is below the threshold ∂, the maximum value is greater than P', the fluctuation time span is. 144 less than W' , and the number of peaks is equal to 1
(2) Multi-peaked large fluctuations: the minimal values at both ends of the fluctuating process are below the threshold ∂, the maximum values are greater than
(3) Single-peaked small fluctuations: the minimum value at both ends of the fluctuation process is below the threshold ∂, the maximum value is between ∂ and
(4) Multi-peaked small fluctuations: the minimal values at both ends of the fluctuating process are below the threshold ∂, the maximum values are between ∂ and
(5) Low output fluctuation: Any power value during fluctuation is less than the threshold value ∂
(6) Spike fluctuation: the minimum value of the fluctuation process is below the threshold ∂ at both ends, the maximum value is between ∂ and
where
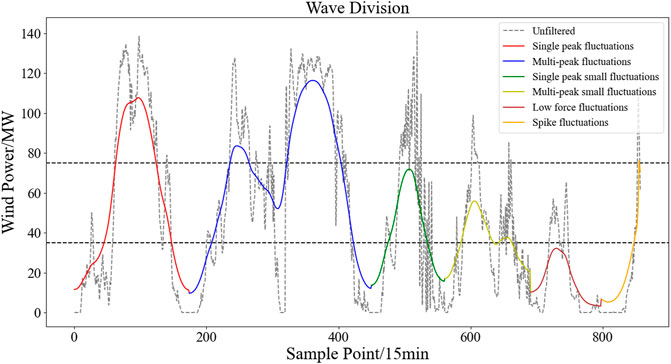
FIGURE 4. Schematic diagram of volatility division. (1) Single-peaked large fluctuations: The minimum value at both ends of the fluctuation process is below the threshold ∂, the maximum value is greater than
As mentioned above, this paper is based on a fluctuating process of data-driven adaptive segmentation, with obvious physical implications at the same time.
QRF is an improvement of the Random Forest algorithm that provides information on the full conditional distribution of the dependent variable by combining the properties of QR. QRF has a theoretical basis as a non-parametric machine learning method and has also been shown to be consistent (NICOLAI, 2006). In contrast to the random forest algorithm, which retains only the mean of the observations belonging to this node and ignores all other information, QRF retains the values of all observations in this node, not just their mean, and evaluates the conditional distribution based on this information, defining QRF in terms of the weighted mean of
The specific steps of the algorithm can be summarised as follows.
a) Generate n decision trees
b) For the given
The weights of each observation are obtained by averaging the decision tree weights
c) For all
For each node of each decision tree, in contrast to the regression of the random forest algorithm, which only retains the mean of its observations and ignores other information, QRF retains all observations in the node and on this basis calculates the conditional distribution to obtain the upper and lower bounds of the desired prediction interval.
A wind farm in Jilin, China was selected for investigation. The wind farm has a total installed capacity of 249.9 MW The data used in this study (i.e., the total power generated by the entire WF and the corresponding NWP data) were collected at intervals of 15 min between 00:00 on January 1 and 23:45 on 31 June 2019,a total of 17280 points. January to May is the training set and June is the test set. To improve the ultra-short-term power prediction accuracy, the NWP wind speed and historical power are used as inputs, and the point prediction results of 16 steps are obtained by ELM neural network, whose RMSE and prediction error distribution of the results of step 16, step 12, step 8 and step 4 are shown in Figure 5; Table 1. And the part of the training set is divided for the fluctuation process for the subsequent part of the interval prediction.
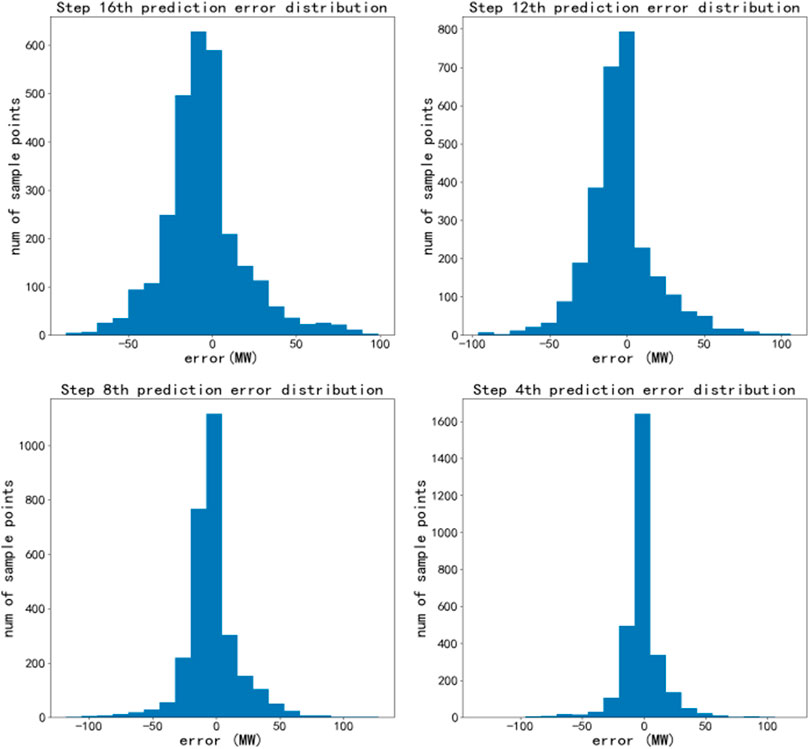
FIGURE 5. Point prediction error distribution.
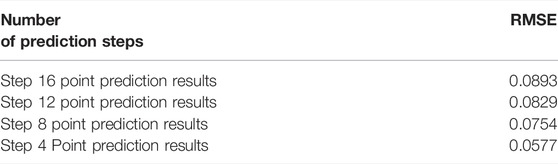
TABLE 1. Point prediction error index.
For the uncertainty of wind power prediction, suitable interval optimisation criteria need to be constructed for the system in order to obtain the optimal model parameters. The optimisation criterion for the prediction interval should be considered in terms of two aspects: reliability and clarity. Reliability is expressed in terms of the probability of the actual observations falling into the prediction interval, which should be as large as possible to make the prediction more accurate; clarity is measured in terms of the average width of the prediction interval, which should be as small as possible to make the prediction width as narrow as possible. However, these two are in conflict with each other and this paper constructs an optimisation criterion by using the following specific predictor interval evaluation metrics.
The PI coverage probability (PICP) indicator reflects the probability that the actual power falls within the predicted fluctuation interval and allows the reliability of the prediction model to be assessed.
where: n is the number of forecast samples; α is the given confidence level;
In practice, if the prediction result is much smaller than the given confidence level α, the prediction interval is invalid and should be reconstructed. the larger the PICP value is, the more target values fall into the prediction interval, the better the prediction effect.
The PI normalized average width (PINAW) indicator reflects the clarity of the forecast. To avoid the loss of decision value due to the simple pursuit of reliability, where the forecast interval is too wide and does not give valid information on the uncertainty of the forecast value.
where
Firstly, we compared the PICP, PINAW of the interval prediction results of 16 steps at each confidence level for the t-distribution, KDE and Gaussian distribution. QR, QRF methods divided by fluctuating process, as shown in Table 2, in which PICP of the QRF method divided by fluctuating process was higher than most other methods, and the Gaussian distribution divided by fluctuating process The PICP obtained by the QRF method is higher than that of most other methods, and the PICP obtained by the Gaussian distribution divided by the fluctuation process is higher than that of this paper, but its PINAW is too high, because the PICP and the PINAW need to be considered together. In the next section, we will compare and analyse the results from the perspective of multiple time scales and whether or not the error scenarios are divided.
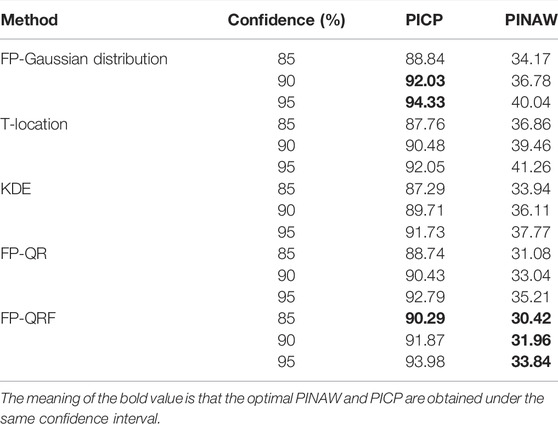
TABLE 2. Interval prediction indicators with different confidence levels for each method.
In order to further verify the validity of this paper, statistics of interval prediction results were conducted at multiple time scales. As shown in Figure 6, the interval prediction results for a 3-day period using QRF after fluctuation division can be seen that the interval prediction model based on QRF under fluctuation division can closely follow the trend of the fluctuation process of wind power series at different confidence levels at different time scales, and the better interval prediction results can provide more accurate forecast information for decision makers. Table 3 shows the interval prediction results of the methods divided by fluctuations under different confidence levels in the 16th and 12th stages. It can be seen that the interval prediction effect of the method used in this paper is better than that of most other methods under different confidence intervals, and the PICP is increased while reducing PINAW of the prediction interval compared with other non-parametric methods. In this paper, the average PINAW of the prediction interval is reduced by 2.17% and the average PICP is increased by 1.4%. It can be seen that under different prediction steps, the method used in this paper can get higher PICP under narrower PINAW at different confidence levels. Compared with most other methods, the interval prediction effect of this method is better. In step 12, step 8, step 4, the coverage of the parametric method is higher, but this is easy to explain because the bandwidth of the parametric method is wider.
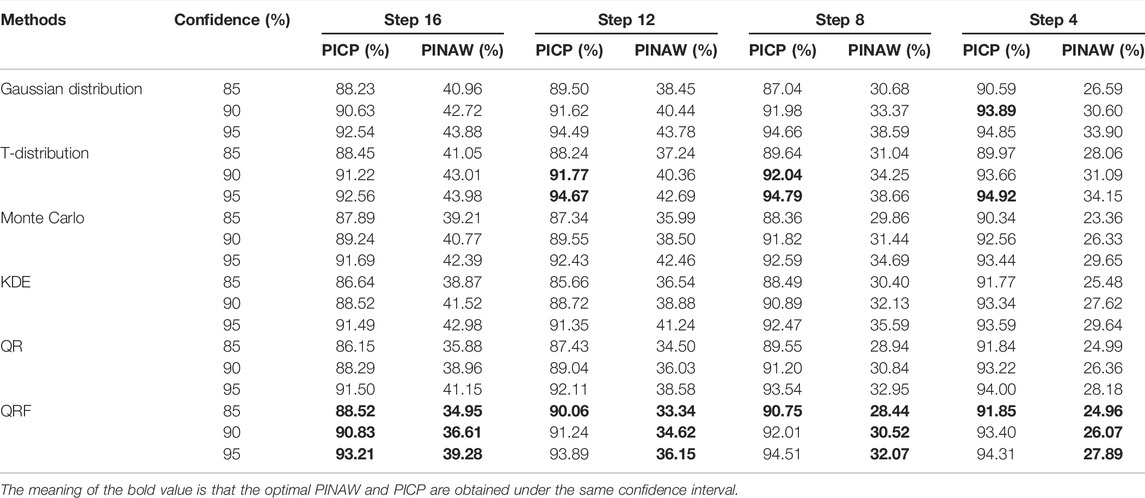
TABLE 3. The interval predictive index of different methods of unreasonable confidence interval.

FIGURE 6. Prediction interval of proposed model in different time scales. The labels (A–D) is the interval prediction effect diagram of the method proposed in 16th, 12th, 8th, 4th.
In order to further verify the effectiveness of the proposed method, the interval prediction effect with or without fluctuation division is analyzed by selecting four different methods of Gaussian distribution, KDE, QR and QRF for prediction and analysis at 90% confidence level, and Figure 7 shows the interval prediction effect with or without fluctuation division for a certain 3 days with 90%

FIGURE 7. A comparative analysis of whether the four methods have been divided by volatility (From left to right, Gaussian distribution, KDE,QR,QRF) the labels (A–D) is the interval prediction effect diagram of four methods.
confidence level for the four methods. Its interval prediction after dividing fluctuations makes its upper and lower limits can have a better prediction effect on the part of the violent fluctuation segment, and can follow the trend of the fluctuation process of wind power series better.
Table 4 shows the 90% confidence level interval prediction metrics calculated for the four methods without error scenario division, error scenario division for power output magnitude, and error scenario division for division of fluctuations. Compared to the interval prediction without considering the fluctuation process of the wind power sequence, it can be seen that the interval prediction of the four methods after the fluctuation division in step 16, step 12, step 8, and step 4, all of which reduce The average PINAW of the predicted intervals is reduced by 0.86% and the average PICP is increased by 1.43%.This indicates that interval forecasts that take into account the division of fluctuating processes have better interval forecasting results. Compared to the case where only the wind power output is considered, the interval prediction with the fluctuating process of wind power taken into account has a better prediction effect and a higher PICP with a smaller PINAW. At the same time, the method, i.e. the QRF considering fluctuating processes, has better interval prediction results than the other two non-parametric methods at different prediction steps, and is able to obtain interval coverage greater than the preset confidence level at different time scales, by comparing with the two non-parametric methods, the PICP is improved by 0.44–1.46% on average, and the PINAW is reduced by 0.63–2.33%. The PICP is higher for the parametric method due to the relatively higher PINAW of the intervals at step 12 versus step 4.
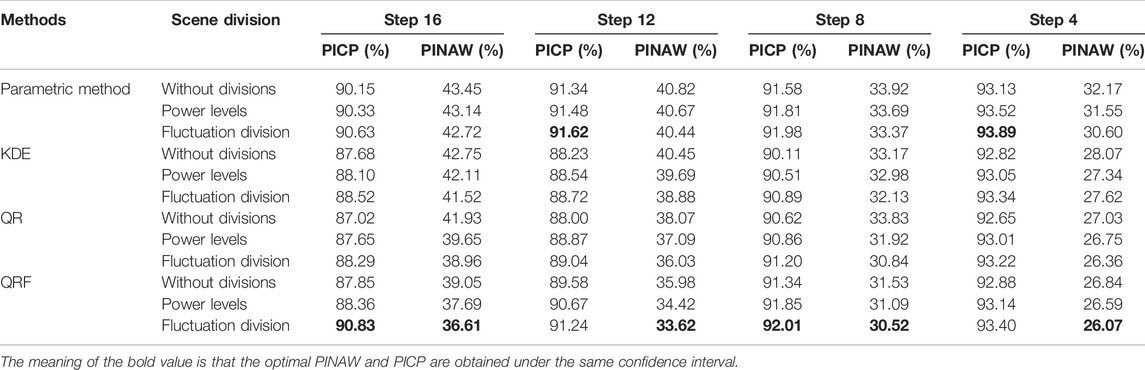
TABLE 4. Calculation of indicators for different error scenario classification methods.
In order to comprehensively evaluate the validity of this method, the reliability of this method and other methods were analyzed and evaluated by finding the reliability indexes, and the reliability indexes and coverage width-based criterion (CWC) were calculated as follows:
where
Figure 8 shows the reliability of the interval prediction methods for the parametric and non-parametric methods analyzed by clustering of the fluctuating process. The interval prediction method by clustering the power series fluctuation process and combining it with QRF has higher reliability and better interval prediction than most of the interval prediction methods at each prediction step and at each confidence level. The parametric method has a larger PICP because of its higher PINAW compared to other methods. The following will calculate the CWC metrics for each method considering the combined PICP and PINAW.
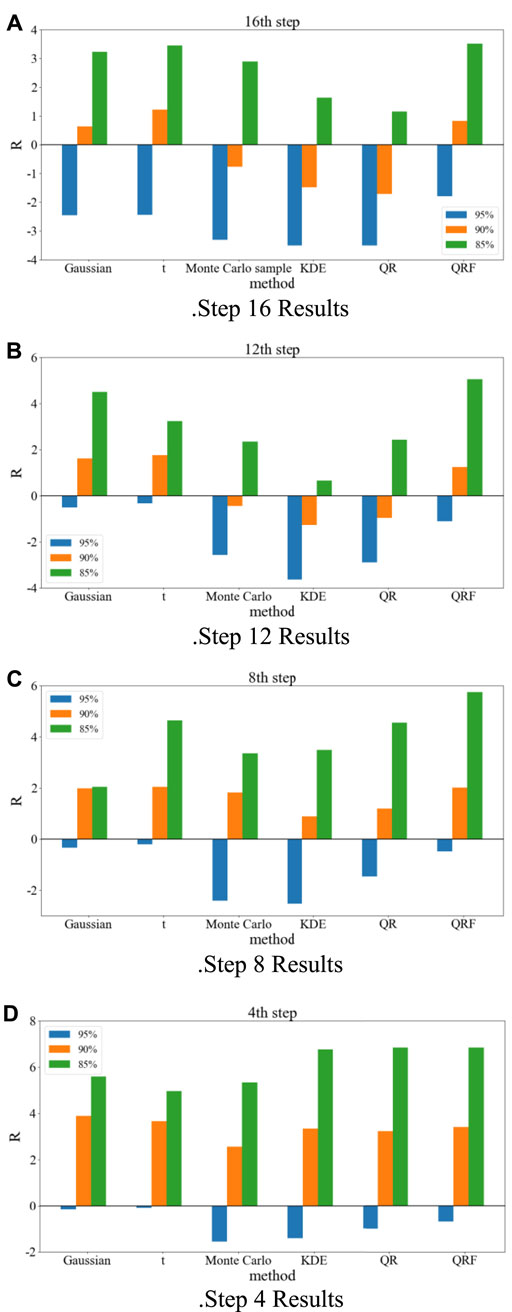
FIGURE 8. Reliability analysis of different methods. The labels (A–D) is the interval prediction effect diagram of the method proposed in 16th, 12th, 8th, 4th.
Table 5 shows the calculated CWC metrics for each method at 85, 90 and 95% confidence levels on different time scales. The CWC takes into account the average bandwidth of the prediction intervals and the interval coverage, and it can be seen that the method in this paper has better interval prediction results than the other five methods, and obtains a higher PICP with a lower PINAW. The interval prediction framework proposed in this paper, which considers the division of wind power series fluctuation process and QRF can effectively predict the guaranteed output of wind power, thus providing more reliable guidance for the operation and dispatch of power systems.
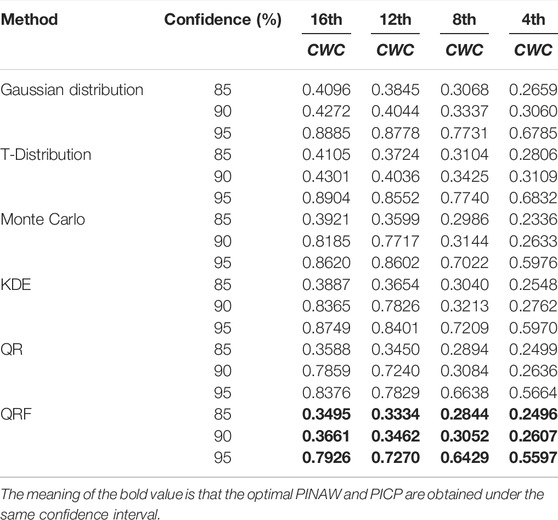
TABLE 5. CWC at different confidence levels for each time scale.
To further verify the validity of this paper, this study conducted interval forecasting in spring using January to February as the training set and March as the test set. Figure 9 shows the interval forecasting effect of a 3-day period in March using the method proposed in this study, and it can be seen that the QRF interval forecasting model based on the clustering division of the fluctuation process considered at the same confidence level. It is still able to get lower PINAW and higher PICP while ensuring tracking wind power time series variation in different seasons, which can provide more accurate forecast information for decision makers.
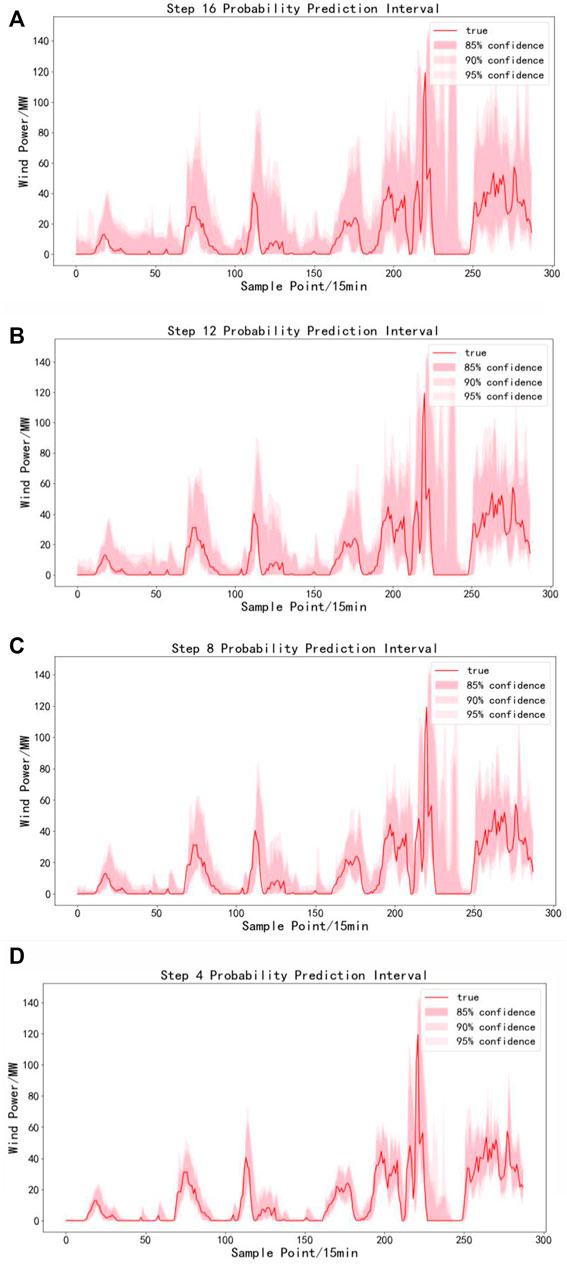
FIGURE 9. Prediction interval of proposed model in different time scales in spring. The labels (A–D) is the interval prediction effect diagram of the method proposed in 16th, 12th, 8th, 4th.
This paper defines the fluctuation process by analysing the volatility of the single point time series of wind power, and uses the SOM to cluster and divide the fluctuation process, and then uses the QRF to make interval predictions for different fluctuation processes, and finally does a comparative analysis by doing step 16, step 12, step 8 and step 4 under ultra-short-term power prediction at different confidence levels, and concludes as follows.
2. Compared with the traditional interval prediction method based on error analysis and modeling based on power, the method of clustering division of fluctuation process and each interval prediction method is better than the prediction method without error scene division, the average PINAW of the prediction interval is reduced by 0.86%, and the average PICP is increased by 1.43%. Compared with the interval prediction method which only considers the output level of wind power, the average PINAW is reduced by 0.63% and the PICP is increased by 0.44%. which effectively improves the prediction accuracy of uncertainty prediction.
2. The nonparametric method is better than the parametric method as a whole, and the QRF which combines the fluctuation characteristics of wind power has the best performance in related methods. compared with the parameter method and other nonparametric uncertainty prediction methods such as QR and KDE the interval prediction effect of QRF under ultra-short-term multi-step prediction is improved in all time scales and confidence levels. It has higher interval coverage under narrower interval average bandwidth, which is 2.17% lower on PINAW and 1.4% higher on PICP than other methods. In the case of comprehensive consideration of PICP and PINAW, the performance and effect of interval prediction are improved, which is helpful to improve the wind power consumption, reduce the operation risk, improve the decision-making level, and provide more reliable guidance for the operation and dispatching of power system.
3. This paper mainly considers the fluctuation process of wind power, and the next step will comprehensively consider the physical change process of wind power and wind speed, and even the physical change process of regional weather in different seasons, and comprehensively consider the fluctuation process of power and wind speed, so as to provide more comprehensive prediction information and provide data support for the decision-making of power system.
The data analyzed in this study is subject to the following licenses/restrictions: wind power forecasting. Requests to access these datasets should be directed to YH, 751006681@qq.com.
YS organized the database. MY performed the statistical analysis. YH wrote the first draft of the manuscript.
This work was fully supported by the National Key R and D Program of China (Technology and application of wind power/photovoltaic power prediction for promoting renewable energy consumption, 2018YFB0904200).
Author YS was employed by State Grid Jilin Electric Power Company Ltd.
The remaining authors declare that the research was conducted in the absence of any commercial or financial relationships that could be construed as a potential conflict of interest.
All claims expressed in this article are solely those of the authors and do not necessarily represent those of their affiliated organizations, or those of the publisher, the editors and the reviewers. Any product that may be evaluated in this article, or claim that may be made by its manufacturer, is not guaranteed or endorsed by the publisher.
Aasim, , , Singh, S. N., and Mohapatra, A. (2019). Repeated Wavelet Transform Based ARIMA Model for Very Short-Term Wind Speed Forecasting. Renew. Energ. 136, 758–768. doi:10.1016/j.renene.2019.01.031
Alexandre, C., Antonio, C., Navarro, J., Lizcano, G., Madsen, H., and Feitosa, E. (2008). A Review on the Young History of the Wind Power Short-Term Prediction. Sust. Energ. Rev. 12 (6), 1725–1744.
Bludszuweit, H., Dominguez-Navarro, J. A., and Llombart, A. (2008). Statistical Analysis of Wind Power Forecast Error. IEEE Trans. Power Syst. 23 (3), 983–991. doi:10.1109/tpwrs.2008.922526
Bruninx, K., and Delarue, E. (2014). A Statistical Description of the Error on Wind Power Forecasts for Probabilistic reserve Sizing. IEEE Trans. Sustain. Energ. 5 (3), 995–1002. doi:10.1109/tste.2014.2320193
Gu, B., Zhang, T., Meng, H., and Zhang, J. (2021). Short-term Forecasting and Uncertainty Analysis of Wind Power Based on Long Short-Term Memory, Cloud Model and Non-parametric Kernel Density Estimation. Renew. Energ. 164, 687–708. doi:10.1016/j.renene.2020.09.087
He, Y., and Zhang, W. (2020). Probability Density Forecasting of Wind Power Based on Multi-Core Parallel Quantile Regression Neural Network. Knowledge-Based Syst. 209 (17), 106431. doi:10.1016/j.knosys.2020.106431
Jyotirmayee, N., Pradipta, K., and Dhar, S. (2019). A Multi-Objective Wind Speed and Wind Power Prediction Interval Forecasting Using Variational Modes Decomposition Based Multi-Kernel Robust ridge Regression. Renew. Energ. 136, 701–731. doi:10.1016/j.renene.2019.01.006
Lin, W., Wen, J., Ai, X., Cheng, S., and Li, W., (2012). Study on the Probability Distribution of Wind Power Fluctuation Characteristics. Proc. CSEE 32 (01), 38–46+20.
Liu, H., Duan, Z., Li, Y., and Lu, H. (2018). A Novel Ensemble Model of Different Mother Wavelets for Wind Speed Multi-step Forecasting. Appl. Energ. 228, 1783–1800. doi:10.1016/j.apenergy.2018.07.050
Ma, L., Luan, S., Jiang, C., Liu, H., and Zhang, Y. (2019). A Review on the Forecasting of Wind Speed and Generated Power. Renew. Sust. Energ. Rev. 13 (4), 915–920. doi:10.1016/j.rser.2008.02.002
Pinson, P., and Kariniotakis, G. (2010). Conditional Prediction Intervals of Wind Power Generation. IEEE Trans. Power Syst. 25 (4), 1845–1856. doi:10.1109/tpwrs.2010.2045774
Qi, M., Gao, H., Wang, L., Xiang, Y., Lv, L., and Liu, J. (2020). Wind Power Interval Forecasting Based on Adaptive Decomposition and Probabilistic Regularised Extreme Learning Machine. IET Renew. Power Generation. 14, 3181–3191. doi:10.1049/iet-rpg.2020.0315
Qiao, Y., Lu, Z., and Wu, W. (2021). Short-term Wind Power Probability Forecasting Considering Error Time-Series-Conditional Properties. Power Syst. Technol. 44 (7), 2529–2537.
Wan, C., Cui, W., and Song, Y. (2021). Probabilistic Forecasting for Power Systems with Renewable Energy Sources: Basic Concepts and Mathematical Principles. Proc. CSEE 41 (19), 6493–6509.
Wan, C., Xu, Z., Pinson, P., Dong, Z., and Wong, K. (2013). Probabilistic Forecasting of Wind Power Generation Using Extreme Learning Machine. IEEE Trans. Power Syst. 29 (3), 1033–1044. doi:10.1109/TPWRS.2013.2287871
Wang, Z., Wang, W., Liu, C., and Feng, S. (2013) Uncertainty Estimation of Wind Power Prediction Result Based on Wind Process Method. Power Syst. Technol. 37 (1), 242–247.
Wu, W., Qiao, Y., Lu, Z., Wang, N., and Zhou, Q. (2017). Probabilistic Wind Power Prediction Methods and Prospects. Power Syst. Automation 41 (8), 167–175.
Xue, H., Jia, Y., Wen, P., and Farkoush, S. G. (2020). Using of Improved Models of Gaussian Processes in Order to Regional Wind Power Forecasting. J. Clean. Prod. 262, 121391. doi:10.1016/j.jclepro.2020.121391
Xue, Y., Yu, C., Zhao, J., Li, K., Liu, X., Wu, Q., et al. (2015). A Review on Short-Term and Ultra-short-term Wind Power Prediction. Automation Electric Power Syst. 39 (6), 141–151.
Yang, M., and Qi, Y. (2015). Volatility of Wind Power Sequence and its Influence on Prediction Error Based on Phase Space Reconstruction. Proc. CSEE 35 (24), 6304–6314.
Yang, M., and Dong, H. (2021). Short-term Wind Power Interval Prediction Based on Numerical Weather Forecast Wind Speed and Monte Carlo Method. Automation Electric Power Syst. 45 (5), 79–85.
Yang, M., Shi, C., and Liu, H. (2021). Day-ahead Wind Power Forecasting Based on the Clustering of Equivalent Power Curves. Energy 218, 119515. doi:10.1016/j.energy.2020.119515
Yang, M., Zhang, L., Cui, Y., Zhou, Y., Chen, Y., and Yan, G. (2020). Investigating the Wind Power Smoothing Effect Using Set Pair Analysis. IEEE Trans. Power Syst. 11 (03), 1161–1172. doi:10.1109/tste.2019.2920255
Ye, L., Ren, C., Zhao, Y., Rao, R., and Teng, J. (2016). A Hierarchical Analysis Method for the Numerical Characteristics of Ultra-short-term Wind Power Prediction Errors. Proc. CSEE 36 (3), 692–700.
Yuan, X., Chen, C., Jiang, M., and Yuan, Y. (2019). Prediction Interval of Wind Power Using Parameter Optimized Beta Distribution Based LSTM Model. Appl. Soft Comput. 82, 105550. doi:10.1016/j.asoc.2019.105550
Zhang, L., Li, Y., Zhang, H., Xu, X., Yang, Z., and Xu, W. (2021). A Review of the Potential of District Heating System in Northern China. Appl. Therm. Eng. 188, 116605. doi:10.1016/j.applthermaleng.2021.116605
Keywords: wind power, ultra-short-term prediction, self-organizing map, fluctuation, quantile regression forest
Citation: Sun Y, Huang Y and Yang M (2022) Ultra-Short-Term Wind Power Interval Prediction Based on Fluctuating Process Partitioning and Quantile Regression Forest. Front. Energy Res. 10:867719. doi: 10.3389/fenrg.2022.867719
Received: 01 February 2022; Accepted: 03 March 2022;
Published: 26 April 2022.
Edited by:
Fouzi Harrou, King Abdullah University of Science and Technology, Saudi ArabiaReviewed by:
Fadhil Y. Al-Aboosi, Texas A and M University, United StatesCopyright © 2022 Sun, Huang and Yang. This is an open-access article distributed under the terms of the Creative Commons Attribution License (CC BY). The use, distribution or reproduction in other forums is permitted, provided the original author(s) and the copyright owner(s) are credited and that the original publication in this journal is cited, in accordance with accepted academic practice. No use, distribution or reproduction is permitted which does not comply with these terms.
*Correspondence: Mao Yang, eWFuZ21hbzgyMEAxNjMuY29t
Disclaimer: All claims expressed in this article are solely those of the authors and do not necessarily represent those of their affiliated organizations, or those of the publisher, the editors and the reviewers. Any product that may be evaluated in this article or claim that may be made by its manufacturer is not guaranteed or endorsed by the publisher.
Research integrity at Frontiers
Learn more about the work of our research integrity team to safeguard the quality of each article we publish.