- 1College of Hydraulic Science and Engineering, Yangzhou University, Yangzhou, China
- 2International Shipping Research Institute, GongQing Institute of Science and Technology, Jiujiang, China
- 3High-tech Key Laboratory of Agricultural Equipment and Intelligentization of Jiangsu Province, Jiangsu University, Zhenjiang, China
Double-stage flap valves are widely used in new pumping stations. The different opening angles of the double-stage flap valves have a great influence on the outflow. To gain insight into this phenomenon, four commonly used operating conditions with opening angles were selected to perform three-dimensional simulation calculations and physical model studies on the flow pattern of the water behind the valves at different flow rates. The flow pattern of the water flow is analyzed by three indicators: the streamline of the water flow, the uniformity of the flow velocity, and the head loss in the culvert. The result shows that the coefficient of resistance loss along the way of the outlet culvert has a negative correlation with the opening angle. The larger the opening angle of the flap valve, the less the head loss of the water flow in the outlet culvert, and the flow pattern of the water flow in the culvert gradually becomes better.
1 Introduction
Pump stations play an important role in water resource deployment, urban flood control, stable and high agricultural production, drought and flood protection, etc. The flap valve is an important part of the pumping station operation process, and its role is to use its gravity and the pressure of the water flow to fall on its own after the pumping station has finished running to block the water flow. The more common flap valve types are integral flap valves, double-stage flap valves, multi-stage flap valves, suspension flap valves, side single-opening flap valves, side double-opening flap valves, etc. The flap valve design is related to the stable operation of the pump station.
Compared with other cut-off methods, flap valves have certain apparent advantages: the first is its simple structure design. In addition to the valve seat and the valve body, the structure of the flap valve only needs a one-to-one chain to connect the two. As a result, the impact of the water flow will open the flap valves, and it will work typically. When the current is cut off and locked, the flap valve will close automatically by its weight and water pressure. The second is its low production price and easy-to-obtain raw materials; the third is its high reliability in the operation process and low failure rate. The length of the valve body of the flap valve is many times the length of the valve shaft. Therefore, the valve body can be opened when impacted, with the impact force of the valve shaft, and with other influences, so there are very few valves that are affected. Finally, it is easy to maintain and install without complicated procedures. The water flow and itself do the closing and opening of the flap valve, no precise positioning is required, and it is easier to use automatic control equipment.
With the development of the society and the need to deploy water resources, more and more pumping stations have been built. As the main intercepting device, flap valves have a significant impact on the safe operation of the pumping station, so it is essential to study the flow pattern of the water behind the flap valve and choose the suitable buffer device. With the advent of fluid simulation software, in the research of numerical simulation theory (Sudo et al., 1998; Ahmed, 2000; Luo et al., 2018; Zhang et al., 2021; Wang et al., 2021; Zhou et al., 2021; Hu et al., 2022; Zhang et al., 2022), analysis of the turbulence model, and formulation of the turbulent kinetic energy equation (Zeng and Li, 2010; Shin, 2018), more and more high-precision numerical simulation technologies have been used to simulate the complex flow in the pump station. The standard K-ε model, the realizable K-ε model, the renormalized group (RNG) K-ε model, and the shear stress transfer (SST) K-ε fluid volume (VOF) multiphase model (Qian et al., 2016) are used to simulate the three-dimensional (3D) unsteady turbulence in the pump basin. The LES (large eddy simulation) technology (Yamade et al., 2020) is used to analyze the causes and influencing factors of the inspiratory vortex in the intake tank of the pumping station.
Based on this, researchers only conducted optimization research on the simulation of the operation of the flap valve through numerical simulation or physical experiments and few studies on the flow state behind the flap valve. In this study, the numerical simulation method and physical model experiments were used to analyze the flow pattern from three aspects: velocity uniformity, streamline, and head loss of the outlet culvert after tapping the flap valve. It provides academic help for optimizing the flow state of the culvert in the pumping stations.
At present, some scholars have carried out relevant research, mainly in the following aspects: in the study of pump station optimization (Alawadhi et al., 2021; Shen et al., 2021; Shi et al., 2020), based on the multidisciplinary optimization design method of the approximate model, established the objective function based on the blade quality and efficiency of design conditions and optimized the impeller of the axial-flow pump, but only the impeller of the axial flow pump is analyzed, and the outflow conditions of the axial flow pump are not studied. Wang et al. (2020) studied and tested the geometric parameters of the blade groove structure of various impellers and analyzed the influencing factors by numerical simulation and physical model studies. In the study of pump station faults, Zhu et al. (2022) analyzed multi-signal defects of hydraulic piston pumps by using a profoundly improved convolutional neural network. Zhu et al. (2021) used ENET-5 and particle swarm optimization hyperparameter optimization to study the faults of hydraulic piston pumps and analyzed the advantages of this method. Moreover, in the research of the pump station flap valve, Yang (2011) used computational fluid dynamics (CFD) software to carry out the numerical calculation of the outflow flow state when the opening angle of the valve was 25° in the design condition of the pump device and when there was no tap valve and analyzed the outflow flow state with and without the valve. Gao et al. (2021) investigated the velocity distribution and streamlining of the distribution of pipelines at different sections, the distribution uniformity of outlet sections, and the hydraulic loss of pipelines at different flows through the standard K-ε model. Yu and Zhu (2014) used the standard k-ε turbulence model and the SIMPLEC algorithm to conduct CFD numerical tests on the flow field in the rear pressure water tank of the pumping station. Hong and Li (2015) analyzed the flow state of the upside-down and side-down flap valves using the velocity vector diagram through numerical simulation analysis of hydraulic characteristics. Yan et al. (2020) used CFD technology to conduct numerical simulation calculations on the straight pipe outlet passage of the horizontal pump station and analyzed the flow characteristics inside the outlet passage and the influence of hydraulic loss by changing the outlet passage profile.
The above research results are mainly about the flow in the culvert and wall turbulence. There are also some research papers about machine learning optimization flow (Zhu et al., 2021; Tang et al., 2022). However, there are few research studies on the near-wall vortex in pump station engineering, especially on the formation mechanism of the asymmetric wall-attached vortex in pump station engineering. In this study, the standard K-ε model is selected to conduct numerical simulation research on the flap valves of a pumping station in a practical project. The semi-implicit SIMPLE (Semi-Implicit Method for Pressure-Linked Equations) algorithm is used to solve the velocity and pressure coupling equations. The VOF (Volume of Fluid) method is used to simulate the free surface. The uniformity of the flow velocity of the culvert behind the double-stage flap valves is studied, and its proper opening angle is analyzed. By using the physical model experiment, the reasonable opening angle of the double-stage flap valves is analyzed by studying the head loss before and after the valves. Finally, combined with the results of numerical calculations and physical models, a comprehensive analysis of the proper opening angle of the double-stage flap valves is made. It provides theoretical help for solving this problem in pumping station engineering.
The rest of the article is organized as follows: the first section describes the parameter settings of pumping station outlet modeling, numerical simulation, and physical model experiments. The second section summarizes the flow pattern behind the side flap valve of the pump station with the change of opening angle through numerical simulation results. Next, the flow pattern is translated behind the side flap valve of the pump station with the evolution of opening angle through numerical simulation results. By using the physical model experiment, the reasonable opening angle of the double-stage flap valves is analyzed by studying the head loss before and after the valves. The flow pattern is analyzed from three aspects: velocity uniformity, streamline, and head loss of the outlet culvert pipe behind the flap valve. The last section summarizes the thesis and gives relevant conclusions.
2 Methods
2.1 Model Design
The total height of the pumping station is 3.30 m, and the total width is 3.24 m. The upper and lower flap valves have a 0.4 m pump station design lower hinge section. The height of the upper flap valves is 1.7 m, and that of the lower flap valves is 1.2 m.
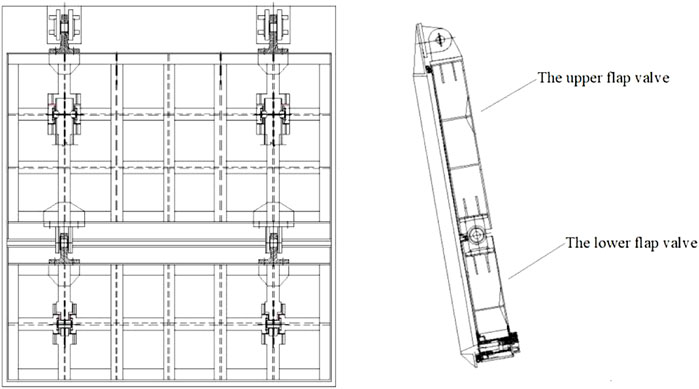
The pump station engineering design drawings and relevant data build a computational area model for its exit buildings. First, the flow state under different flow rates was analyzed by numerical simulation. Then, the influence of different opening angles of the flap valves on the water flow behind the flap valves is obtained. It is found that the flow state behind the flap valves is more complicated when the flow rate is 16 m³/s. Therefore, the working condition under this flow rate is selected for further studies. Based on the 3D modeling software UG, Build the 3D model including a water pump outlet pipe, double-stage flap valves, a pressure box culvert, and a road culvert (four parts). The elevation of the pump station body and the culvert through the road is shown in Figure 1, and the structure diagram of the double-stage flap valve is shown in Figure 2.
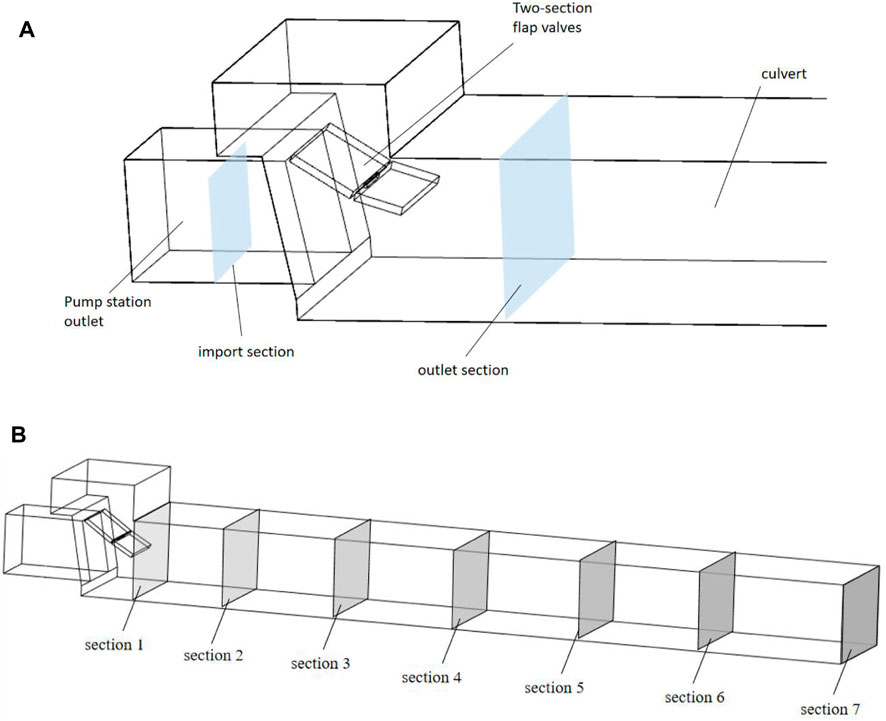
FIGURE 1. Diagram of the model and cross-section: (A) diagram of the flap valves section and (B) diagram of the culvert section.
2.2 Numerical Simulation
The governing equations used in the numerical simulation in this paper are the continuity equation of the incompressible fluid and the Reynolds time-mean N-S equation. Common turbulence models for numerical value simulation include the standard k-ε model, RNG k-ε model, realizable k-ε model, standard k-ε model, etc. This paper adopts the realizable k-ε model (Jafarzadeh et al., 2011; Lu et al., 2021). The numerical calculation methods of the flow field mainly include the coupling calculation method and separated calculation method. The numerical solution of the equation in this paper adopts the separated semi-implicit pressure coupling algorithm (SIMPLEC method) (Axell and Liungman, 2001; Xi et al., 2021; Xi and Lu, 2021).
The 3D turbulent N-S equation was filtered using a spatial filter function. The governing equation of the large eddy model is
The equation for
The equation for
The basic idea of the VOF method is as follows: define volume rate function F = F (x, y, z, t), which indicates the relative ratio of the volume of the fluid in the calculation area to the volume of the calculation area. For a certain computing unit, when F (x, y, z, t) = 1, it means that the unit is full; when F (x, y, z, t) = 0, it means that the unit is empty; when 0<F (x, y, z, t)<1, it means that part of the unit is filled with the liquid. The free surface exists in the third unit. The gradient of F can determine the average direction of the free boundary. After calculating the value and angle of each element, the approximate position of the free surface in each element can be determined. The sum of the volume fractions of water and gas in each unit is 1. There will be one more (water or gas) volume fraction variable compared with the real single-phase flow. Let aw denote the volume fraction of water; then, the volume fraction of gas aa can be expressed as aa = 1−aw.
As long as the volume fractions of water and gas are known everywhere in the flow field, the unknown quantities and characteristic parameters shared by all other water and gas can be represented by the weighted average of the volume integral. Therefore, in any given unit, these variables and characteristic parameters represent either pure water or gas or a mixture of the two. Therefore, the determination of the water–air interface requires solving the following equation:
t is the time. After the introduction of VOF, ρ and v are functions of the volume fraction, not constants, and through the iterative solution to the volume fraction of water aw, ρ and v can be obtained by the following formula:
In the formula, ρa and ρw indicate the density of air and water, respectively, and va and vw indicate the molecular viscosity coefficients of air and water, respectively.
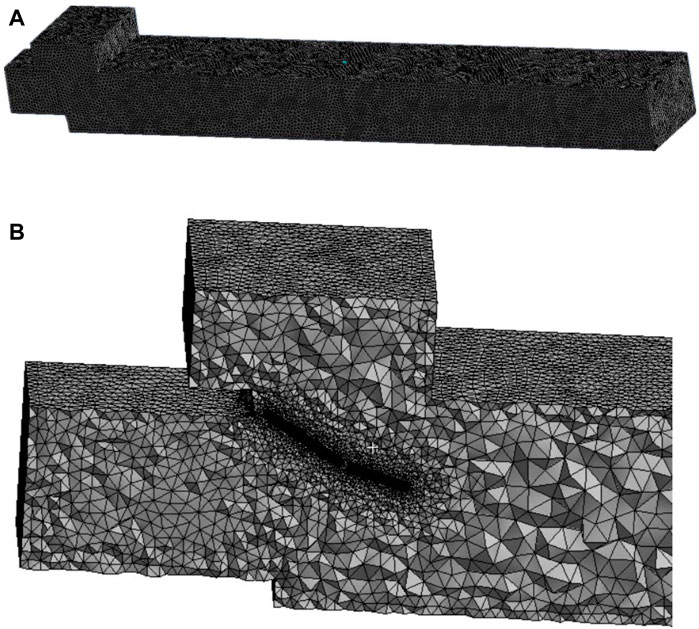
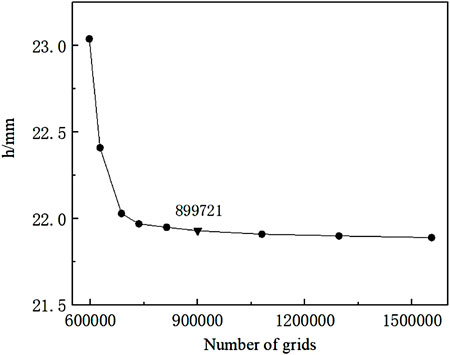
Boundary conditions such as the inlet section, outlet section, and outlet flow mode should be set for the numerical simulation calculation. In this numerical calculation, the inlet section was controlled using the velocity inlet (Shi et al., 2010); the water body velocity is 1.778 m/s. The outflow section selected outflow of the culvert, set as free outflow. The relative pressure was 1 standard atmospheric pressure. Other surfaces are set as the solid wall. The flap valve is also treated as a solid wall surface but set as a separate structural surface. The model grid is meshed by ANSYS’s meshing software ICEM CFD. After study and trial calculations, the maximum size of the overall structure grid is 0.2, and the maximum size of the flap valve panel is 0.05. The mesh density has a significant influence on the results of numerical calculations. The finite volume method solves the nodes composed of each grid discrete in the whole computational domain; the internal flow structure cannot be captured when the grid nodes are insufficient (Xu et al., 2014). For the progressively increasing irrelevance analysis of 1.2 times the total number of grids, the hydraulic loss of double-stage flap valves under different grids is taken out. When the number of grids exceeds 899721, the hydraulic loss tends to be stable, and the grid size is selected as the dividing basis. The maximum size of the overall structure grid is 0.2, and the maximum size of the flap valve panel is 0.05. The grid diagram and the diagrams of hydraulic loss under different grids are shown below.
2.3 Physical Model
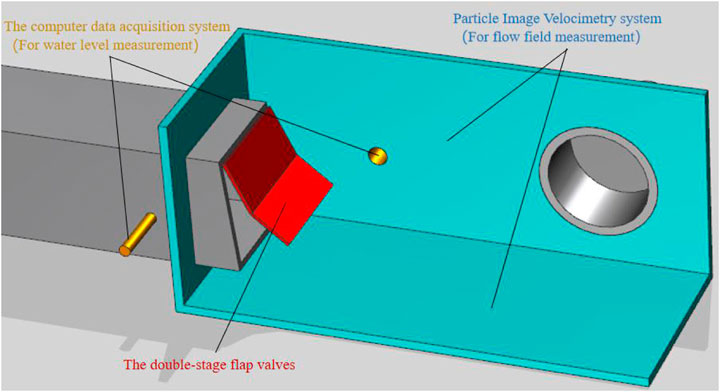
The hydraulic loss model test device of the double-section door flap consists of water supply and return equipment and systems, flow stabilization facilities, regulation and control facilities, measuring equipment and facilities, and the door body model. In a typical operation, the circulation system is composed of a pump, connecting pipe, control gate valve, steady flow plate, pressure-measuring node, plexiglass tube, gradient tube, transparent square box, flap valve body, and transparent outlet pipe, and the water level is controlled by regulating the gate. The door model is made of plexiglass, and the weight and buoyancy of the door and its corresponding moment are simulated by the counterweight method. At the same time, the geometric similarity of the prototype and model door body is ensured. Figures 3, 4 for the model test.
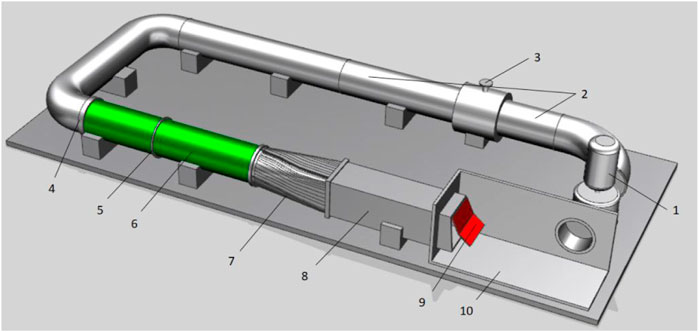
FIGURE 3. Diagram of the model test device: (1) pump, (2) connecting pipe, (3) control gate valve, (4) steady flow plate, (5) pressure-measuring node, (6) plexiglass tube, (7) gradient tube, (8) transparent square box, (9) flap valve body, and (10) transparent outlet pipe.
The scale of the original model is 5:1, and the water level inside and outside the gate is displayed by the computer data acquisition system. The water level measurement point outside the pat door is located under the pat door, and the water level measurement point inside the pat door is located at the bottom of the pipe 50 cm inside the door. The flow measurement is taken through a throttling differential pressure flow meter. The standard orifice plate is stainless steel, and the pressure method is flange pressure. During the model test, speed measurement points 0.7 m inside and 1.5 m outside the exit of the model are set. PIV (Particle Image Velocimetry) is used to measure the culvert flow field in the transparent plastic pipe.
The PIV system (Chen et al., 2022a; Chen et al., 2022b) was used to simultaneously measure the flow field in the transparent plastic tube behind the flap valves. The working frequency of the PIV test laser is 50 HZ, the acquisition speed is 260 frames per second, and the interval is 100 microseconds. The CCD camera takes 600 PIV particle pictures each time. It analyzes them through Microver software. Then, the data are further processed by Tecplot software to obtain the steady-state flow field diagram and velocity field diagram after the flap valves. To analyze the flow field characteristics after the flap valves are shut based on the cloud image, the flow field characteristics after the flap valves at different opening angles are processed through the Tecplot software.
A certain depth of pure colorless water is injected into the entire circulation device; lasers, synchronizers, etc., are installed and connected; and the light source generated by the laser is aligned at the test section. The position of the CCD camera is adjusted, and the corresponding test parameters of the PIV system are set so that the particle image of the test section is displayed on the computer screen. During the test, the camera and laser light source should not be shaken or displaced. During the experiment, the pump is turned on to form a stable water injection form. The water injection volume can be controlled through the regulating gate valve on the water injection pipe, and the water level in the test section can be adjusted and stabilized. The water flows into the transparent plastic pipe, and the water injection process is formed continuously. When the water flow circulates in the flow channel, until the water flow movement in the test section becomes stable, the computer pre-installed program is used to collect the flow field behind the flap valves and the water level and flow before and after the flap valves.
2.4 Velocity Uniformity of a Cross Section
The outlet of the culvert has better flow conditions, and the opening angle of the flap valve directly affects the flow pattern behind the flap valve. Therefore, when designing the flap valve, it is necessary to consider the complete development of water flow in the culvert, and the flow state should be relatively stable. Furthermore, the velocity distribution should be relatively uniform when it reaches the outlet of the culvert (Xu and Zheng, 2013). In this paper, several calculated sections of the culvert section are selected for comparative analysis to consider the flow pattern of water entering the culvert through the flap valve.
Velocity uniformity of a section is the distribution uniformity of axial velocity on the section. It can be used as a quantitative index for flow field analysis, reflecting the flow field environment of the outlet section (Nejadrajabali et al., 2016). The higher the velocity uniformity of the section is, the more uniform the velocity distribution on the section is and the better the flow condition is. The formula for calculating the uniformity of axial velocity distribution is as follows:
Type:
2.5 Head Loss in the Outlet Culvert Section
After the culvert follows the flap valve, the additional flap valve will affect the flow in the culvert. This is because different opening angles of the flap valve affect the flow head loss in the culvert section. To get a complete understanding of the effect of the opening angle of the valve on the flow of water behind the valve, the change of culvert head loss with different opening angles of the flap valve is analyzed and the relationship between hydraulic λ, the resistance coefficient along the path, the opening angle of the valve, and the flow rate are explored. In the case of determining the opening angle of the flap valves, the following formula can be used to estimate the head loss of the flap valves:
In this formula, v is the flow rate at the pump outlet(m/s), g is the acceleration of gravity(m/s2), and
2.6 Case Selection
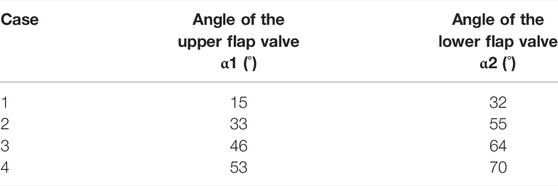
To study the influence of the opening angle of the double-section flap valves on the flow pattern of the outlet pipe behind the culvert, this example mainly calculates the flow state of the outlet culvert at different opening angles of flap valves under multiple flow rates of the pump station. As the flow rate continues to increase, the opening angle of the flap valves will gradually increase. Under different opening angles, the hydraulic loss and flow pattern will be different. It will also have a particular impact on the flow pattern of the water flow behind the flap valves. The opening angle is formed by water flow and the flap valves. The flap valves have a specific working state when they are working. The four options selected here are commonly used in the operating state corresponding to the flow in the actual project. The angle of the upper flap valve is set as α1. The angle of the lower flap valve is set as α2. Table 1 for the opening angle scheme of double-section flap valves. Figure 5 is the diagram of flap valve angles.
3 Analysis of the Results
3.1 Analysis of Numerical Simulation Results
3.1.1 Flow Field Analysis
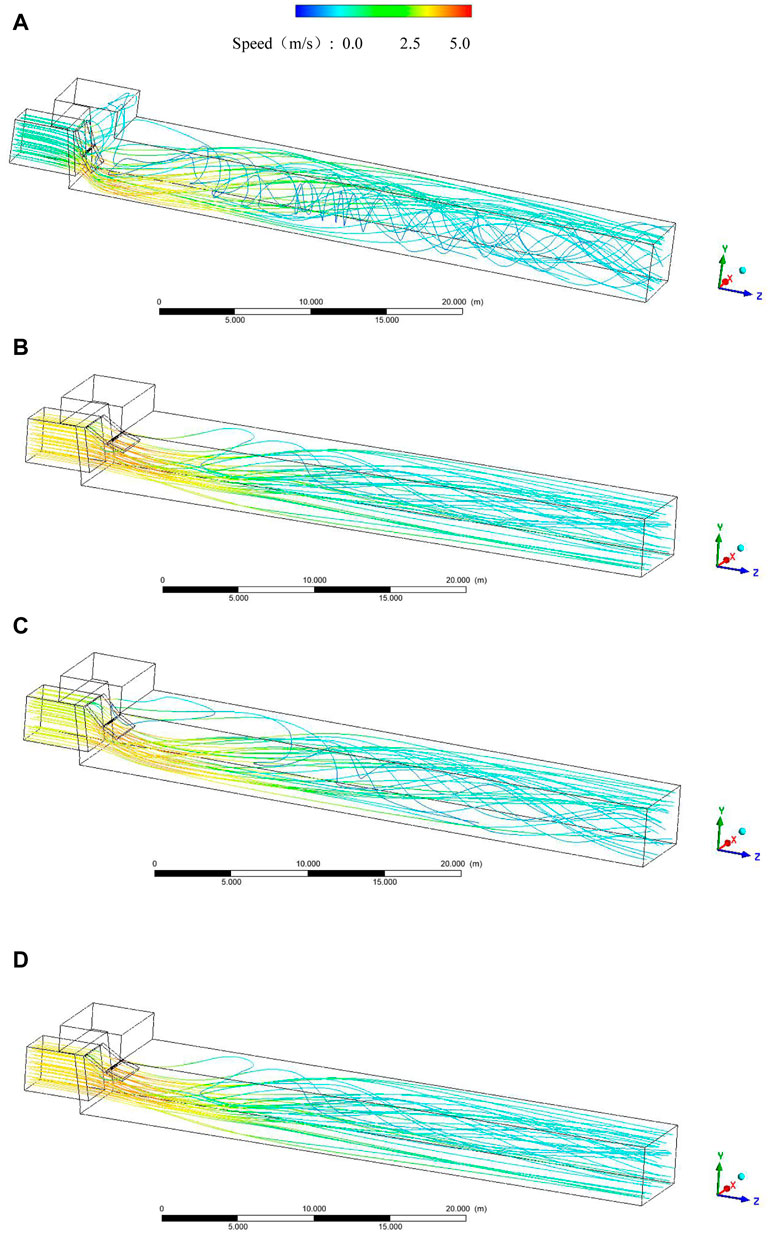
Taking a design flow rate of the pumping station of 16 m³/s as an example, the water flow in the culvert behind the gate of the four schemes is simulated by the numerical simulation method. The flow field distribution diagram is obtained (Figure 6 below). The flow line variation of the outlet pressure water tank and culvert section was studied. Analyzing the flow of the entire outlet culvert, at the same time, the culvert outlet section was selected to observe the velocity vector diagram at the section.
According to Figure 8, when the flap valve opens at a tiny angle, the water flow in the culvert is spiral, streamline disorderly, and there will be water retention in the pressure box culvert, accompanied by whirlpools. As the opening angle increases, the flow of water gradually straightens, the streamlines are no longer out of order, and there is no water retention in the pressure box culvert. In order to conduct an in-depth study on flow field changes in pressure box culverts, the cross-section flow velocity vector diagrams 40 m away from the entrance of the four schemes were intercepted for comparison (Figure 7).
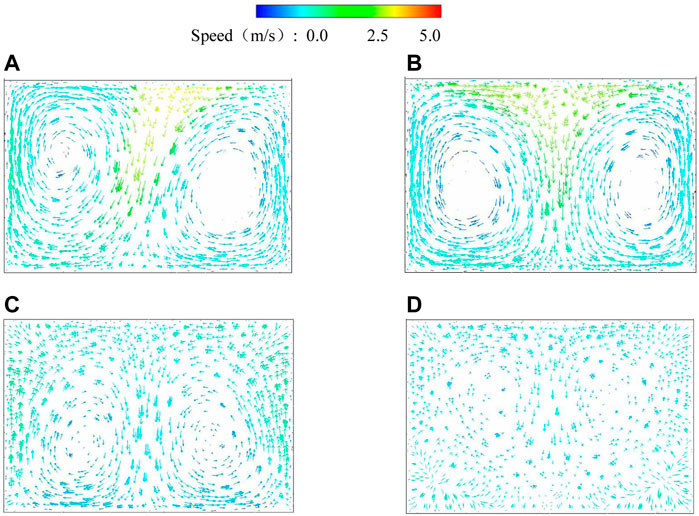
FIGURE 7. Vector diagram of cross-section velocity: (A) case 1, (B) case 2, (C) case 3, and (D) case 4.
According to Figure 9, in case 1, there are two reverse vortices in the section with axial symmetry. The high velocity is distributed in the upper part of the vortex on both sides. The vortexes on both sides are asymmetric and collide in the middle of the upper side of the culvert so that the velocity vector is concentrated here; in case 2, the vortex positions on both sides gradually move downward, and the collision area of the vortex becomes larger, extending to the T-shaped area on the upper side, and the vortex is gradually symmetrical. The flow pattern is still poor; as the valve continues to open, the vortex gets smaller and the flow pattern gets better. In case 3, the vortex is further reduced. The collision area of the vortex is further enlarged. The high-velocity region spreads to the upper M-shaped part, and the low-velocity area is compressed below the culvert. The high-speed area is inclined to the lower side. In case 4, the overall flow velocity of the section decreases, the range of vortex becomes smaller, and there is no apparent high-velocity zone. This is due to the friction of the sidewall and the gradient of the flow velocity. The flow velocity in the center of the water flow in front of the shutter is more significant, and the flow velocity near the sidewall is lower, a new flow rate gradient. After passing through the valves, the water flow is fully developed, thus forming two large-scale axis-symmetric vortexes. After the valves are slapped, the inflection affects the water flow, and the high-velocity area is concentrated on the upper part. As the flap valves’ opening increases, the flap valves’ effect gradually decreases, the water flow can pass the flap valves smoothly, and the vortex gradually decreases and disappears.
3.1.2 Flow Field Analysis of the Axial Section
Taking the flow rate of 16 m³/s as an example for analysis, the influence of opening angle change on velocity uniformity was analyzed. In order to study the development and change of water flow, a section every 6 m in the culvert is set to analyze its change rule in order to study the influence of the opening of double-stage flap valves on the water flow behind the valve. The schematic diagram of selected research sections is shown in Figure 8.
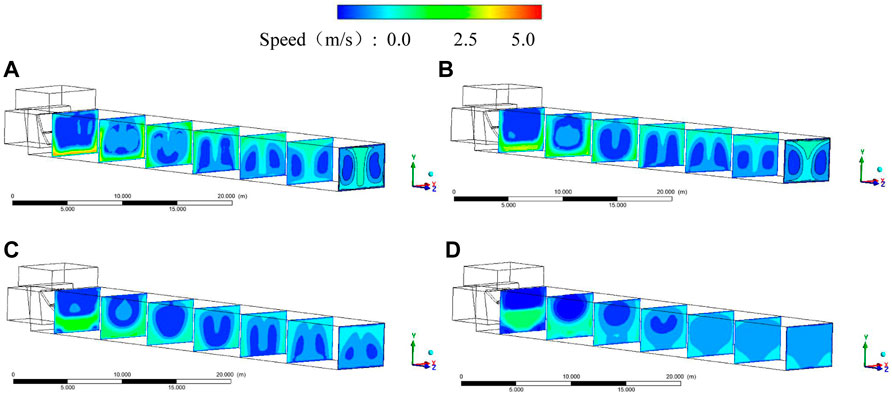
FIGURE 8. Flow field distribution of axial sections: (A) case 1, (B) case 2, (C) case 3, and (D) case 4.
As shown from the figure above, in case 1, when the water flows through the flap valves, the flow pattern is chaotic, and the velocity distribution is irregular. After leaving the flap valves, the water flow shows a trend of rolling up and down. The high-flow velocity area gradually moves upward and forms a reverse vortex on both sides of the cross-section at the backside of the culvert. The distribution of the reverse vortex on both sides of the exit also moves to the upper side, and it is asymmetrically distributed. In case 2, the high-velocity inlet area is mainly compressed on the lower side. In moving to the outlet, the high-velocity area gradually spreads upward from the lower side of the culvert along both sides. Low-speed vortexes are formed on both sides of the middle part of the culvert. The low-velocity area at the exit gathers on both sides of the section, and the vortex range is more extensive than that on both sides of case 1. In case 3, the range of high-velocity area under the inlet gradually increases. The high-velocity area slowly spreads upward along both sides and forms a reverse low-speed vortex on both sides in the middle and front of the culvert. At the outlet, the range of low velocity zone further increases and the velocity gradient decreases. In case 4, the range of high-velocity inlet area is further expanded, and the upward position of the high-velocity zone further advances. The flow tends to be stable, and the outlet velocity distribution is uniform. The overall velocity is low, and there is no obvious velocity gradient.
3.2 Analysis of Physics Experiment Results
3.2.1 Flow Field Analysis of the Axial Section
Physical model tests were used to analyze the flow field at different sections in the culvert using a flow rate of 16 m³/s as an example to analyze the effect of the change in angle of opening of the double-jointed flapper gate on the uniformity of the flow rate. To study the development and variation of the flow, PIV was used to analyze the variation pattern at 6 m intervals in the culvert and to study the effect of the double-jointed flapper gate opening on the flow behind the gate. Figures 1, 2, 9, 10 correspond to the cross-sectional flow field from the inlet to the outlet. The 3D distribution of the specific section flow patterns is shown in Figure 11.
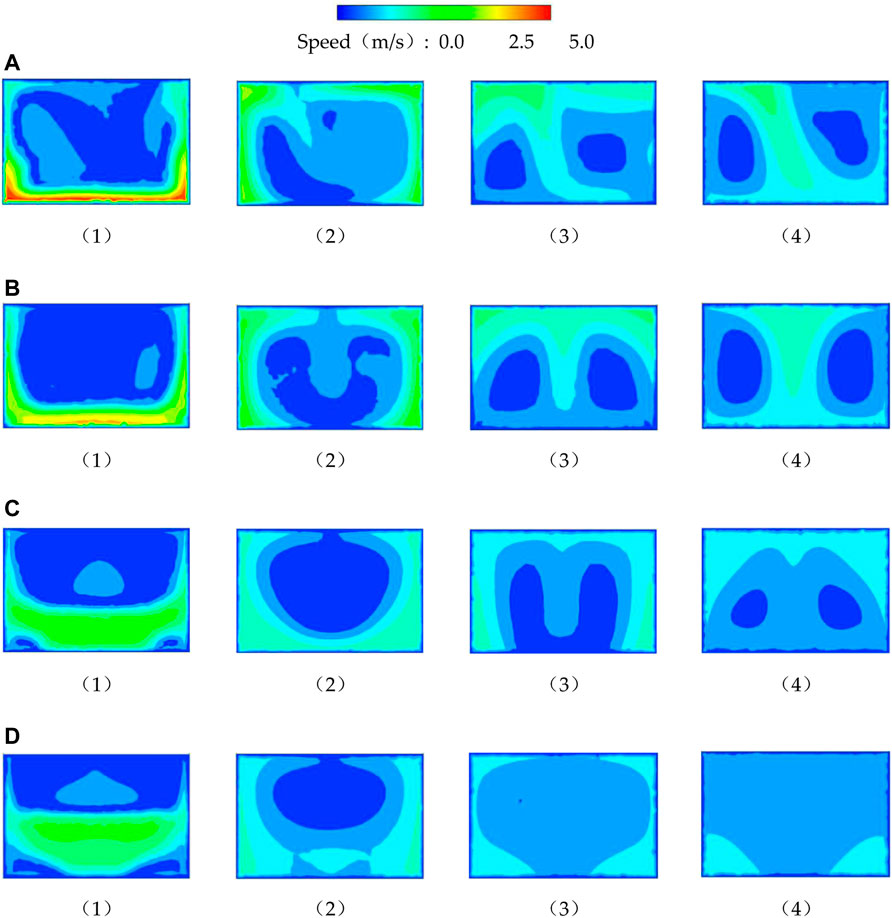
FIGURE 11. Flow field distribution of axial sections: (A) case 1, (B) case 2, (C) case 3, and (D) case 4.
In case 1, the flow pattern at the flap valves is relatively turbulent, and the high-velocity area is concentrated on the lower side. This is because the opening angle of the flap valves is slight, and the water flow is affected by the flap valves. Behind the valves, the water flow develops in the culvert. The high-velocity area spreads upward from both sides along the edge until it gradually fills the entire culvert and forms two asymmetric reverse vortices in the axial section. In case 2, the opening angle of the flap valves is slightly more prominent, and the high-velocity area is still compressed on the lower side, but the water flow development on the rear side is more lagging than that in case 1, the axial tumbling cycle of the water flow becomes smaller, and the flow state becomes better. In case 3, the opening angle of the flap valves is further increased, the axial tumbling cycle of the flow is reduced, and the flow velocity gradient in the culvert is significantly reduced compared to the first two options. In case 4, the flow tends to stabilize in the middle of the culvert, with no significant velocity gradients and no significant tumbling of the water in the culvert, resulting in perfect flow patterns.
Through observation, it can be found that the results of the physical model test and the numerical simulation show the same trend, indicating that the numerical simulation results are credible.
3.2.2 Vector Analysis of the Outlet Section
Taking the flow rate of 16 m³/s as an example, the physical model is studied. To conduct an in-depth study on the flow field changes in the culvert, the outlet section water flow velocity vector diagrams in the four schemes are intercepted for comparison (Figure 12).
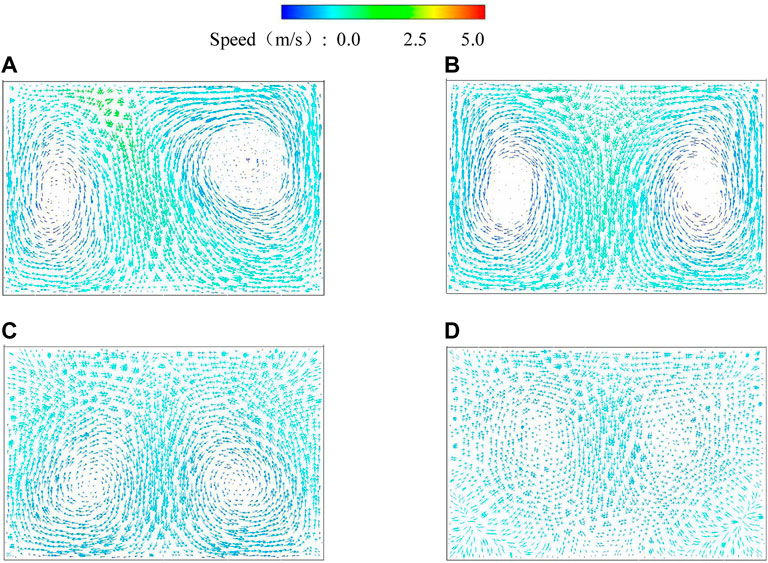
FIGURE 12. Vector diagram of cross-section velocity: (A) case 1, (B) case 2, (C) case 3, and (D) case 4.
According to the above figure, in case 1, two reverse vortexes are asymmetric along the axial direction in the section. As a result, the vortex area on the right side is significantly larger than that on the left side, and the vortexes on both sides are squeezed, resulting in a strip-shaped high-velocity area in the center of the section. In the second scheme, the vortexes on both sides gradually become symmetrical, the squeezed area of the vortex becomes larger and extends to the X-shaped area in the middle, the range of the low-velocity area at the center of the vortex becomes smaller, and the flow state gradually gets better. In case 3, the vortex position moves to the lower side of the culvert, the high-velocity area spreads to the upper M-shaped area, and the velocity gradient in the culvert decreases. In case 4, the overall flow rate is reduced, there is no apparent vortex and no evident flow rate gradient, the flow pattern is good, and the water flow is stable. The experimental results of the physical model verify the numerical simulation results, so the results of the numerical simulation are credible.
3.3 Analysis of Flow Velocity Uniformity
By using the formula of axial velocity uniformity to calculate the velocity uniformity of each section, the results of velocity uniformity of each calculated section under each scheme were compared with those without the flap valve. The results are shown in Figure 13.
According to the curve changes in Figure 12, as the distance increases, the uniformity index of flow velocity improves. According to case 1, when the flap valve opening is small, the overall flow velocity uniformity is low. Still, as the water moves away from the flap valve, the uniformity of flow velocity increases slowly. In the second scheme, where the opening angle of the flap valve is slightly increased, the overall flow velocity uniformity is slightly improved, but like case 1, the uniformity of flow rate increases gradually when it is at a lower level and far from the racket flap valve. In case 3, at 14 m away from the flap valve, the uniformity of flow velocity increases significantly. The uniformity of flow velocity at 33 m exceeds that of the no-flap valve scheme, which shows that the flow pattern in the culvert is improved. In case 4, the uniformity of flow velocity increases rapidly between 14 and 19.5 m and maintains a steady increase in the level higher than the open-valve scheme. At this time, the flow pattern in the culvert has been significantly improved.
According to the analysis of the flow pattern behind the flap valve and the uniformity of the axial flow velocity at the outlet, when the opening angle reaches case 3 and case 4, the flow pattern at the outlet of the culvert pipe can achieve a better state.
4 Comprehensive Analysis
After the pump unit is started, the residual air in the pipeline will be quickly compressed. When the gas is compressed to a certain level, its pressure may exceed the water pressure outside the flap valves and push the flap valves open. When the flap valves are made available by the air pressure, a large amount of air quickly leaks out, causing the air pressure of the pipe to drop sharply. If there is more residual air in the tube, the above process will be repeated. Finally, after several repeated openings and closings, the lower flap valve will first be pushed open by the water. As the flow increases, the upper flap valve is also made open. At the same time, because of the flap valves, the water flow direction at the pipe outlet will change sharply. At this time, there must be a specific head loss. As the flow rate continues to increase, the opening angle of the flap valves will gradually increase. Under different opening angles, the hydraulic loss and flow pattern will be different. It will also have a particular impact on the flow pattern of the water flow behind the flap valves.
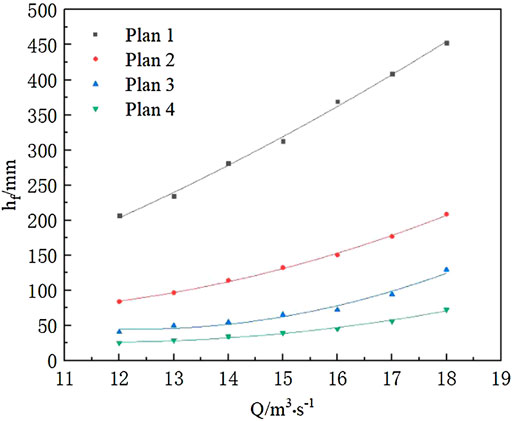
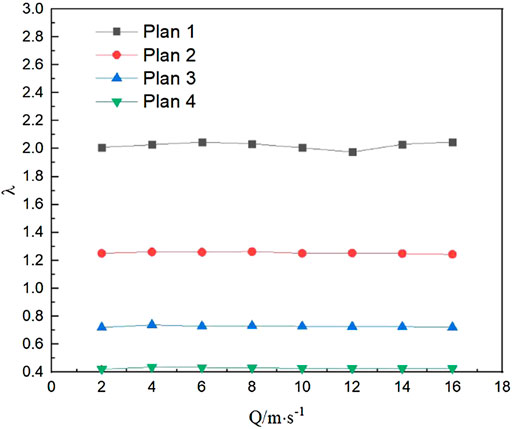
The physical model experiment is used to measure the head loss before and after the double-stage flap valves. The hydraulic loss of the outlet culvert pipe is calculated under eight different flow rates and four schemes of flap valve opening, and its patterns are analyzed. Hydraulic loss results of the culvert pipe under each case are shown in Figure 8. At the same time, the resistance coefficient λ of the pipeline under each scheme is calculated and the relationship between λ and the opening angle of the flap valve under each flow is analyzed, and the calculation results are shown in Figure 14.
According to the curve changes in Figure 13, the hydraulic loss at each flow rate of the four schemes decreases with the opening of the flap valve. Under the same flow rate, the hydraulic loss of the culvert pipe decreases when the opening angle of the flap valve increases. With the increase of opening angle, the rise of head loss caused by flow growth becomes smaller and smaller. Taking the design flow rate of 16 m³/s as an example, the hydraulic loss value of Scheme 1 is 0.353 m, while the hydraulic loss of case 4 is 0.035 m; the hydraulic losses decreased by 79.1%.
According to the result analysis in Figure 15, at the same opening angle, the resistance coefficient λ along the inner section of the culvert pipe has nothing to do with the change of flow rate. It is always stable around a value. However, as the opening angle increases, the drag coefficient decreases along the way, which means that the more the opening angle of the flap valve is, the smaller the resistance coefficient is and the less the hydraulic loss is.
According to the results, as the opening angle increases, the hydraulic loss in the culvert is significantly reduced. This also shows the better flow pattern of the water in the culvert. Therefore, the larger the opening angle of the flap valve is, the more favorable the flow pattern of the culvert pipe is.
5 Conclusion
Numerical simulation is used to analyze the flow pattern behind the double-stage flap valves from three aspects of streamline and velocity uniformity. The physical model test analyzes it from the hydraulic loss. It is found that the greater the opening of the double-stage flap valves, the more uniform the flow of water behind the flap valve and the better the flow pattern. Under the opening angle of double-stage flap valves corresponding to case 3 and case 4, compared with case 1 and case 2, the vortex area is significantly reduced, the flow pattern has been dramatically improved, water flows can be fully developed in culverts, and the uniformity index of flow velocity in the culvert is higher than that of the open-valve scheme. As a result, in order to ensure the flawless operation of the pump station, the impact on the water flow behind the flap valve is reduced, and it is recommended to make the maximum opening angle reached when the flap valve runs as large as possible.
This study focuses on the influence of the opening angle of double-stage flap valves on the water flow behind the flap valve. The relationship between the flow pattern after the valve and the opening angle of the flap valves is analyzed by numerical simulation analysis and the physical model test from the three aspects of streamline, uniformity of flow velocity, and hydraulic loss, and the following conclusions are obtained:
1) After the double-stage flap valves are opened, two axisymmetric reverse vortexes appear in the culvert section behind the flap valve. As the opening angle increases, the flow line in the culvert pipe after the gate gradually moves down and disappears in the high-velocity zone. The eddy dissipates at the outlet.
2) As the distance between water flow and the racket flap valve increases, the uniformity of flow velocity rises gradually. The water flow can be fully developed in the culvert. The uniformity index starts to be higher than the uniformity index without the door at a distance of about 35 m from the entrance.
3) The hydraulic loss coefficient of the culvert section has nothing to do with the volume of flow and is negatively correlated with the opening angle of the flap valve; the bigger the opening angle, the smaller the hydraulic loss coefficient of the culvert section and the smaller the head loss.
Data Availability Statement
The raw data supporting the conclusion of this article will be made available by the authors, without undue reservation.
Author Contributions
Conceptualization, WL and WX. Methodology, GF. Software, WX. Validation, WL, WX, and GF. Formal Analysis, WX. Investigation, WX. Resources, WX. Data Curation, WX. Writing—Original Draft Preparation, WX. Writing—Review and Editing, WX. Visualization, WX. Supervision, WX. Project Administration, WX. Funding Acquisition, WL. All authors have read and agreed to the published version of the manuscript.
Funding
This research was funded by the National Natural Science Foundation of China (51779215), the National Natural Science Foundation of China (52079120), the Jiangsu Graduate Research and Innovation Program (KYCX20_2980), and the Priority Academic Program Development of Jiangsu Higher Education Institutions (PAPD).
Conflict of Interest
The authors declare that the research was conducted in the absence of any commercial or financial relationships that could be construed as a potential conflict of interest.
Publisher’s Note
All claims expressed in this article are solely those of the authors and do not necessarily represent those of their affiliated organizations or those of the publisher, the editors, and the reviewers. Any product that may be evaluated in this article or claim that may be made by its manufacturer is not guaranteed or endorsed by the publisher.
References
Ahmed, F. (2000). Three-dimensional Mean Velocity Analysis of a 30 Degree bend Flow. J. Eng. Mech. 126126 (12), 126212–131272. doi:10.1061/(ASCE)0733-939910.1061/(asce)0733-9399(2000)126:12(1262)
Alawadhi, K., Alzuwayer, B., Mohammad, T. A., and Buhemdi, M. H. (2021). Design and Optimization of a Centrifugal Pump for Slurry Transport Using the Response Surface Method. Machines 9 (3), 60. doi:10.3390/machines9030060
Axell, L. B., and Liungman, O. (2001). A One-Equation Turbulence Model for Geophysical Applications: Comparison with Data and the K− ε Model. Environ. Fluid Mech. 1 (1), 71–106. doi:10.1023/A:1011560202388
Chen, B., Li, X., and Zhu, Z. (2022b). Investigations of Energy Distribution and Loss Characterization in a Centrifugal Impeller through PIV experiment. Ocean Engineering 247, 110773. doi:10.1016/j.oceaneng.2022.110773
Chen, B., Li, X., and Zhu, Z. (2022a). Time-Resolved Particle Image Velocimetry Measurements and Proper Orthogonal Decomposition Analysis of Unsteady Flow in a Centrifugal Impeller Passage. Front. Energ. Res. 9. doi:10.3389/fenrg.2021.818232
Gao, C., Gao, Y., and Sun, L. (2021). Research on Hydraulic Characteristics of Inlet Pipeline of Pumping Station Based on Standard K-ε Turbulence Model. J. Irrigation Drainage 40 (05), 44. doi:10.3390/w11010044
Hong, S., and Li, Z. (2015). Comparative Study on Hydraulic Characteristics of Flip-Up and Side Flip-Doors. South-to-North Water Diversion Water Conservancy Sci. Tech. 13 (02), 955. doi:10.13476/j.cnki.nsbdqk.2015.02.025
Hu, B., Wang, H., Liu, J., Zhu, Y., Wang, C., Ge, J., et al. (2022). A Numerical Study of a Submerged Water Jet Impinging on a Stationary Wall. J. Mar. Sci. Eng. 10 (2), 228. doi:10.3390/jmse10020228
Jafarzadeh, B., Hajari, A., Alishahi, M. M., and Akbari, M. H. (2011). The Flow Simulation of a Low-Specific-Speed High-Speed Centrifugal Pump. Appl. Math. Model. 35 (1), 242–249. doi:10.1016/j.apm.2010.05.021
Lu, Z., Tao, R., Jin, F., Li, P., Xiao, R., and Liu, W. (2021). The Temporal-Spatial Features of Pressure Pulsation in the Diffusers of a Large-Scale Vaned-Voluted Centrifugal Pump. Machines 9 (11), 266. doi:10.3390/machines9110266
Luo, H., Fytanidis, D. K., Schmidt, A. R., and García, M. H. (2018). Comparative 1D and 3D Numerical Investigation of Open-Channel junction Flows and Energy Losses. Adv. Water Resour. 117, 120–139. doi:10.1016/j.advwatres.2018.05.012
Nejadrajabali, J., Riasi, A., and Nourbakhsh, S. A. (2016). Flow Pattern Analysis and Performance Improvement of Regenerative Flow Pump Using Blade Geometry Modification. Int. J. Rotating Machinery 2016, 1–16. doi:10.1155/2016/8628467
Qian, Z., Wu, P., Guo, Z., and Huai, W. (2016). Numerical Simulation of Air Entrainment and Suppression in Pump Sump. Sci. China Technol. Sci. 59 (12), 1847–1855. doi:10.1007/s11431-016-0237-8
Shen, P., Wang, Y., Chen, Y., Fu, P., Zhou, L., and Liu, L. (2021). Hydrodynamic Bearing Structural Design of Blood Pump Based on Axial Passive Suspension Stability Analysis of Magnetic-Hydrodynamic Hybrid Suspension System. Machines 9 (11), 255. doi:10.3390/machines9110255
Shi, L., Zhu, J., Tang, F., and Wang, C. (2020). Multi-disciplinary Optimization Design of Axial-Flow Pump Impellers Based on the Approximation Model. Energies 13 (4), 779. doi:10.3390/en13040779
Shi, W., Desheng, Z., Xingfan, G., and Hongfei, L. (2010). Numerical and Experimental Investigation of High-Efficiency Axial-Flow Pump. Chin. J. Mech. Eng. 23 (1), 38–44. doi:10.3901/cjme.2010.01.038
Shin, B. (2018). Effect of Submergence and Flow Rate on Free Surface Vortices in a Pump Sump. Inter. J. Fluid Mech. Res. 45 (3), 225–236. doi:10.1615/interjfluidmechres.2018020379
Sudo, K., Sumida, M., and Hibara, H. (1998). Experimental Investigation on Turbulent Flow in a Circular-Sectioned 90-degree bend. Experiments in Fluids 25 (1), 42–49. doi:10.1007/s003480050206
Tang, S., Zhu, Y., and Yuan, S. (2022). Intelligent Fault Diagnosis of Hydraulic Piston Pump Based on Deep Learning and Bayesian Optimization [J]. ISA Trans. doi:10.1016/j.isatra.2022.01.013
Wang, H. L., Hu, Q. X., Yang, Y., and Wang, C. (2021). Performance Differences of Electrical Submersible Pump under Variable Speed Schemes. Int. J. Simul. Model. 20 (1), 76–86. doi:10.2507/IJSIMM20-1-544
Wang, H., Long, B., Wang, C., Han, C., and Li, L. (2020). Effects of the Impeller Blade with a Slot Structure on the Centrifugal Pump Performance. Energies 13 (7), 1628. doi:10.3390/en13071628
Xi, W., and Lu, W. G. (2021). Formation Mechanism of an Adherent VorteX in the Side Pump Sump of a Pumping Station. Int. J. Simul. Model. 20 (2), 327–338. doi:10.2507/IJSIMM20-2-562
Xi, W., Lu, W., Wang, C., and Xu, B. (2021). Optimization of the Hollow Rectification Sill in the Forebay of the Pump Station Based on the PSO-GP Collaborative Algorithm. Shock and Vibration 2021, 1–11. doi:10.1155/2021/6618280
Xu, D., and Zheng, H. (2013). Mesh independence Test of Numerical Manifold Method in Treating strong Singularity. Rock Soil Mech. 35 (8), 91–96. doi:10.1201/b15791-11
Xu, L., Lu, W.-g., Lu, L.-g., Dong, L., and Wang, Z.-f. (2014). Flow Patterns and Boundary Conditions for Inlet and Outlet Conduits of Large Pump System with Low Head. Appl. Math. Mech.-Engl. Ed. 35 (6), 675–688. doi:10.1007/s10483-014-1821-6
Yamade, Y., Kato, C., Nagahara, T., and Matsui, J. (2020). Suction Vortices in a Pump Sump-Their Origin, Formation, and Dynamics. J. Fluids Eng. 142 (3), 031110. doi:10.1115/1.4045953
Yan, H., Tan, F., Liu, C., Shi, L., Liu, H., Sun, Z., et al. (2020). Numerical Simulation of Hydraulic Performance of Horizontal Pumping Station with Straight-Pipe Outlet Flow Channel Profile Change. China Rural Water Resour. Hydropower 2020 (1), 188–191. doi:10.3969/j.issn.1007-2284.2020.01.038
Yang, F. Z. (2011). Numerical Simulation and experiment on Resistance Loss of Flap Gate. Trans. Chin. Soc. Agric. Machinery 42 (9), 108–112+44. doi:10.1002/clc.20818
Yu, Y., and Zhu, J. (2014). Improving the Shut-Off Performance of the Pumping Station's Pressure Water Tank Based on Numerical Experiments. China Rural Water and Hydropower 2014 (6), 125–128. doi:10.3969/j.issn.1007-2284.2014.06.029
Zeng, C., and Li, C. W. (2010). A Hybrid RANS-LES Model for Combining Flows in Open-Channel T-Junctions. J. Hydrodynamics 22 (1), 154–159. doi:10.1016/s1001-6058(09)60186-4
Zhang, D., Jiao, W., Cheng, L., Xia, C., Zhang, B., Luo, C., et al. (2021). Experimental Study on the Evolution Process of the Roof-Attached Vortex of the Closed Sump. Renew. Energ. 164, 1029–1038. doi:10.1016/j.renene.2020.10.045
Zhang, D., Wang, H., Liu, J., Wang, C., Ge, J., Zhu, Y., et al. (2022). Flow Characteristics of Oblique Submerged Impinging Jet at Various Impinging Heights [J]. J. Mar. Sci. Eng. 10 (3), 399. doi:10.3390/jmse10030399
Zhou, J., Zhao, M., Wang, C., and Gao, Z. (2021). Optimal Design of Diversion Piers of Lateral Intake Pumping Station Based on Orthogonal Test. Shock and Vibration 2021, 1–9. doi:10.1155/2021/6616456
Zhu, Y., Li, G., Tang, S., Wang, R., Su, H., and Wang, C. (2022). Acoustic Signal-Based Fault Detection of Hydraulic Piston Pump Using a Particle Swarm Optimization Enhancement CNN. Applied Acoustics 192, 108718. doi:10.1016/j.apacoust.2022.108718
Keywords: double-stage flap valves, flow analysis, numerical simulation, physical model experiment, flow velocity uniformity
Citation: Xi W, Lu W, Wang C and Fu G (2022) Numerical and Experimental Study on the Opening Angle of the Double-Stage Flap Valves in Pumping Stations. Front. Energy Res. 10:866044. doi: 10.3389/fenrg.2022.866044
Received: 30 January 2022; Accepted: 04 March 2022;
Published: 31 March 2022.
Edited by:
Xiaojun Li, Zhejiang Sci-Tech University, ChinaReviewed by:
Renqing Zhu, Jiangsu University of Science and Technology, ChinaLingling Wang, Hohai University, China
Copyright © 2022 Xi, Lu, Wang and Fu. This is an open-access article distributed under the terms of the Creative Commons Attribution License (CC BY). The use, distribution or reproduction in other forums is permitted, provided the original author(s) and the copyright owner(s) are credited and that the original publication in this journal is cited, in accordance with accepted academic practice. No use, distribution or reproduction is permitted which does not comply with these terms.
*Correspondence: Weigang Lu, d2dsdUB5enUuZWR1LmNu
 Wang Xi
 Weigang Lu1*
 Chuan Wang