- 1College of Energy and Power Engineering, Lanzhou University of Technology, Lanzhou, China
- 2Key Laboratory of Fluid Machinery and Systems of Gansu Province, Lanzhou University of Technology, Lanzhou, China
In this paper, the effect of adding non-connected forms of tiny blades with different parameters of radial position, width, and length to the shroud of the impeller on the cavitation performance of a centrifugal pump is researched. A modified SST k-ω turbulence model combined with the Zwart–Gerber–Belamri cavitation model is used for numerical simulation of the model pump. The results show that the numerical prediction of the original pump agrees well with the experimental results. Adding tiny blades with different radial positions, widths, and lengths has a small effect on the pump head and efficiency under each working condition. Adding tiny blades near the impeller inlet has better suppression of cavitation in the initial stage, and adding tiny blades in the middle and backward positions has a better suppression effect on all stages of cavitation. There is an optimal tiny blade width to make the cavitation suppression effect optimal, and the optimal width of the model in this study is 3/4 of that of the main blade. The effect of a tiny blade length on cavitation performance is small. The existence of tiny blades slightly increases the turbulent kinetic energy in the low-turbulent kinetic energy region near the impeller inlet, significantly reduces the turbulent kinetic energy in the high-turbulent kinetic energy region near the outlet, and reduces the overall pressure pulsation main frequency amplitude during pump operation, making its operation more stable.
1 Introduction
As fluid-transfer power equipment, centrifugal pumps are widely used in the national life and economic production and play an important role. Cavitation is a flow phenomenon that is difficult to avoid during the operation of centrifugal pumps. Its generation is due to the process of cavitation generation, development, and collapse when the local pressure in the liquid medium decreases to the critical pressure. Cavitation can interfere with the normal flow of the flow field. In serious cases, it will reduce the normal energy conversion inside the impeller (Brennen, 1994), accompanied by noise and vibration (Chudina, 2003; Li et al., 2018), which will reduce the hydraulic performance of the pump. Moreover, the bubble collapse process will produce an extremely high local pressure and temperature and high-speed microjets, which can cause erosion of the overflow components (Brujan and Matsumoto, 2012; Wijngaarden, 2016; Dular et al., 2019) and greatly reduce the service life of the pump. Therefore, the research of cavitation suppression in centrifugal pumps is a popular field.
Many scholars have done a lot of research work on centrifugal pump cavitation suppression. Luo et al. and Pei et al. (Luo et al., 2008; Pei et al., 2017) improved the hydraulic and cavitation performance of the pump by optimizing the geometric parameters of the impeller. Adding inducers to the impeller inlet (Acosta, 1958), inducing partial high-pressure fluid injection into the inlet from the pump outlet (Wong et al., 1965; Cui et al., 2019), etc., are methods to suppress cavitation by increasing the impeller inlet pressure. Zhao and Zhao, (2017) placed obstacles at suitable locations on the pressure surface of the blade to inhibit cavitation development. Wei et al. (Wei et al., 2021) improved the fluid dynamics at the inlet of centrifugal pumps by adding a deflector plate, which contributed to the suppression of cavitation instability in high-speed centrifugal pumps. Kurokawa, (2011) designed J-slots in the inlet section wall of centrifugal pumps with inducers to suppress various anomalous flow phenomena such as cavitation by controlling the angular momentum of the main flow. Zhao et al., (2020) studied the method of opening slits on the blade of a centrifugal pump, leading the fluid from the high-pressure region to the low-pressure region and effectively restraining the development of cavitation. (Zhu and Chen, 2012) added a small vice blade to the leading edge of the blade and improved the cavitation performance and hydraulic efficiency by taking advantage of the inflow characteristics and the automatic pressure balancing effect of the clearance channel. Slotting on the pressure side of the leading edge of the blades induces a relatively high pressure, which suppresses the growth of the bubble volume within the impeller (Zhao et al., 2018). A proper inlet diameter of the splitter blade can effectively avoid flow obstruction at the impeller inlet and vortex cavitation in the blade channel (Zhang et al., 2014).
Cavitation occurs at the location of the lowest pressure, usually slightly behind the suction surface of the blade inlet and close to the hub of the impeller (Guan, 2011). Therefore, in this paper, different schemes were designed successively and the effect of adding non-connected forms of tiny blades on the shroud of the impeller with different radial positions, widths, and length parameters on the cavitation performance of a centrifugal pump was investigated. Moreover, by the numerical simulation method, the changes of the bubble volume, flow field structure, turbulent kinetic energy distribution, pressure distribution, and the pressure pulsation amplitude of the main frequency in the impeller under different cavitation margins were compared and analyzed.
2 Numerical Methods
2.1 Governing Equations
The governing equations for fluid motion are the Reynolds averaged Navier–Stokes equations.
Continuity equation:
Momentum equation:
where ρm is the mixture density; t is the time; ui, uj, and uk are the velocity components; p is the local pressure; μ is the viscosity; μt is the turbulence viscosity; and δij is the Kronecker symbol.
Here, the mixture density ρm is defined as
where α is the volume fraction of one component. The subscripts v and l refer to the vapor and liquid components, respectively.
2.2 Turbulence Model
The SST k-ω turbulence model (Menter, 1994) was used to close the Reynolds-averaged Navier–Stokes equations. The SST k-ω turbulence model takes the k-ω model in the boundary layer region of the wall and the k-ε model in the region away from the boundary layer, which combines the advantages of both models and can predict flow separation on smooth surfaces more accurately
where Gk and Gω are the generating terms of turbulent kinetic energy k and dissipation rate ω, respectively; Γk and Γω are the effective diffusion coefficients of k and ω, respectively; Yk and Yω are the dissipations of k and ω, respectively; Sk and Sω are user-defined source phases; and Dω is the cross-diffusion term.
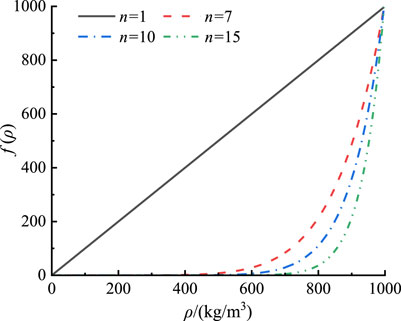
However, the uncorrected SST k-ω turbulence model will overpredict the viscosity of the two-phase mixture of vapor and liquid phases during cavitation, resulting in inaccurate prediction of bullbe shedding (Reboud and Dellanoy, 1994; Zheng et al., 2018). In this paper, a modified SST k-ω turbulence model is adopted to reduce the turbulent viscosity in order to capture the flow state of the cavitation flow more accurately. The turbulent viscosity in the region where cavitation occurs is reduced by modifying the density function f (ρm) as follows:
where n is taken as 10 (Coutier-Delgosha et al., 2003; Ji et al., 2014).
The variation curve of the f(ρm) function is shown in Figure 1. It can be seen from the figure that the corrected density is significantly reduced in the mixing region of the two-phase flow, thereby reducing the turbulent viscosity.
2.3 Cavitation Model
The Zwart–Gerber–Belamri cavitation model (Zwart et al., 2004) based on the Rayleigh–Plesset equation was used, neglecting the surface tension term and the second-order time derivative term, assuming a constant gas nucleus density in the fluid domain, and focusing on the effect of the change in the radius of the bubble during the initial generation and development of cavitation. It is suitable for calculating the transient characteristics of cloud cavitation within a centrifugal pump, and the equation is
where fv is the vapor-phase mass fraction, m+ is the evaporating phase, m− is the condensing phase, Fvap is the evaporation coefficient, Fcond is the condensation coefficient, Rb is the vacuole radius, αnuc is the volume fraction of cavitation nuclei, p is the flow field pressure, and pv is the saturated vapor pressure. Based on the experience of previous research (Zwart et al., 2004; Ji et al., 2013), Fvap = 50, Fcond = 0.01, Rb = 1 × 10⁻⁶ m, αnuc = 5 × 10⁻⁴, and saturated vapor pressure pv = 3169 Pa at 25°C.
3 Research Model and Preliminary Location Scheme Design
3.1 Research Model
In this paper, a low-specific speed centrifugal pump with a specific speed of ns = 32 was adopted as the research object, which mainly consists of five parts, such as the inlet section, impeller, volute, shroud, and hub. The rated head H0 = 4.2 m, the rated flow rate Q0 = 8.6 m3/h, and the rated speed n = 500 rpm. The main geometric parameters of the model pump are as follows: the inlet section diameter Dj = 107 mm, the impeller inlet diameter Di = 90 mm, the impeller outlet diameter D2 = 310 mm, the impeller outlet width b2 = 12 mm, the blade inlet diameter Db = 80 mm, the blade inlet angle β1 = 37°, the blade outlet angle β2 = 37°, blades are cylindrical blades, the blade number Z = 6, and the blade thickness δ = 4 mm, as shown in Figure 2A, where DX, L, W, and δ1 are the inlet diameter, length, width, and thickness of the tiny blades, respectively.

FIGURE 2. (A) Geometric model of the centrifugal pump. (B,C) Schematic diagram of geometric parameters such as length, inlet diameter, width, and thickness of tiny blades.
3.2 Preliminary Location Scheme Design
According to previous studies (Zhang et al., 2015), the design of splitting blades in the impeller of a centrifugal pump will have a certain suppression and optimization effect on cavitation but will have a greater impact on the hydraulic performance of the centrifugal pump. In order to minimize the influence on the external characteristics of the centrifugal pump and to reduce the disturbance of the flow in the impeller, the effect of arranging tiny blades of a non-connected form with different radial positions, widths, and length parameters on the inner surface of the shroud of the impeller on the cavitation performance is investigated. When the splitting blades are located in the middle of the flow channel, the pressure distribution of the flow channel of the impeller conforms to the general principle of the pressure distribution of the centrifugal pump, and the inlet diameter of the splitter blade has the greatest impact on the performance. Therefore, the middle position of the tiny blade should be determined first (He et al., 2006; Yuan et al., 2008). The shape of the tiny blade is the same as that of the corresponding position of the main blade. The length L of the tiny blade is 1/8 of the length of the main blade, and the width W and thickness δ1 of the tiny blade are 1/2 of the main blade. The number of the tiny blades is the same as the quantity of the main blade, and the inlet diameter of the tiny blade is Dx. First, five location schemes are designed, as shown in Table 1.
4 Grid Generation
ICEM CFD software was used to discretize the hexahedral structured mesh of the inlet section, impeller, front and rear cavities, and volute of the centrifugal pump model, as shown in Figure 3A, B. In order to improve the calculation accuracy, the grid was locally densified on the walls of each part of the model. The calculation domain of the Scheme A1 model was divided into four groups of grids with different numbers to verify the grid independence, which was used to exclude the influence of the number of grids on the error of the calculation results, as shown in Table 2. From the calculated results, it can be seen that the relative error of the head is within 1% as the number of meshes increases, and finally, the number of meshes of all calculated models is discrete into a number of meshes comparable to Mesh4 for simulation.
Since different turbulence models have different requirements on the grid density near the wall, in order to ensure that the grid density near the wall can accurately capture the flow in the boundary layer, it is necessary to analyze the Y+ value of the near wall. Y+ is defined as
where Δn is the distance between the two mesh nodes closest to the wall and τω is the wall shear stress.
In this study, the modified SST k-ω turbulence model is selected. The requirements of the k-ω model for the mesh quality of the near-wall region can be satisfied when Y+ is less than 100 (Li et al., 2012). The maximum Y+ value of the impeller models with small blades arranged is 15, as shown in Figure 3C.
5 Boundary Condition Setting
ANSYS CFX software was used for numerical simulation. The main boundary conditions are set as follows: pressure inlet and mass flow outlet. The impeller domain was set as the rotating domain, and the others were the static domains. The two outer surfaces of the hub and shroud were set as rotating wall surfaces, and the rest were isothermal and non-slip wall surfaces. In the steady calculation, the dynamic static interface was set to the frozen rotor. In the unsteady calculation, the dynamic static interface was set as the transient rotor stator. In the process of solving, the advection scheme adopted the high-resolution format, and the transient scheme adopted the second-order backward Euler difference format. The two-phase medium calculated by the simulation was water and water vapor at 25°C. The volume fractions of the liquid and vapor phases at the inlet were set to 1 and 0, respectively. The reference pressure of the calculation domain was 0 Pa, the saturated vapor pressure was 3,169 Pa, and the convergence accuracy was set to 1 × 10⁻⁵. In the simulation, cavitation occurs in the centrifugal pump by continuously reducing the inlet pressure. First, the steady calculation is carried out, and then, the steady calculation result is taken as the initial value for unsteady calculations. For unsteady calculations, the time step was taken as Δt = 0.001 s; that is, every 3° rotation of the impeller is a time step. Then, each time step was iteratively calculated 20 times, and finally, a convergence result was saved every 15° rotation. The total number of calculation steps was 600 steps, and the last calculation stable rotation period was selected for unsteady characteristic analysis.
6 Simulation Algorithm Verification and Preliminary Result Analysis
6.1 Simulation Algorithm Verification
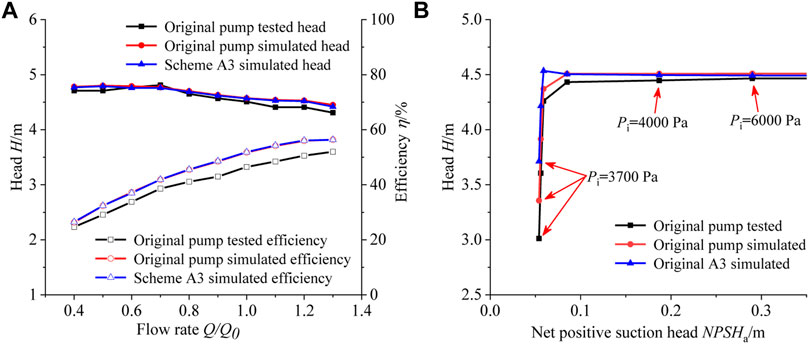
The external characteristics and cavitation performance tests of the original model centrifugal pump were completed on the visualized closed centrifugal pump test platform in the Key Laboratory of Fluid Machinery and Systems of Gansu Province, and the test system is shown in Figure 4. The medium of test is clear water at room temperature (25°C). The test is conducted in accordance with the national standard GB/T 3216-2016 “Hydraulic Performance Acceptance Test for Rotary Power Pumps Level 1, Level 2, and Level 3”. The tested curves of external characteristics and cavitation characteristics of the centrifugal pump are shown in Figure 5A,B, respectively. From Figure 5A, it can be seen that the simulated values of head and efficiency of the original pump under each flow rate condition are basically consistent with the trend of the experimental values. The maximum error between the simulated value of the original pump head and the experimental value occurs when Q/Q0 is 1.3, and the error is 3.25%. Also, the original pump efficiency simulation value is higher than the experimental value, and the maximum efficiency error is 5.68%. These errors are caused by measurement errors, manufacturing errors of the test pump, and insufficient consideration of wear-ring clearance and surface roughness in the simulation calculation model. It can be seen from Figure 5B that the simulated value of the original pump is slightly larger than the experimental value under different cavitation margins, and the simulated value is in close agreement with the experimental value. Therefore, the reasonableness and accuracy of the simulation algorithm for the hydraulic performance and cavitation performance of the centrifugal pump were verified.
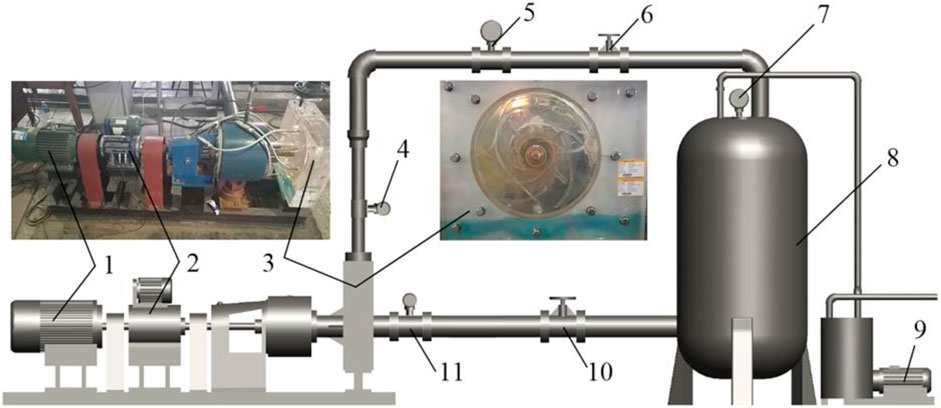
FIGURE 4. Sketch map of the centrifugal pump closed test bench (1, electric motor; 2, torque meter; 3, visual centrifugal pump; 4, outlet pressure sensor; 5, electromagnetic flow meter; 6, outlet valve; 7, vacuum gauge; 8, cavitation tank; 9, liquid ring vacuum pump; 10, inlet valve; 11, inlet pressure sensor).
6.2 Preliminary Location Scheme Results and Analysis
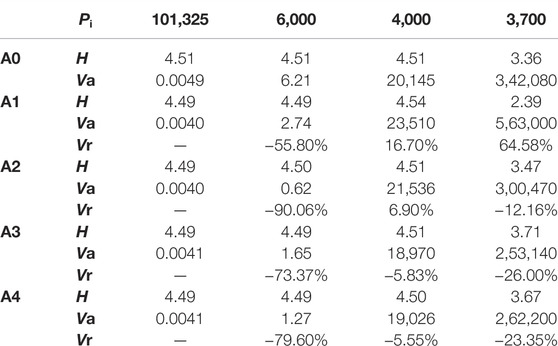
Numerical simulations of external characteristics and cavitation performance were carried out for the original pump model and four radial position scheme models at the design flow rate Q0, respectively, and the calculation results are shown in Table 3, where Pi is the centrifugal pump inlet pressure, Pa; H is the head, m; Va is the volume of cavitation in the impeller, mm³; and Vr is the percentage change in cavitation volume compared with the original impeller at the same inlet pressure. When the centrifugal pump inlet pressure Pi = 6,000 Pa (NPSHa = 0.290 m), it is the initial stage of cavitation; when Pi = 4,000 Pa (NPSHa = 0.085 m), it is the development stage of cavitation; and when Pi = 3,700 Pa (NPSHa = 0.054 m), it is the serious stage of cavitation.
From the data in Table 3, it can be seen that when the pump inlet pressure Pi = 101,325 Pa, the head H of schemes A1–A4 is slightly reduced compared with that of the original pump A0; when Pi = 6,000 Pa, the head H of schemes A1–A4 is slightly reduced compared with that of the original pump A0, but the bubble volume Va of schemes A1–A4 becomes smaller compared with that of A0, indicating that schemes A1–A4 all have the effect of cavitation suppression, the suppression effect is obvious, and the maximum reduction of cavitation volume of the A2 scheme was 90.06%; when Pi = 4,000 Pa, the H of schemes A1–A4 do not change much, but Va of schemes A1 and A2 increase slightly compared with that of A0, indicating that the cavitation development is promoted. Va of schemes A3 and A4 decreased compared with that of A0, indicating that the cavitation development is suppressed; when Pi = 3,700 Pa, H of scheme A1 decreased more compared with that of A0, and H the other three schemes were higher than that of A0. The bubble volume of scheme A1 was larger than that of scheme A0, and those of the other three schemes were all lower than that of scheme A0, indicating that A1 promotes cavitation at this time, while A2, A3, and A4 all inhibited the development of cavitation.
After comprehensive analysis, the cavitation volume in the impeller of scheme A3 was reduced at each selected inlet pressure point (cavitation incipient to cavitation severe stage), with a maximum reduction of 73.37%, and the head was the highest at the lowest inlet pressure point Pi = 3,700 Pa, which was 10.4% higher than that of the original pump. Compared with the simulated value of the external characteristics of the original pump, the hydraulic performance of scheme A3 at different operating points changes less, as shown in Figure 5A, and reduces the critical cavitation allowance point, as shown in Figure 5B. After comprehensive comparison, it can be concluded that A3 has the best comprehensive effect on cavitation suppression.
7 Further Width Scheme Design and Result Analysis
7.1 Width Scheme Design
The preliminary scheme studied the influence of the radial position parameters of the tiny blades on the cavitation performance and hydraulic performance, and numerical simulations were carried out at the design flow rate of Q0. The results showed that the radial position of the tiny blades of scheme A3 has the best comprehensive suppression effect on the cavitation of the centrifugal pump, and the influence on the hydraulic performance of the centrifugal pump is small. Next, based on the location of this scheme, the effect of the width parameter of the tiny blade on the cavitation performance and hydraulic performance of the centrifugal pump was studied. Five additional schemes with tiny blade widths are designed, in which the tiny blade thickness remains unchanged. W represents the tiny blade width, and b is the main blade width at the scheme A3 radial position. The design scheme is shown in Table 4.
7.2 Effect of Width Parameters on Performance
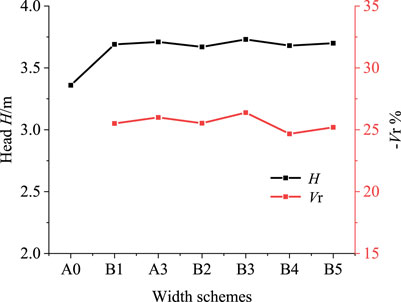
Figure 6 depicts the percentage reduction in head and bubble volume for different tiny blade width schemes at NPSHa = 0.054 m. It can be seen that compared with the original pump, the addition of different widths of tiny blades increased the head after breakage and reduced the volume of bubbles, and all schemes improved the cavitation performance of the centrifugal pump. With the gradual increase in the width of the tiny blade, the change trend of the percentage reduction in the volume of the bubble is consistent with the change trend of the head, showing a trend of first increase and then decrease. It can be seen that there is an optimal width parameter for the cavitation suppression effect. As far as scheme B3 (the tiny blade width is 3/4 of the width of the same radial position of the main blade) is concerned, its head is the highest, 3.73 m, 11% higher than that of the original pump, and the smallest volume of the bubble is 26.39% less than that of the original pump. Next, the optimal width of scheme B3 will be selected for analysis of the internal flow field.
7.3 Analysis of The Internal Flow Field of The Width Scheme
7.3.1 Vapor Volume Fraction Contour
Figure 7 shows the contour of the isosurface of the steam volume fraction (αv = 10%) in the impeller at different cavitation margins. Analysis of the figure shows that the bubbles first appear near the inlet of the impeller blades, and as the cavitation margin decreases, the volume of the bubbles gradually increases and spreads toward the outlet of the flow channel. The existence of bubbles seriously obstructs the normal flow in the flow channel. Compared with the original impeller, after adding tiny blades, when NPSHa = 0.290 m, the bubble volume in the impeller of scheme B3 decreased by 84.42%. When NPSHa = 0.085 m, the bubble volume in the B3 impeller decreased by 5.73%. When NPSHa = 0.054 m, the bubble volume in the B3 impeller was reduced by 26.39%. After adding the tiny blade, the bubble volume in the impeller under different cavitation margins is significantly reduced, which effectively suppresses the occurrence and development of cavitation and improves the cavitation performance of the centrifugal pump.
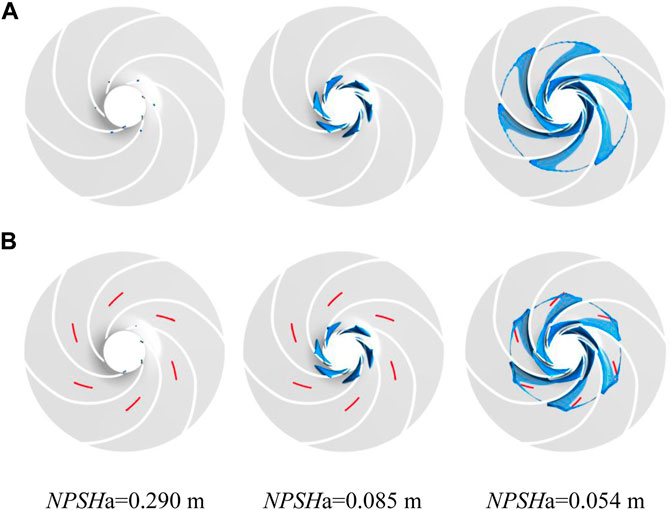
FIGURE 7. Vapor volume fraction distribution of the impeller: (A) original impeller and (B) B3 impeller.
7.3.2 Flow Field Structure
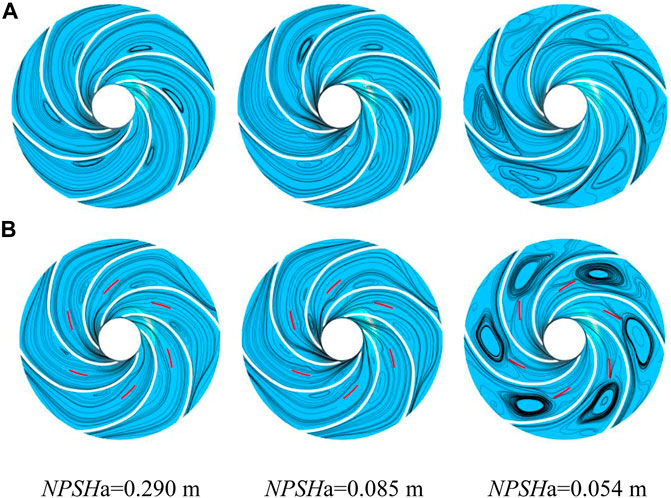
Figure 8 shows the flow distribution in the middle section of the impeller at different cavitation margins. Analysis of the figure shows that at each stage of cavitation, vortices are generated in each flow channel of the impeller, and the existence of vortices hinders the normal flow of the fluid, and as the cavitation margin decreases, the vortices move toward the outlet direction, the intensity and the scale of vortices increase, and the flow becomes more turbulent. After the shroud of the impeller increases the tiny blades, in the initial and development stages of cavitation, the vortex intensity is significantly reduced, the flow loss is reduced, and the existence of tiny blades plays a role in combing the flow field structure. However, in the cavitation severe stage, the tiny blades make the vortex intensity enhanced. This is because in the serious cavitation stage, there are many bubbles in the impeller, the two-phase flow is extremely complex, and the vortex is behind the tiny blade. The tiny blade does work on the fluid flowing through it, the fluid kinetic energy increases, the fluid with increased kinetic energy accelerates the rotation speed of the vortex when flowing through the edge of the vortex, and there is sudden diffusion of the channel after flowing through the small blade.
8 Final Length Parameter Scheme Design and Result Analysis
8.1 Length Parameter Scheme Design
The previous group of schemes studied the effect of the tiny blade width parameter on the cavitation performance and hydraulic performance of the centrifugal pump, and it was found that the tiny blades width of scheme B3 has the best effect on cavitation suppression and less effect on the hydraulic performance of the centrifugal pump. Next, with the tiny blade width (W = 3/4 b) of scheme B3 as the basis, we continued to control the tiny blade inlet diameter constant for a deeper study and to study the influence of tiny blade length parameters on the performance of centrifugal pumps and design as shown in Table 5, with three groups of length schemes for research, where L represents the length of the tiny blades and l represents the length of the main blade.
8.2 Effect of Length Parameters on Performance
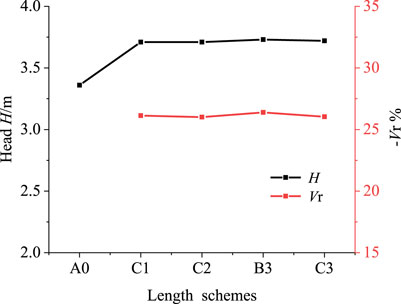
Figure 9 depicts the head and cavitation volume reduction percentages for different tiny blade length schemes at NPSHa = 0.054 m. From the figure, it can be seen that under different cavitation margins, compared with the original pump A0 scheme, with the length change of the tiny blades, their hydraulic performance changes less and the cavitation suppression effect is similar to that of scheme B3, indicating that the length parameter of the tiny blades has less influence on the cavitation performance. Since scheme C1 has the shortest length of 5 mm but the hydraulic performance and cavitation performance are also better in all stages of cavitation, scheme C1 is chosen next for impeller internal flow field analysis.
8.3 Analysis of the Internal Flow Field of the Width Scheme
8.3.1 Bubble Volume Analysis
The bubble volume, Vcav, is defined as
where N is the total number of control units in the impeller; αv,i is the volume fraction of the vapor phase in control unit i; and Vi is the volume of control unit i.
Figure 10 shows the variation of the bubble volume inside the impeller at the last rotation cycle at different cavitation margins. The results show that at the initial stage of cavitation, the bubble volume curve fluctuates up and down with time, showing a clear unsteady characteristic. However, as the cavitation margin decreases, the bubble volume in the impeller increases, and the bubble volume continues to fluctuate with the rotation of the impeller, but the fluctuation is relatively small. Scheme C1 shows a significant decrease in the volume of the bubble in the impeller compared with the original impeller at the same cavitation margins. At the initial stage of cavitation with a cavitation margin of NPSHa = 0.290 m, the average volume of bubbles in the original impeller and scheme C1 impeller during the rotation cycle was 6.21 and 0.98 mm3, respectively, and the volume of bubbles in the C1 impeller was reduced by 84.15%; at the stage of cavitation development with a cavitation margin of NPSHa = 0.085 m, the volume of bubbles in the original impeller and C1 impeller during the rotation cycle was 20,145 mm3 and 18,791 mm3, respectively, and the C1 bubble volume was reduced by 6.72%; at the cavitation severe stage NPSHa = 0.054 m, the bubble volumes of the original impeller and C1 impeller during the rotation cycle were 3,42,080 and 2,52,360 mm3, respectively, and the C1 bubble volume was reduced by 26.23%. It can be found that the tiny-blade scheme is particularly effective in suppressing cavitation during the initial and severe stages of cavitation.
8.3.2 Turbulent Kinetic Energy Distribution
Figure 11 shows the distribution of turbulent kinetic energy in the middle section of the impeller. The magnitude of the turbulent kinetic energy represents the turbulent intensity. As shown in Figures 7, 11, at the initial and developing stages of cavitation, cavitation is mainly generated near the inlet of the impeller. The arrangement of tiny blades can increase the turbulent energy near the inlet, and in the low-turbulent kinetic energy region, which also increases its turbulent intensity, the increased turbulent energy is still small. Moreover, the turbulent flow has the characteristics of pressure and velocity pulsation as well as the characteristics of high momentum and fast transfer, thus suppressing the initial and developmental stages of cavitation. When the cavitation develops to the severe stage, the turbulent kinetic energy on the pressure surface of the main blade in front of the tiny blade increases slightly, and the high-turbulent kinetic energy area behind the tiny blade near the outlet position decreases significantly. The turbulent dissipation loss decreases, and the hydraulic performance improves, as shown in Figure 10, when NPSHa = 0.054 m.
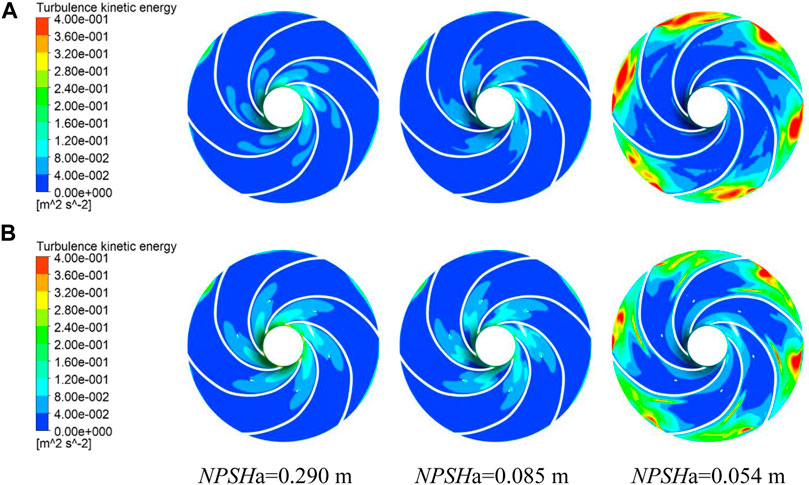
FIGURE 11. Turbulent kinetic energy distribution in the middle section of the impeller: (A) original impeller and (B) B3 impeller.
8.3.3 Flow Field Structure
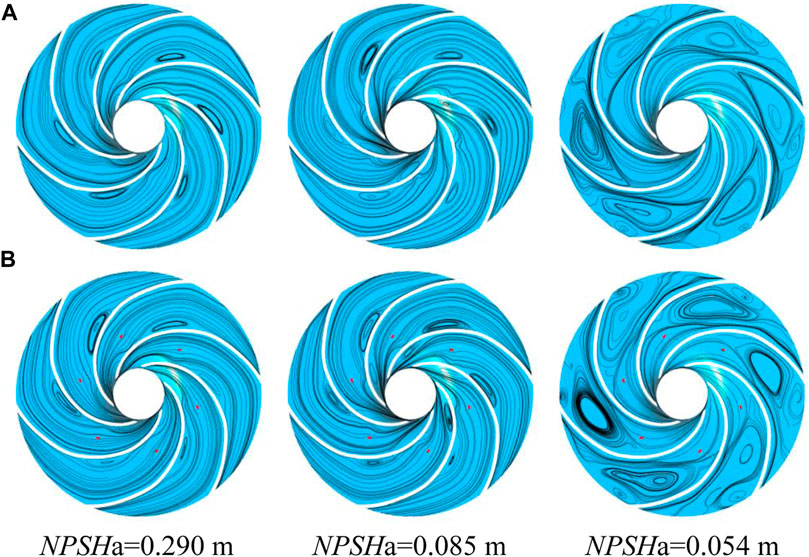
Figure 12 depicts the streamline distribution in the middle section of the impeller at different cavitation margins. It can be seen from Figures 8, 12 that the longer tiny blades of scheme B3 weaken the strength and scale of the vortices in the flow channel during the cavitation initial and development stages. However, after the shortening of the tiny blade, compared with the original impeller, the length of the tiny blade of scheme C1 is only 5 mm, and its ability to confine and comb the fluid is weakened, so the intensity and scale of the vortex in the impeller of scheme C1 have less change compared with the original impeller but have a slight tendency to enhance, indicating that the shorter tiny blade has a certain disturbing effect on the flow field structure, especially near the blade inlet. However, it can be seen from Figure 10 that the shorter, tiny blade scheme C1 still significantly reduces the volume of cavitation in the impeller. In the severe cavitation stage, the vortex intensity in the impeller is significantly weaker in scheme C1 compared to the flow field structure of scheme B3 but slightly enhanced compared to the original impeller flow field structure. This is due to the reduced work capacity of the flowing fluid after the shortening of the small blades; the kinetic energy obtained by the flowing fluid is reduced, and the vortex promotion effect is relatively weaker.
8.3.4 Pressure Distribution
Figure 13 shows the absolute pressure contour distribution in the middle section of the impeller. The cavitation in the impeller is caused by the pressure at the location of the cavitation falling below the saturated vapor pressure. With the development of cavitation, the low-pressure area in the impeller first appears at the inlet of the impeller, so the bubble also first appears at the inlet of the blade. With the cavitation margin reduced, the low-pressure area spreads from the inlet of the blade to the outlet, and the cavitation also spreads from the inlet to the outlet. The distribution change of the bubble volume fraction is consistent with the distribution change of the low-pressure area, as shown in Figures 7, 13. After cavitation occurs, with the gradual reduction of the cavitation margin, the existence of tiny blades induces the relative high pressure near the impeller inlet. The pressure change is an important factor in inhibiting the diffusion of low-pressure areas in the impeller to the outlet, which in turn suppresses the expansion of the volume of the bubble. As shown in Figure 13, when NPSHa = 0.054 m, it can also be seen that the pressure gradient near the impeller outlet is larger, and the head after breaking is also higher, which improves the hydraulic performance during cavitation.
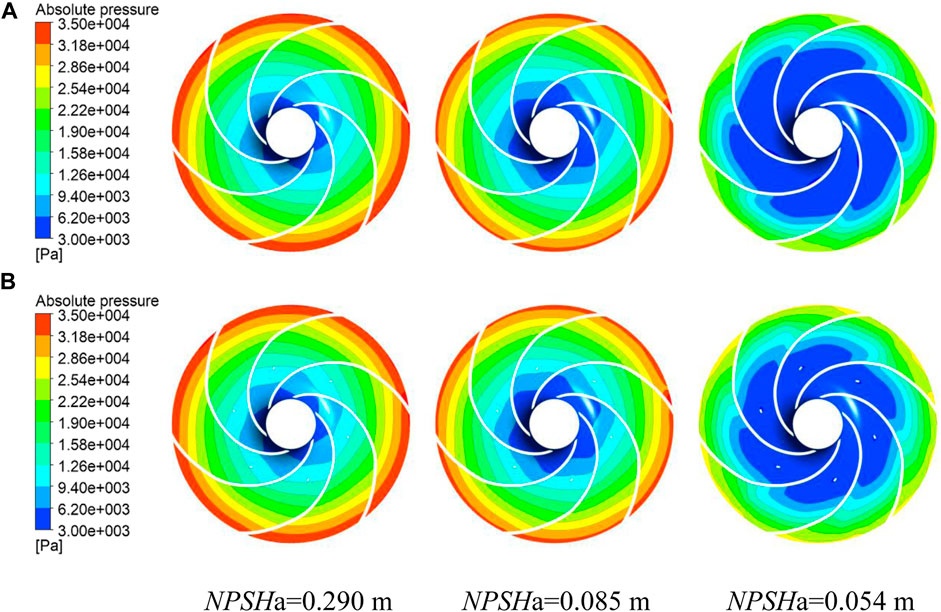
FIGURE 13. Pressure distribution in the middle section of the impeller: (A) original impeller and (B) B3 impeller.
8.3.5 Pulsation Amplitude Analysis
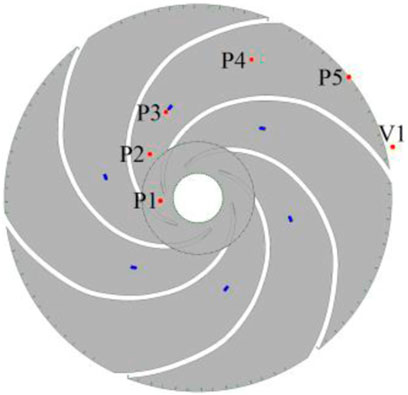
In order to better analyze the transient frequency characteristics of the flow field, six absolute pressure-monitoring points, such as P1-P5 and V1, are set in the middle of the impeller flow channel and at the position of the volute, as shown in Figure 14.
Figure 15 depicts the main frequency amplitude of pressure pulsation obtained by a fast Fourier transform (FFT) of the absolute pressure at each monitoring point, and A is the main frequency amplitude. From Figure 15, it can be obtained that at each stage of cavitation, compared with the original impeller, the C1 impeller has a decreasing trend in the amplitude of pressure pulsation at all monitoring points, except for a slight increase in pressure pulsation at two points, P1 and P2, near the inlet, which is consistent with the results of the turbulence energy analysis in Figure 11. This indicates that the existence of the tiny blades will indeed produce a small disturbance to its front impeller inlet position and produce an optimization effect on the flow field behind it. In general, the addition of tiny blades can reduce the overall pressure pulsation in the pump, which then also reduces the noise and vibration generated by the operation of the centrifugal pump.
9 Conclusion
In this study, the effects of adding non-connected tiny blades with different radial positions, widths, and length parameters to the shroud of a low-specific speed centrifugal pump impeller on the cavitation performance were investigated by combining numerical simulation and experiments, and the cavitation volume, flow field structure, turbulence energy, pressure distribution, and pressure pulsation amplitude were comparatively analyzed. On the basis of comparison and analysis, the conclusions are as follows:
1) Compared with the original pump, after adding tiny blades with different radial positions, widths, and lengths to the shroud of the impeller, the effect on the head and efficiency of the centrifugal pump under each working condition is small, and the relative change rate is within ±1.0%. Adding tiny blades near the inlet of the shroud of the impeller has a suppressive effect on the initial stage of cavitation and a facilitating effect on the development and severe stages of cavitation. The addition of tiny blades in the middle and backward positions of the impeller radius produced inhibitory effects in all stages of cavitation, especially in the initial and severe stages of cavitation.
2) There is an optimal width of the tiny blade to achieve the best cavitation suppression effect, and when the width of the tiny blade is equal to 3/4 of the width of the main blade, the cavitation performance of the centrifugal pump is optimal. The tiny blade length parameter has little effect on the cavitation performance.
3) The tiny blades slightly increase the turbulent energy near the blade inlet, inducing a relatively high pressure near the inlet and reducing the turbulent energy in the high-turbulent energy region near the impeller outlet. At the same time, it reduces the overall pressure pulsation in the pump, which in turn reduces noise and vibration and makes its cavitation operation more stable.
Data Availability Statement
The original contributions presented in the study are included in the article/Supplementary Material, further inquiries can be directed to the corresponding author.
Author Contributions
ZZ completed the writing, the experiment part and the data processing. WZ provided theoretical guidance and shared in writing, and revising the paper.
Funding
This work was supported by the National Natural Science Foundation of China (No. 52169018) and the Industrial Support Plan Project of Gansu Provincial Education Department (2021CYZC-27).
Conflict of Interest
The authors declare that the research was conducted in the absence of any commercial or financial relationships that could be construed as a potential conflict of interest.
Publisher’s Note
All claims expressed in this article are solely those of the authors and do not necessarily represent those of their affiliated organizations or those of the publisher, the editors, and the reviewers. Any product that may be evaluated in this article or claim that may be made by its manufacturer is not guaranteed or endorsed by the publisher.
References
Acosta, A. J. (1958). “An Experimental Study of Cavitating Inducers,” in Second Symposium on Naval Hydrodynamics: Hydrodynamic Noise Cavity Flow (Washington, D.C.: Office of Naval Research - Department of the Navy), 533–557.
Brujan, E.-A., and Matsumoto, Y. (2012). Collapse of Micrometer-Sized Cavitation Bubbles Near a Rigid Boundary. Microfluid Nanofluid 13, 957–966. doi:10.1007/s10404-012-1015-6
Chudina, M. (2003). Noise as an Indicator of Cavitation in a Centrifugal Pump. Acoust. Phys. 49 (4), 463–474. doi:10.1134/1.1591303
Coutier-Delgosha, O., Fortes-Patella, R., and Reboud, J. L. (2003). Evaluation of the Turbulence Model Influence on the Numerical Simulations of Unsteady Cavitation. J. Fluids Eng. 125 (1), 38–45. doi:10.1115/1.1524584
Cui, B., Zhu, K., Zhang, Y., and Lin, P. (2019). Experimental and Numerical Study of the Performance and Cavitation Flow of Centrifugal Pump with Jetting Device. J. Mech. Sci. Technol. 33 (10), 4843–4853. doi:10.1007/s12206-019-0925-6
Dular, M., Požar, T., Zevnik, J., and Petkovšek, R. (2019). High Speed Observation of Damage Created by a Collapse of a Single Cavitation Bubble. Wear 418-419, 13–23. doi:10.1016/j.wear.2018.11.004
He, Y., Yuan, S., Guo, X., Yuan, J., Chong, X., and Huang, L. (2006). Numerical Simulation for 3-D Incompressible Turbulent Flow in the Impeller with Splitting Vanes of Centrifugal Pump. Chin. J. Mech. Eng. 40 (11), 153–157. doi:10.3901/JME.2004.11.153
Ji, B., Luo, X., Arndt, R. E. A., and Wu, Y. (2014). Numerical Simulation of Three Dimensional Cavitation Shedding Dynamics with Special Emphasis on Cavitation-Vortex Interaction. Ocean Eng. 87, 64–77. doi:10.1016/j.oceaneng.2014.05.005
Ji, B., Luo, X., Wu, Y., Peng, X., and Duan, Y. (2013). Numerical Analysis of Unsteady Cavitating Turbulent Flow and Shedding Horse-Shoe Vortex Structure Around a Twisted Hydrofoil. Int. J. Multiphase Flow 51, 33–43. doi:10.1016/j.ijmultiphaseflow.2012.11.008
Kurokawa, J. (2011). J-Groove Technique for Suppressing Various Anomalous Flow Phenomena in Turbomachines. Int. J. Fluid Machinery Syst. 4 (1), 1–13. doi:10.5293/ijfms.2011.4.1.001
Li, X., Yuan, S., Pan, Z., Li, Y., and Yang, J. (2012). Realization and Application Evaluation of Near-Wall Mesh in Centrifugal Pumps. Trans. Chin. Soc. Agric. Eng. 28 (20), 67–72. doi:10.3969/j.issn.1002-6819.2012.20.009
Li, Y., Feng, G., Li, X., Si, Q., and Zhu, Z. (2018). An Experimental Study on the Cavitation Vibration Characteristics of a Centrifugal Pump at normal Flow Rate. J. Mech. Sci. Technol. 32 (10), 4711–4720. doi:10.1007/s12206-018-0918-x
Luo, X., Zhang, Y., Peng, J., Xu, H., and Yu, W. (2008). Impeller Inlet Geometry Effect on Performance Improvement for Centrifugal Pumps. J. Mech. Sci. Technol. 22 (10), 1971–1976. doi:10.1007/s12206-008-0741-x
Menter, F. R. (1994). Two-Equation Eddy-Viscosity Turbulence Models for Engineering Applications. AIAA J. 32 (8), 1598–1605. doi:10.2514/3.12149
Pei, J., Yin, T., Yuan, S., Wang, W., and Wang, J. (2017). Cavitation Optimization for a Centrifugal Pump Impeller by Using Orthogonal Design of experiment. Chin. J. Mech. Eng. 30 (1), 103–109. doi:10.3901/CJME.2016.1024.125
Reboud, J. L., and Dellanoy, Y. (1994). “Two-Phase Flow Modelling of Unsteady Cavitation,” in Proc. Second Intl Symp. on Cavitation, Tokyo, Japan, 39–44.
Wei, Z., Tao, R., Xiao, R., and Hu, H. (2021). Hydrodynamic Improvement by Adding Inlet Baffles on Centrifugal Pump for Reducing Cavitation Instabilities. J. Vibration Control., 1–12. doi:10.1177/10775463211047401
Wijngaarden, L. (2016). Mechanics of Collapsing Cavitation Bubbles. Ultrason. Sonochem. 29, 524–527. doi:10.1016/j.ultsonch.2015.04.006
Wong, G. S., Macgregor, C. A., and Hoshide, R. K. (1965). Suppression of Cavitation and Unstable Flow in Throttled Turbopumps. J. Spacecraft Rockets 2 (1), 73–80. doi:10.2514/3.28124
Yuan, S. Q., Zhang, J. F., Yuan, J. P., and Fu, Y. D. (2008). Orthogonal Experimental Study Effect of Main Geometry Factors of Splitter Blades on Pump Performance. J. Drainage Irrigation Machinery 26 (2), 1–5. doi:10.3969/j.issn.1674-8530.2008.02.001
Zhang, Y. L., Yuan, S. Q., Zhang, J. F., Feng, Y. N., and Lu, J. X. (2014). Numerical Investigation of the Effects of Splitter Blades on the Cavitation Performance of a Centrifugal Pump. IOP Conf. Ser. Earth Environ. Sci. 22 (5), 052003. doi:10.1088/1755-1315/22/5/052003
Zhang, Y., Yuan, S., Zhang, J. F., Peng, Y., and Mao, J. (2015). Numerical Analysis on Effects of Splitter Blades on Cavitation Performance in a Centrifugal Pump. J. Drainage Irrigation Machinery Eng. 33 (10), 846–852. doi:10.3969/j.issn.1674-8530.14.0142
Zhao, W. G., Lu, J. J., and Zhao, F. R. (2020). Cavitation Control of Centrifugal Pump Based on gap Jet Principle. J. ZheJiang Univ. (Engineering Science) 54 (9), 1785–1794. doi:10.3785/j.issn.1008-973X.2020.09.015
Zhao, W. G., Zhai, L. J., Xia, T., and Li, S. S. (2018). Numerical Simulation of Slotted Blade in Centrifugal Pump on Cavitation Suppression. Trans. Chin. Soc. Agric. Mach 49, 157–164. doi:10.6041/j.issn.1000-1298.2018.12.019
Zhao, W., and Zhao, G. (2017). An Active Method to Control Cavitation in a Centrifugal Pump by Obstacles. Adv. Mech. Eng. 9 (11), 168781401773294. doi:10.1177/1687814017732940
Zheng, X. B., Liu, L. L., Guo, P. C., and Hong, F. (2018). Numerical Investigation of Three-Dimensional Cavitating Performance of NACA66 Hydrofoil Base on Different Cavitation Models. Chin. J. Hydrodynamics 33 (2), 199–206. doi:10.16076/j.cnki.cjhd.2018.02.008
Zhu, B., and Chen, H.-x. (2012). Cavitating Suppression of Low Specific Speed Centrifugal Pump with gap Drainage Blades. J. Hydrodyn 24 (5), 729–736. doi:10.1016/S1001-6058(11)60297-7
Keywords: centrifugal pump, low specific speed, cavitation suppression, tiny blades, geometric parameters, the shroud of the impeller, numerical simulation
Citation: Zhao W and Zhou Z (2022) Influence of Geometric Parameters of Tiny Blades on the Shroud of a Centrifugal Pump on the Cavitation Suppression Effect. Front. Energy Res. 10:865885. doi: 10.3389/fenrg.2022.865885
Received: 30 January 2022; Accepted: 28 February 2022;
Published: 08 April 2022.
Edited by:
Ling Zhou, Jiangsu University, ChinaReviewed by:
Florent Ravelet, Arts et Metiers Institute of Technology, FranceAlin Bosioc, Politehnica University of Timișoara, Romania
Copyright © 2022 Zhao and Zhou. This is an open-access article distributed under the terms of the Creative Commons Attribution License (CC BY). The use, distribution or reproduction in other forums is permitted, provided the original author(s) and the copyright owner(s) are credited and that the original publication in this journal is cited, in accordance with accepted academic practice. No use, distribution or reproduction is permitted which does not comply with these terms.
*Correspondence: Weiguo Zhao, emhhb3dnQHpqdS5lZHUuY24=
 Weiguo Zhao
 Zhongliang Zhou