 Prince Waqas Khan
 Yung-Cheol Byun
 Sang-Joon Lee
94% of researchers rate our articles as excellent or good
Learn more about the work of our research integrity team to safeguard the quality of each article we publish.
Find out more
ORIGINAL RESEARCH article
Front. Energy Res. , 27 April 2022
Sec. Solar Energy
Volume 10 - 2022 | https://doi.org/10.3389/fenrg.2022.865413
Renewable energy sources produce electricity without causing increment in pollution, and solar energy is one of the primary renewable sources. Switching to renewable electricity is particularly impactful for companies whose emissions from purchased energy are the primary source. The Renewable Energy (RE100) initiative provides awareness to governments and the general public. Therefore, organizations must now move from renewable energy sources to clean energy sources. Solar panels are the primary source of renewable energy. However, a harsh environment or solar panel malfunction can lead to missing data, which causes various problems, such as data processing complexity, severe biases, and commitment to data quality. Optimal orientation and tilt angle for solar panels effectively get more energy from the solar panels. We have used machine learning to predict the optimal angle for a solar panel according to the season and time. This article studies solar panel data’s photovoltaic energy generation value and proposes a machine learning model based on the stacking ensemble learning technique. Three ML models, including catboost, XGboost, and random forest, are ensebmled. Experimental data are obtained by setting up sixteen solar panels with different combinations of tilt and direction. The performance of the proposed method is compared with other ML and statistical models. We obtained a regression score (R2) of 0.86 and a mean absolute percentage error (MAPE) of 2.54%.
Energy is the material basis for human survival and an essential source for the sustainable development of the economy. Green energy can provide abundant clean energy to meet growing energy needs and play a key role in addressing some of the world’s environmental and energy challenges. Climate change is becoming increasingly important for governments and municipalities, with sustainable development and renewable energy attracting global attention (Wu et al., 2021). One challenge in achieving the vision is the low reliability of some renewable resources. Business in the commercial and industrial sectors accounts for half of global electricity consumption. Many organizations are trying to turn this demand into renewable electricity. The Renewable Energy (RE100) initiative aims to shift to 100% renewable electricity. Commercial and industrial companies use a large amount of electricity. RE100 wants these companies to the switching from fossil fuel electricity to renewable energy (Scott, 2020). The RE100 facilitates direct investment in renewable energy projects on and off-site. RE100 provides awareness to governments and the general public. Therefore, organizations must now move from non-renewable energy sources to renewable energy sources. The most widely used source is solar energy. Photovoltaic (PV) technology is a clean and sustainable use of energy. The global solar market has increased over the past decade with a growth rate of 50% (Connolly et al., 2010). However, due to its shortcomings, solar power generation is not easily applied to the power grid, leading to severe neglect in some areas. Due to the lack of access to weather data or the small size of the facility in many parts of the world, the designer or user of the solar collector has easy access to mathematical models to determine maximum familiarity. In recent years, extensive research has been conducted to gain in-depth knowledge of solar radiation worldwide to make freely available energy a viable alternative source. In addition to data provided by weather stations, simulation studies based on solar longitude models and artificial neural networks (ANN) have been instrumental in enabling the optimal design of solar thermal systems. Renewable energy generated without causing pollution becomes indispensable. Many countries will regulate the energy generation system that emits carbon in less than 10 years to prevent climate anomalies due to global warming (Orlov et al., 2020). A solar panel system is one of the renewable energy systems which is recommended in virtue of easy installation and management of panels at a low-cost (Kaaya et al., 2019). Some values might be missed in the data from solar panels due to the characteristics of solar panels, harsh environments, or malfunction of other devices (Xenophontos and Bazzi, 2017). Solar cells are devices that convert sunlight into electricity using semiconductor materials (Babu et al., 2017). Energy forecasting depends upon a large number of factors such as weather, holidays, location, and temperature (Khan and Byun, 2021; Khan et al., 2021). Electricity demand varies on public holidays compared to other days, hence considering holidays as a feature with energy prediction offers a significant and practical advantage. At the 2014 Global Energy Forecasting Competition (GEFCom 2014), participants could also use information about United States’ federal holidays (Haben and Giasemidis, 2016). Solar panels are widely used as an alternative to non-renewable energy sources. The direction and tilt angle of a solar panel are essential parameters that influence the system’s output and thus have been applied to solar thermal panels. Machine learning, a rapidly adopted area, can be utilized to solve this issue. Usually, solar panels are not easy to install, and once they are installed, they will generate energy according to the Sun rays received. Hence, obtaining optimal tilt and direction using machine learning before installing solar panels can be helpful to obtain maximum energy. There is a research gap to identify and utilize advanced machine learning algorithms to obtain better prediction accuracy. This study involves utilizing a stacking ensemble-based machine learning model to predict solar panel installation’s tilt angle and direction accurately.
A tilt and direction prediction model utilizing state-of-the-art machine learning algorithms is proposed in this article. The experiments for the forecasting model are performed on the actual data set obtained from the experimental site. A hybrid supervised machine learning method is proposed. The stacked ensemble model consists of two layers. Layer 0 consists of Xgboost and catboost models. Layer one consists of a random forest model. It gives better performance as compared to these individual models. To obtain the experimental data, Sixteen solar panels were set up with different combinations of tilt and direction in Jeju island, South Korea. Figure 1 shows the aerial view of the experimental site. Figure 2 shows the 16 solar panels with different tilt and direction combinations. The significant contributions of these articles are.
• obtaining data from setting up 16 solar panels site with different Tilt and direction combinations;
• presenting a tilt and direction prediction technique for solar panels;
• presenting a stacking ensemble learning technique based on Xgboost, catboost, and random forest models;
• comparing the proposed model with different prediction algorithms.
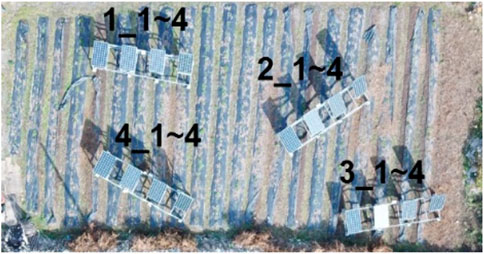
FIGURE 1. Aerial view of experimental site.
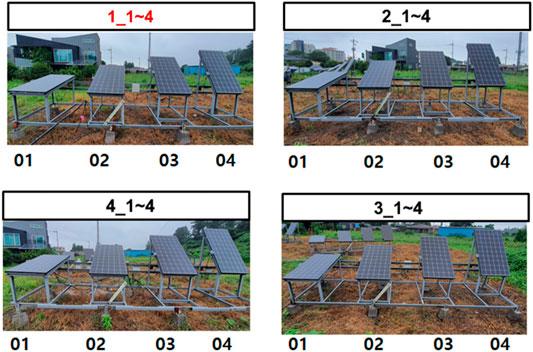
FIGURE 2. 16 Solar panels with different Tilt and Direction combinations.
The rest of the article is organized as follows: In Section 2, relevant publications, studies, and materials are reviewed and discussed. In Section 3, the process of data curation and summary of data is presented. Dataset is also examined in this section. Section 4 describes the suggested stacking ensemble, process flow, architecture, preprocessing, and data smoothing. In Part 5, performance results of the recommended model with test and train data are provided, and the analysis of the proposed method is discussed in Section 6. We also analyze our results with the other existing models. We conclude our work of this paper and provide directions for future research in the last section.
Finding the optimal angle of inclination of the panel for the Solar System is a critical problem, as it effectively converts sunlight into energy. Several studies have used different research methods to find the angle of inclination that increases solar panels’ output. However, recent studies have observed that conversion effectiveness depends not only on the radiation volume received. Kim et al. (Kim et al., 2020) proposed a photovoltaic panel slope optimization model using machine learning algorithms. Preferably than maximizing the received radiation, the goal is to find the angle of inclination that maximizes the converted power of the Solar System. Using the best predictive model, their model improved PV output compared to the optimal angular model.
Meng et al. (Meng et al., 2021) introduced a new intelligent hybrid model for accurate forecast and modeling of solar power plants. The proposed wavelet transform package and the generated conflicting grids. They publish a wavelet transformation to analyze the solar signal into sub-harmonic and then perform a statistical function selection analysis. They propose the GAN model, an in-depth approach, to find out each sub-frequency and quickly predict the future of solar energy. Due to the high complexity of the solar data, evolutionary algorithms based on the Dragonfly algorithm at training time can train generative and discriminative networks in GANs. They studied the proposed model’s appropriate efficiency and performance and compared it with the most successful models at different scales for different forecast periods. The simulation results show a more accurate implementation of the proposed predictive deep learning and the optimal performance of the modified DA compared to other algorithms described in the results.
Chinchilla et al.(Chinchilla et al., 2021) provided research on various models to precisely determine the best annual tilt angle for a stationary solar or solar collector anywhere in the world. Therefore, the best tilt angle that increases the yearly power output can be easily calculated without the need for weather data and simulation software. The recommended model is computed using global horizontal radiation data collected from websites worldwide. Existing sub-models were selected to estimate the hourly radiation of potential slopes and the corresponding annual energy production in this process. After determining the optimal angle for each site, they developed a mathematical model to estimate the yearly ideal angle as a function of latitude by regression analysis. They also compared regression methods such as neural networks and decision trees with polynomial models. The results are analyzed, validated, and compared with previous research designs that show the best production of the proposed model.
To maximize the energy captured from the Solar System, Abdeen et al. (Abdeen et al., 2017) published a comprehensive study of the Solar System’s execution in desert environmental impact. The proposed research mainly focuses on the energy waste of the PV system due to dust accumulation to determine the optimum tilt angle. Eight solar panels were installed on the roof of the engineering department in Upper Egypt in a desert environment with slopes of 15°, 20°, 30°, and 45°to analyze and compare the performance of clean and dusty solar panels. The output power of a dusty solar panel cleaned at different tilt angles was recorded during the test period. In addition, the effect of plate surface temperature is studied experimentally. The measured data show that dust accumulation on the surface of the solar panels reduces the output. The reduction rate depends on the number of days without cleaning and the angle of inclination. The optimum tilt angle for maximum power depends on the number of days without cleaning the dusty panel. On the other hand, the optimal tilt angle for clean panels mainly depends on seasonal changes. To explain the relationship between the number of dust accumulation days and the angle of inclination, an empirical equation to reduce the output of solar panels has been proposed and validated. It helps solar panel system designers accurately predict solar energy reduction and the optimum tilt angle for a given cleaning schedule.
With climate change becoming increasingly important to governments and municipalities, sustainable development and renewable energy attract global attention. One of the challenges in achieving the vision is the low reliability of some renewable resources. While some agencies and public institutions strive to achieve self-sufficiency through sustainable energy generation, it is unclear how much investment is required to mitigate instability caused by natural factors, such as wind speed and sunlight throughout the year. To create these tools via artificial neural networks, Barrera et al. (Barrera et al., 2020) uses open-source data, iot (iot) sensors, and installations spread across Europe. They analyze how different factors affect energy production forecasts and how they can predict the expected outputs of sustainable sources using open data. As a result, it quickly gives users the information they need to determine how much to invest based on the energy output required for a particular site. Their solution presents a layer of abstraction focused on energy production rather than radiation data compared to the latest proposals. Open Data can be used for training and customization in different places. Finally, their tests show that their proposal improves prediction accuracy, resulting in a lower mean squared error.
Hailu et al. (Hailu and Fung, 2019) provide studies for the best tilt angle and orientation of PV panels for maximum insulation. The optimum tilt angle and direction were ascertained using two diffused radiation models. One model is anisotropic, and the other is an anisotropic model. Four opposing models provide a range of optimal tilt angles ranging from 37° to 44°. On the other hand, the results of the four opposing models were more consistent with the optimal tilt angles ranging from 46° to 47°. Both models indicate that the collecting slope needs to be changed four times a year to receive more solar radiation. The results also suggest that the solar panels face West, East, and South with a flatter inclination angle. The results indicate that existing roofs at an angle of up to 15°East or West can be oriented to the southeast using PV/T systems without changing the roof shape.
Jacobson et al. (Jacobson and Jadhav, 2018) provide an estimate of the maximum inclination angle for PV (solar) panels for any country in the world. They also estimate solar radiation that stands on panels that are found or bent better than horizontal panels worldwide. Most shields are derived from the National Renewable Energy Research Institute’s PV Watts program. A simple multidimensional pass is obtained for the maximum slope against the latitude. The pass fits better with data above 40° latitude than the previous linear pass.
With the increasing market for economically viable clean and renewable energy, the demand for photovoltaic (PV) systems is also increasing. The performance of photovoltaic panels for power generation depends on many factors, of which the angle of inclination is an essential factor. In hundreds of studies on the performance of solar panels, this work by Khan et al. (Yunus Khan et al., 2020) critically examines the role of tilt angles and uses various methods, in particular, to find the optimal tilt angle.
Many types of Solar System detection have been used to create smart systems regardless of the dominant or maximal system. Therefore, low-performance smart solar tracking systems have been designed and implemented due to an insufficient combination of solar tracking parameters and smart predictions for the management of solar trackers. AL-Rousan et al. (AL-Rousan et al., 2021) aim to find and evaluate the most efficient and dominant variants in bi-axial and non-axial solar detectors to find the right combination of solar variants and smart predictors. Maximum variables can be viewed using the results of the correlation between different variables and the direction and slope angles. It then uses the selected variants to develop another smart solar detection. The results show that the month, day, and time were the most influential variables in the unilateral and bilateral horizontal solar tracking system. The use of these variants in Cascade Multilayer Perceptron (CMLP) and Multilayer Perceptron (MLP) provides high efficiency. These predictions can effectively predict direction and angle. The week variable is very effective in improving the performance of the Sun detector, but the week variable has nothing to do with direction and inclination. Linear regression predicts less than 70% of the data given in most cases, while nonlinear models can predict the optimal direction and tilt angle.
Solar radiation capture standards are passed by the Earth’s atmosphere and obtained through PV panels. In the study, Heibati et al. (Heibati et al., 2021) Enter all the parameters that drive total daily isolation as mathematical relationships. MathCAD software converts the mathematical model into a computer-based model in the first stage. However, control variables, tilt angle, surface alignment, day of the week, and soil reversal were determined in the second phase. Based on the total isolation target work, this study proposes three scenarios for the control variable. A corrective flow chart was designed for the maximum daily return angle in the last step. A model innovation was designed that analyzes the average effect of control variables on dynamic and maximal tilt angle simulation based on three scenarios of solar PV systems in Montreal buildings in different seasons.
According to different tilt and directions, sixteen solar panels have been installed for experimental purposes. Solar panels were installed in the set of four modules. These modules are named as 1, 2, 3, and 4. Every module contains four solar panels in a different direction and tilts to each other. Table 1 shows the Solar panel specifications. Which includes Open Circuit Voltage (Voc), Short Circuit Current (Isc), Maximum Power Point Current (Impp), Maximum Power Point Voltage (Vmpp), and Temperature coefficient (Pmpp).

TABLE 1. Solar panel specifications.
Four tilt and four direction angles were selected for experimental purposes. Table 2 shows the combinations of all tilts and directions. Solar panels were installed using the combination of 10, 25, 40, and 55 tilt angles with 190, 150, 170, and 210-degree directions. Where the standard for North is 0°, East is 90°, South is 180°, and West is 270°.
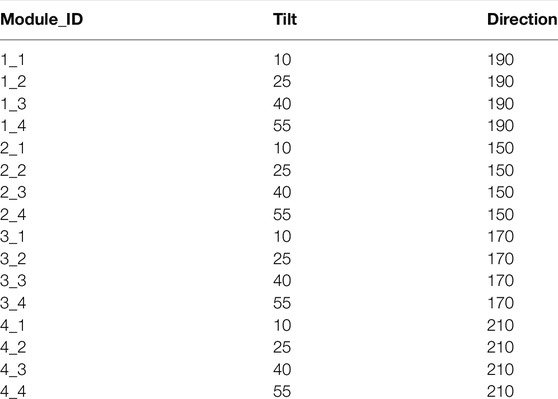
TABLE 2. Tilt and Direction descriptions of Modules.
Figure 3 shows the graphical representation of the data collected from all 16 solar panels. Data consist of 7 months, 1 month from 2020, to six from 2021. In the month of December 2020, there are a few days with low readings compared to other days. There are some outliers in the month of January 2021.
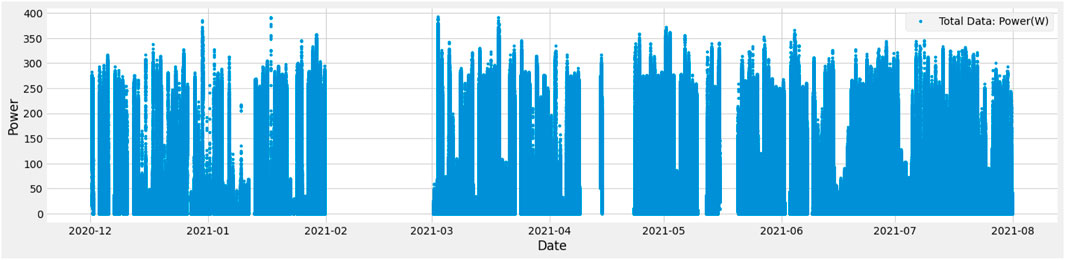
FIGURE 3. Power generated by all panels.
The time column is not in DateTime format during the month of February 2021, and there were many outliers; hence, the February data is removed. Many days are missing in April 2021 and a few outliers as well. Some Missing days in May 2021 are also recorded. In the winter months (December, January), spring (March, April), and summer (May, June, July). The average power generation is the same. The dataset consists of five columns. The time column includes the date and time. Other columns are Module ID, tilt, direction, and power (W) column. Figure 4 represents the count of values against each module. Where the x-axis represents the module ID and the y-axis represents the power. In the panels of the fourth module, there were missing values of each four modules; hence their count is less compared to others.
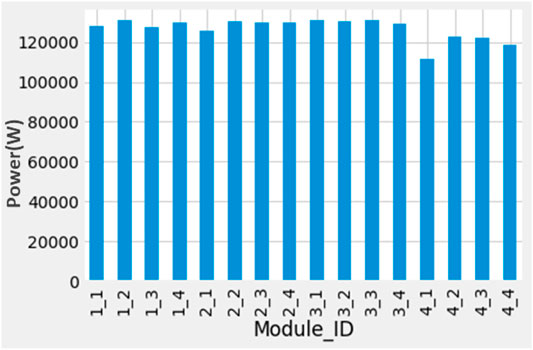
FIGURE 4. Count of readings for each module.
Table 3 shows the data features and their range. The data consist of 7 months, including December, January, March, April, May, June, and July. The data was recorded from 06 in the morning till 06 in the evening. Power generated is recorded every minute; hence it is minute-based data. Four directions (150, 170, 190,210) with the combination of four tilt angles (10, 25, 40,55) were adjusted. The power ranges from 0 to 400 W.
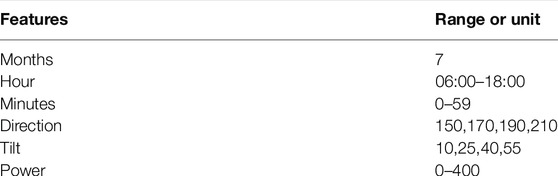
TABLE 3. Data features and ranges.
Machine learning is widely used for energy prediction by power grids (Khan and Byun, 2020). Figure 5 represents the flow diagram of the proposed methodology. Exploratory data analysis (EDA) is performed, and outliers are removed after data analysis. Then the date features are extracted, and the data is split into training and test sets. A stacked ensemble learning model is applied to the training data. A stacked ensemble learning model includes a combination of several machine learning model predictions on the same dataset, such as bags and reinforcements. The stack model structure often consists of a metamodel that combines the predictions of two or more base models, called the Level 0 model, and the base model, the Level 1 model predictions. The model’s accuracy is tested using test data and got the prediction results. Then the tilt and direction are sorted out according to maximum power generation output.
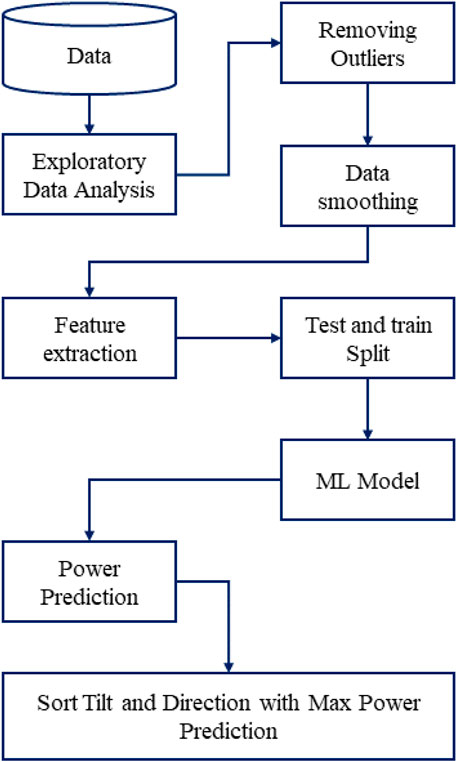
FIGURE 5. Flow diagram of the proposed methodology.
Ensemble learning is a machine learning approach that combines various algorithms based on analytical learning. The stacking ensemble learning algorithm aggregates multiple classifications or regression models to make the output of the final model more stable and lower the risk of overfitting (Rajadurai and Gandhi, 2020). Stacked Ensemble Learning includes several machine learning model predictions on the same dataset, such as bags and reinforcements. The stack model structure often consists of a metamodel that combines the predictions of two or more base models called the level 0 model and the base model the level 1 model predictions. Figure 6 represents the structure of the Stacked ensemble learning model.
• Base-Models: Level-0 Models are also called as base models. Base models are applied to the training data to get the prediction.
• Metamodel: Level-1 Model is also called a metamodel. Metamodel learns how to combine base model predictions best
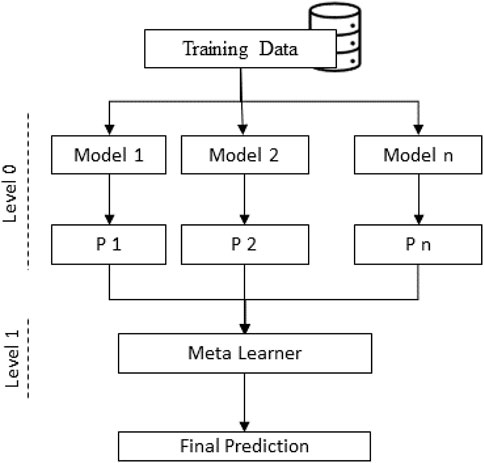
FIGURE 6. Structure of the Stacked ensemble learning model.
The metamodel is trained to predict the base model on extra-sample data (Rustam et al., 2020). The database model that is not used for training is fed to the base model, predictions are made, and these predictions, along with their expected output, are input for the training data set. Pits provide pairs that fit the meta—the output regression of the base model used as input in the model metamodel can be the actual value of regression, a potential value, a probability-like value, or a class designation for classification. Xgboost and catboost are used as base models and Random forest as metamodels for staked ensemble learning.
Extreme gradient boosting, also called as XGboost, is a scalable ML method (Li and Zhang, 2018). It follows the principle of reinforcement. Reinforcement is used to turn active learners into weak learners. Arrange the current regression tree according to the actual number of the last tree. This newly created regression tree is then updated to the adapted version. It also makes a new regression tree to increase the negative correlation of the teaching loss function. The gradient feature learns directly from actual or outstanding errors rather than updating the scoring point weight. Gradual reinforcement involves making predictions to create a brand-new forecast. This process starts by training the tree of choice, and then only those who are good at predicting and calculating the remnants of the tree of choice follow the tree of choice. Save the remaining original numbers as new y. This process is repeated until it reaches the number of trees that are going to train. Then it makes the final prediction.
Caboose is a gradient boosting model for the management of categorical data. The model starts the connection values, then calculates the side balance and measures the base learner that matches the side balance (Massaoudi et al., 2020). Then calculate the multiplication and ignore the mode. Instead, it makes random changes to the dataset. Calculate the specific label rate for the version with similar values before giving it a replacement. Caboose uses this method to manage instant features. Comparison ref Eq. 1 is used to convert these categories into numerical attributes.
Where Ta is the averages target and to calculate this, and it is used in class counter (Ci), starting values for numerator(P) and total counter (Ct).
Random Forest model is an ensemble learning method for classification, and regression, made by combining selected values with the implementation of class (Cáceres et al., 2021). Random forest means a pattern or class tree prediction. The standard estimate for the random forest model is the choice of regression trees. Contrary to descriptive assessments, random forests randomly select a permanent function that can be used to determine the exact distribution on each node of the selection tree. It starts with the boot pattern, a random subset of size N from the training set X. This process is called bootstrapping. Then move Tb from the boot model and select a random variable from X where L is less than the input variable. Only a random set of functions is considered to determine the best distribution at each decision tree node. It is used to divide division nodes and grow trees without pruning. In each tree, it predicts the record in the test set and finally returns using the Eq. 2. Final predictions are calculated by matching the estimates of all decisive trees.
Savitzky-Golay Filter (Savgol filter) is a digital filter that can be implemented to a series of digital data points to flatten the data, that is, to increase the accuracy of the data without deteriorating the signal directions. This is achieved by placing an integrated subset of adjacent data points in a low order polynomial time by the minimal linear square method in a process known as wrapping. An analytical solution to compare with at least squares found in the form of a set of single-wrapped coefficients that can be applied to any subset of data to estimate the smooth signal when the data points are equal in the center of each subgroup. The Savgol filter is applied on an hourly basis.
Figure 7 represents the overall structure of the proposed methodology. A test-bed consisting of 16 solar panels was set up for this study. The power generation data on a minute based was stored in the database. This data contains information about the power generated by each solar panel. Metadata consists of solar panel information. The raw data is shared with the machine learning development module. Where different ML operation was performed on the dataset. Raw data were analyzed using exploratory data analysis techniques. This included data visualization according to each panel, month, tilt, and direction setting. In the preprocessing stage, some outliers were removed. Then Savitzky–Golay filter is applied for data smoothing. The preprocessed data is split into the train and test modules, and a stacked ensemble model is trained using this data. The stacked ensemble model consists of two layers. Layer 0 consists of Xgboost and catboost models. Layer one consists of a random forest model. Regression scores and MAPE are used as error metrics. The end users can interact with the system through the web application. The web application receives output from the ML model using REST API. The users can get the output of optimal tilt and direction for solar panel installation.
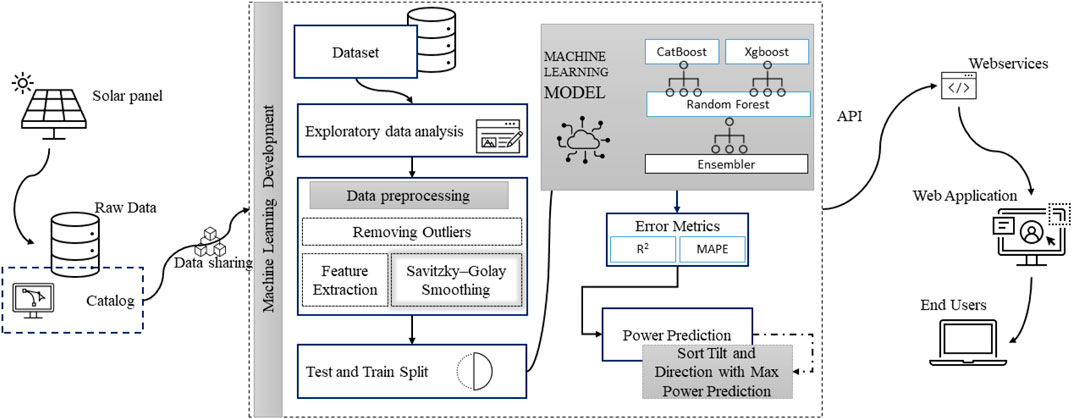
FIGURE 7. Structure of the proposed methodology.
The proposed method is evaluated using Mean absolute percentage error and Regression score.
The mean absolute error percentage (MAPE) is an estimate of how accurate the forecast system is. MAPE measure this accuracy as a percentage and calculate the average absolute error for each period by dividing the real value by the actual value. Eq. 3 is used to calculate MAPE (De Myttenaere et al., 2016). Where yi represents the actual value and
Regression scores are used to compare the performance of different models further, and this score is calculated using Eq. 4. R-square measures the relative quality of the regression model. It has a valuable property whose scale is intuitive. The range of R2 is 0–1, where 0 indicates that the proposed model does not improve the predictions for the average model, and one indicates the perfect forecast. Improvements in the regression model lead to a relative increase in the R-square (Chen, 1983).
The dataset is divided into train and test datasets. Train datasets contain 4 months’ data, including November, December, January, and April. The data for March 2021 is dropped due to a lot of abnormalities. April 2021 Data also has many abnormalities and missing values. May 2021 is used as Test Dataset. Figure 8 shows the training and testing data division used for the proposed machine learning model. T data of 6 months is used for training and 1 month for testing purposes. Training data is represented with blue color, and testing data is represented with red color.
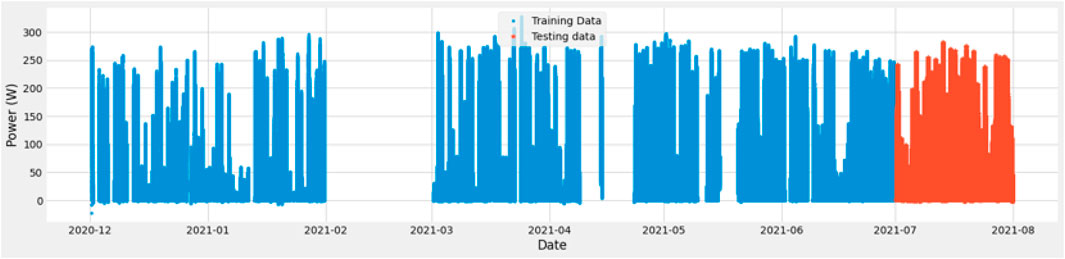
FIGURE 8. Train and test data splitting.
A graphical comparison was made of the data’s difference before and after removing outliers. Figure 9 represents the April data before removing outliers, and Figure 10 represents the April data after removing outliers. In the month of April, there were some readings of more than 1200 W, which is abnormal compared to the other data of the same month. Hence the entries with a reading of more than 400 W are removed.
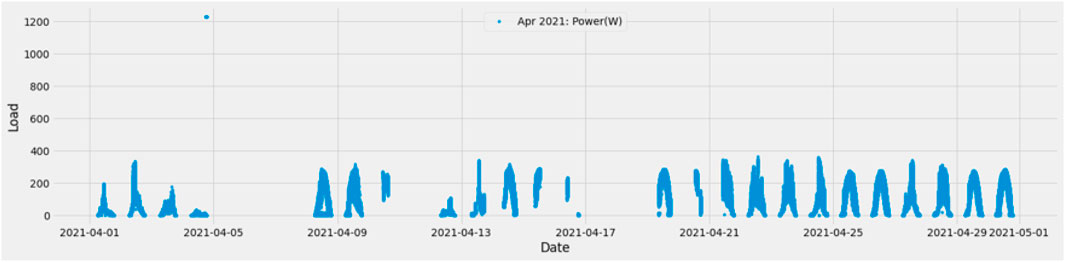
FIGURE 9. April data before removing outliers.
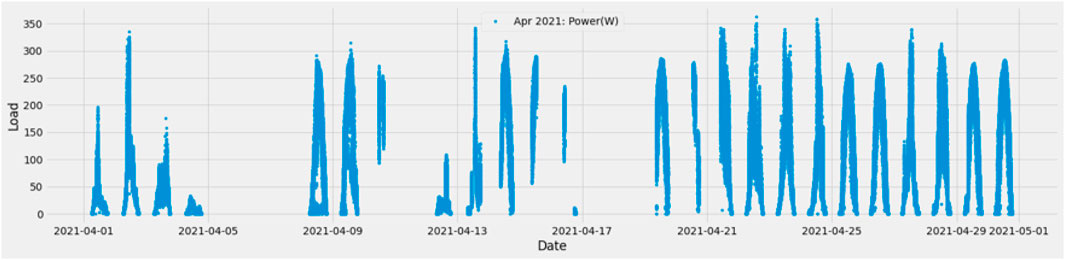
FIGURE 10. April data after removing outliers.
Before and after applying the savgol filter, the power generation patterns are compared. Figure 11 shows the power output from all 16 panels on December 9 data before Smoothing. Figure 12 shows the power output from all 16 panels on December 9 data after Smoothing.
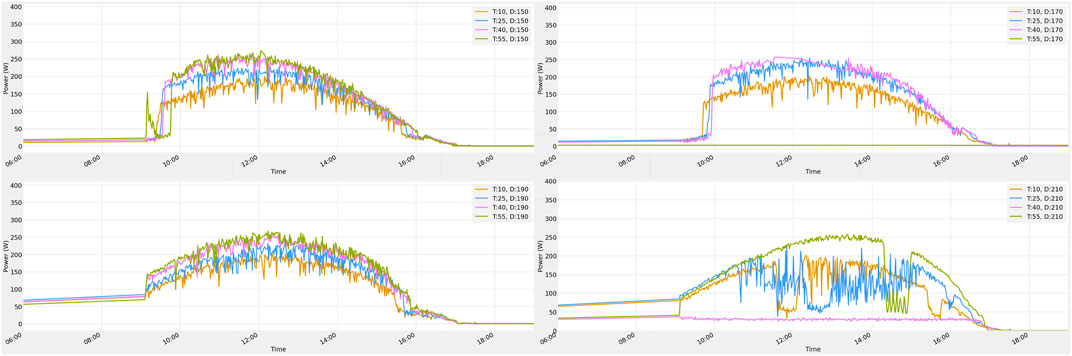
FIGURE 11. December 9 data before Smoothing.
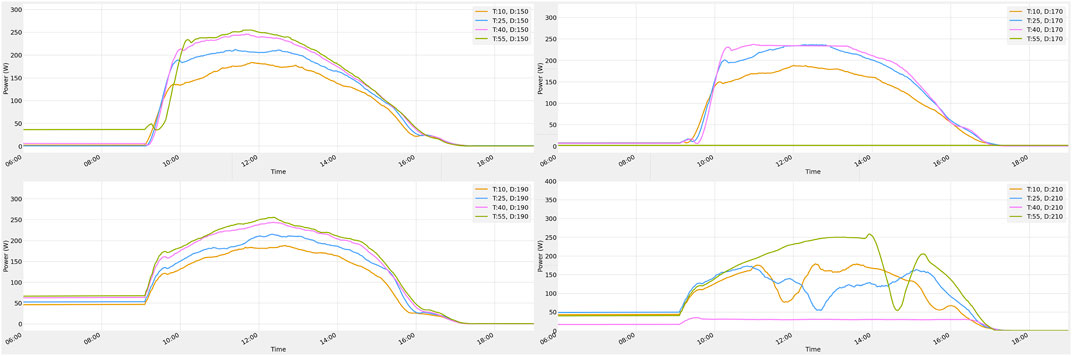
FIGURE 12. December 9 data after Smoothing.
Figure 13 shows the prediction results. Light blue color represents the actual power values in the month of May, and green color represents the prediction results using the random forest forecasting model. Figure 14 represents the 3D visualization of power prediction according to each tilt and direction setting. This figure represents the sum of energy generated in the month of May. It is observed that during the daytime, the energy output is maximum. Maximum power is generated through the modules 42, 43, and 44. The direction of these modules is 210°, and tilts are 25,40, and 55, respectively.
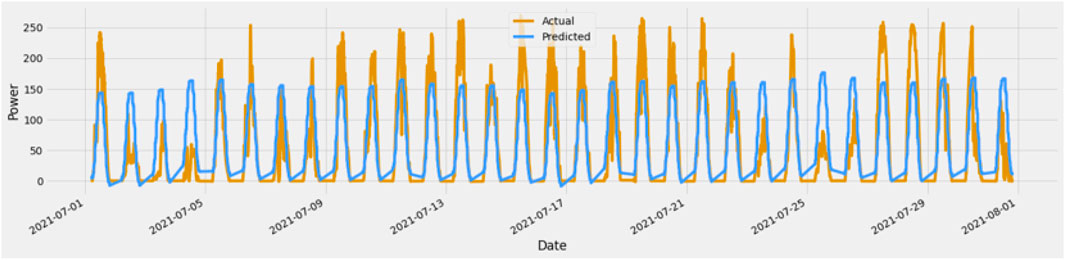
FIGURE 13. Prediction results.
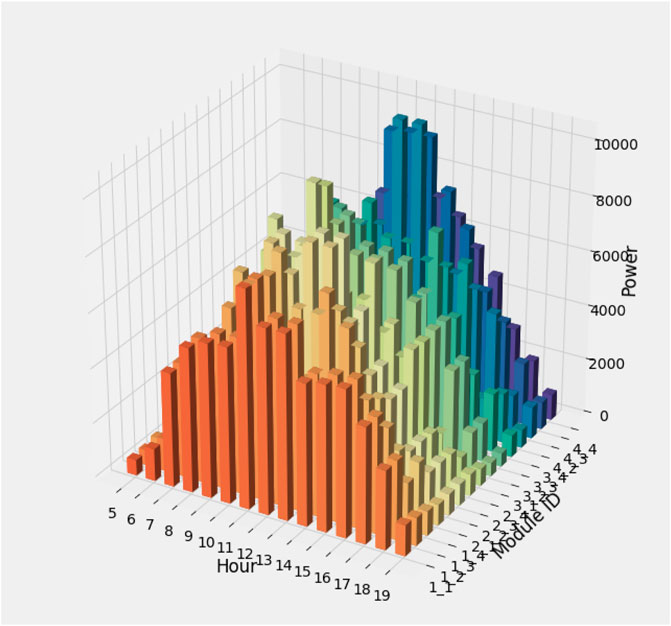
FIGURE 14. 3D representation of power prediction for each module.
In this section, the predictive results obtained from the proposed hybrid model are evaluated by two evaluation metrics to find a better fit. These metrics are Mean absolute percentage error (MAPE) and regression score R2. The proposed model was compared to Extreme gradient boost (Xgboost), Support Vector Regressor (SVR), Multilayer perceptron (MLP), CatBoost, and Random forest models.
Table 4 represents the MAPE and regression score (R2) of extreme gradient boost, SVR, CatBoost, MLP Random forest models and their comparison with our proposed model. If the (R2) is near to 1, it indicates a better model, and if it is near to zero, that shows that the model is not well trained. Compared to the other state-of-the-art models, the MAPE of the proposed model is very low, reflecting that the proposed methodology can work better with less mean absolute percentage error.
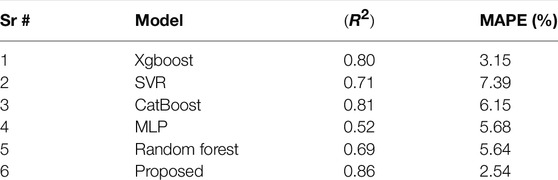
TABLE 4. Comparison of R2 and MAPE with existing models.
The solar panel orientation, tilt, and direction of solar panels primarily affect the performance. Once the solar panel is fixed and it is not producing optimal energy, it will be costly to change the orientation of the PV panel. There are some continuous tracking PV panels as well, which track the sunlight and adjust themselves according to that; however, they are expensive and not cost-efficient. Therefore, determining solar panel orientation during installation is one of the critical challenges the solar panel installation companies face.
Energy generation from solar panels mainly depends upon the sunlight along with other factors such as weather. Tilt and direction to obtain maximum sunlight rays vary from location to location. Many researchers have presented different approaches to obtain the optimal orientation of the solar panel. Darhmaoui et al. (Darhmaoui and Lahjouji, 2013) proposed a regression model to determine the optimal tilt angle for maximum solar energy collection. Sarr et al. (Sarr et al., 2021) proposed a mathematical model to determine the best tilt angle for photovoltaic modules in Senegal. Ramli et al. (Ramli et al., 2021) have combined the most valuable player algorithm (MVPA) and the particle swarm optimization (PSO) algorithm to maximize the solar radiation on PV Panels With optimal intervals and tilt angle.
This work proposed a machine learning-based algorithm to predict which tilt angle and direction of solar panels will be suitable to generate maximum electricity. It can be concluded from this research that the output power of the solar photovoltaic system is affected by the tilt angle value. Hence, there is a need to predict the tile angle to obtain the maximum output accurately. The experimental results obtained by using a setup of 16 Solar System models were verified. The performance of the proposed method is compared with other models such as Xgboost, Random forest model, Catboost, Multilayer perceptron, and Support vector regressor. However, the proposed approach performed better than these algorithms. Different evaluation matrices are used to analyze the performance of the proposed methodology. We obtained a regression score of 0.86 and a MAPE of 2.54%. The proposed model is beneficial in terms of accuracy, adaptability, and reduced metadata requirements, as weather features were not included in the simulations. Machine learning approaches are comparatively better than statistical or mathematical models because they learn from the data. The proposed approach can prove helpful for solar panel companies and policymakers to determine the best orientation of PV panels. It will reduce cost, save time and generate more energy.
Photovoltaic panels largely depend upon sunlight to generate electricity. Several factors affect the output of solar panels, such as weather, solar radiance, and season. The output of a solar photovoltaic system is also affected by the tilt angle value at the time of installation, so the optimal direction and tile angle at the time of installation are required to obtain the maximum output accurately. This article proposes a way to find the optimal solar angle using a stacked ensemble learning model. The base layer of the model contains Xgboost and catboost. The meta-layer contains a random forest model. We have used 16 different tilt and direction combinations to generate simulation data. The data is preprocessed by removing outliers and using Savitzky–Golay filter to smooth the data. Then we applied the stacked ensemble learning model method upon that data and predicted the power output. Then we arrange the production of all angles in ascending order to find the optimal angle. The performance of the proposed method is compared with other ML and statistical models. We obtained a regression score (R2) of 0.86 and a mean absolute percentage error (MAPE) of 2.54%. In the future, the effect of weather on solar panels’ power generation can be accessed to obtain better results.
The raw data supporting the conclusion of this article will be made available by the authors, without undue reservation.
All authors listed have made a substantial, direct, and intellectual contribution to the work and approved it for publication.
This research was financially supported by the Ministry of SMEs and Startups (MSS), Korea, under the “Startup growth technology development program (R&D,S3125114)”.
The authors declare that the research was conducted in the absence of any commercial or financial relationships that could be construed as a potential conflict of interest.
All claims expressed in this article are solely those of the authors and do not necessarily represent those of their affiliated organizations, or those of the publisher, the editors and the reviewers. Any product that may be evaluated in this article, or claim that may be made by its manufacturer, is not guaranteed or endorsed by the publisher.
Abdeen, E., Orabi, M., and Hasaneen, E.-S. (2017). Optimum Tilt Angle for Photovoltaic System in Desert Environment. Solar Energy 155, 267–280. doi:10.1016/j.solener.2017.06.031
Al-Rousan, N., Mat Isa, N. A., and Mat Desa, M. K. (2021). Correlation Analysis and Mlp/cmlp for Optimum Variables to Predict Orientation and Tilt Angles in Intelligent Solar Tracking Systems. Int. J. Energ. Res. 45, 453–477.
Babu, T. S., Ram, J. P., Dragičević, T., Miyatake, M., Blaabjerg, F., and Rajasekar, N. (2017). Particle Swarm Optimization Based Solar Pv Array Reconfiguration of the Maximum Power Extraction under Partial Shading Conditions. IEEE Trans. Sustain. Energ. 9, 74–85.
Barrera, J. M., Reina, A., Maté, A., and Trujillo, J. C. (2020). Solar Energy Prediction Model Based on Artificial Neural Networks and Open Data. Sustainability 12, 6915. doi:10.3390/su12176915
Cáceres, L., Merino, J. I., and Díaz-Díaz, N. (2021). A Computational Intelligence Approach to Predict Energy Demand Using Random forest in a Cloudera Cluster. Appl. Sci. 11, 8635.
Chen, C.-F. (1983). Score Tests for Regression Models. J. Am. Stat. Assoc. 78, 158–161. doi:10.1080/01621459.1983.10477945
Chinchilla, M., Santos-Martín, D., Carpintero-Rentería, M., and Lemon, S. (2021). Worldwide Annual Optimum Tilt Angle Model for Solar Collectors and Photovoltaic Systems in the Absence of Site Meteorological Data. Appl. Energ. 281, 116056. doi:10.1016/j.apenergy.2020.116056
Connolly, D., Lund, H., Mathiesen, B. V., and Leahy, M. (2010). A Review of Computer Tools for Analysing the Integration of Renewable Energy into Various Energy Systems. Appl. Energ. 87, 1059–1082. doi:10.1016/j.apenergy.2009.09.026
Darhmaoui, H., and Lahjouji, D. (2013). Latitude Based Model for Tilt Angle Optimization for Solar Collectors in the Mediterranean Region. Energ. Proced. 42, 426–435. doi:10.1016/j.egypro.2013.11.043
De Myttenaere, A., Golden, B., Le Grand, B., and Rossi, F. (2016). Mean Absolute Percentage Error for Regression Models. Neurocomputing 192, 38–48. doi:10.1016/j.neucom.2015.12.114
Haben, S., and Giasemidis, G. (2016). A Hybrid Model of Kernel Density Estimation and Quantile Regression for Gefcom2014 Probabilistic Load Forecasting. Int. J. Forecast. 32, 1017–1022. doi:10.1016/j.ijforecast.2015.11.004
Hailu, G., and Fung, A. S. (2019). Optimum Tilt Angle and Orientation of Photovoltaic thermal System for Application in Greater toronto Area, canada. Sustainability 11, 6443. doi:10.3390/su11226443
Heibati, S., Maref, W., and Saber, H. H. (2021). Developing a Model for Predicting Optimum Daily Tilt Angle of a Pv Solar System at Different Geometric, Physical and Dynamic Parameters. Adv. Building Energ. Res. 15, 179–198. doi:10.1080/17512549.2019.1684366
Jacobson, M. Z., and Jadhav, V. (2018). World Estimates of Pv Optimal Tilt Angles and Ratios of Sunlight Incident upon Tilted and Tracked Pv Panels Relative to Horizontal Panels. Solar Energy 169, 55–66. doi:10.1016/j.solener.2018.04.030
Kaaya, I., Koehl, M., Mehilli, A. P., de Cardona Mariano, S., and Weiss, K. A. (2019). Modeling Outdoor Service Lifetime Prediction of Pv Modules: Effects of Combined Climatic Stressors on Pv Module Power Degradation. IEEE J. Photovoltaics 9, 1105–1112. doi:10.1109/jphotov.2019.2916197
Khan, P. W., and Byun, Y. C. (2021). “Analysis of Factors Affecting Machine Learning-Based Energy Prediction,” in Proceedings of KIIT Conference, 33–35.
Khan, P. W., and Byun, Y.-C. (2020). Genetic Algorithm Based Optimized Feature Engineering and Hybrid Machine Learning for Effective Energy Consumption Prediction. IEEE Access 8, 196274–196286. doi:10.1109/access.2020.3034101
Khan, P. W., Kim, Y., Byun, Y.-C., and Lee, S.-J. (2021). Influencing Factors Evaluation of Machine Learning-Based Energy Consumption Prediction. Energies 14, 7167. doi:10.3390/en14217167
Kim, G. Y., Han, D. S., and Lee, Z. (2020). Solar Panel Tilt Angle Optimization Using Machine Learning Model: a Case Study of Daegu City, south korea. Energies 13, 529. doi:10.3390/en13030529
Li, P., and Zhang, J.-S. (2018). A New Hybrid Method for China's Energy Supply Security Forecasting Based on ARIMA and XGBoost. Energies 11, 1687. doi:10.3390/en11071687
Massaoudi, M., Refaat, S. S., Abu-Rub, H., Chihi, I., and Wesleti, F. S. (2020). “A Hybrid Bayesian ridge Regression-Cwt-Catboost Model for Pv Power Forecasting,” in 2020 IEEE Kansas Power and Energy Conference (KPEC) (Manhattan, KS, USA: IEEE), 1–5. doi:10.1109/kpec47870.2020.9167596
Meng, F., Zou, Q., Zhang, Z., Wang, B., Ma, H., Abdullah, H. M., et al. (2021). An Intelligent Hybrid Wavelet-Adversarial Deep Model for Accurate Prediction of Solar Power Generation. Energ. Rep. 7, 2155–2164. doi:10.1016/j.egyr.2021.04.019
Orlov, A., Sillmann, J., and Vigo, I. (2020). Better Seasonal Forecasts for the Renewable Energy Industry. Nat. Energ. 5, 108–110. doi:10.1038/s41560-020-0561-5
Rajadurai, H., and Gandhi, U. D. (2020). A Stacked Ensemble Learning Model for Intrusion Detection in Wireless Network. Neural Comput. Appl. 2020, 1–9. doi:10.1007/s00521-020-04986-5
Ramli, M. A. M., Bouchekara, H. R. E. H., Shahriar, M. S., Milyani, A. H., and Rawa, M. (2021). Maximization of Solar Radiation on PV Panels with Optimal Intervals and Tilt Angle: Case Study of Yanbu, Saudi Arabia. Front. Energ. Res. 9, 753998. doi:10.3389/fenrg.2021.753998
Rustam, F., Reshi, A. A., Ashraf, I., Mehmood, A., Ullah, S., Khan, D. M., et al. (2020). Sensor-based Human Activity Recognition Using Deep Stacked Multilayered Perceptron Model. IEEE Access 8, 218898–218910. doi:10.1109/access.2020.3041822
Sarr, A., Kebe, C. M., and Ndiaye, A. (2021). Determination of the Optimum Tilt Angle for Photovoltaic Modules in senegal. Afr. J. Environ. Sci. Technol. 15, 214–222.
[Dataset] Scott, M. (2020). Buying Clean Energy in Asia Set to Get Easier as Firms Demand 100renewable Power. Available at: https://www.forbes.com/sites/mikescott/2020/12/17/barriers-to-buying-clean-energy-in-asia-set-to-fall-unleashing-growth/?cv=1&sh=679cb111d4fe.
Wu, C., Liu, H., Yu, Y., Zhao, W., Liu, J., Yu, H., et al. (2021). Ecohydrological Effects of Photovoltaic Solar Farms on Soil Microclimates and Moisture Regimes in Arid Northwest china: A Modeling Study. Sci. Total Environ. 2021, 149946.
Xenophontos, A., and Bazzi, A. M. (2017). Model-based Maximum Power Curves of Solar Photovoltaic Panels under Partial Shading Conditions. IEEE J. Photovoltaics 8, 233–238.
Keywords: machine learning, data curation, tilt prediction, energy forecasting, direction prediction, solar panels, RE100, solar energy
Citation: Khan PW, Byun Y-C and Lee S-J (2022) Optimal Photovoltaic Panel Direction and Tilt Angle Prediction Using Stacking Ensemble Learning. Front. Energy Res. 10:865413. doi: 10.3389/fenrg.2022.865413
Received: 29 January 2022; Accepted: 14 March 2022;
Published: 27 April 2022.
Edited by:
K. Sudhakar, Universiti Malaysia Pahang, MalaysiaReviewed by:
Daniel Tudor Cotfas, Transilvania University of Brașov, RomaniaCopyright © 2022 Khan, Byun and Lee. This is an open-access article distributed under the terms of the Creative Commons Attribution License (CC BY). The use, distribution or reproduction in other forums is permitted, provided the original author(s) and the copyright owner(s) are credited and that the original publication in this journal is cited, in accordance with accepted academic practice. No use, distribution or reproduction is permitted which does not comply with these terms.
*Correspondence: Yung-Cheol Byun, eWNiQGplanVudS5hYy5rcg==
Disclaimer: All claims expressed in this article are solely those of the authors and do not necessarily represent those of their affiliated organizations, or those of the publisher, the editors and the reviewers. Any product that may be evaluated in this article or claim that may be made by its manufacturer is not guaranteed or endorsed by the publisher.
Research integrity at Frontiers
Learn more about the work of our research integrity team to safeguard the quality of each article we publish.