 Xiaoxue Wang
 Yan Rong
 Dong Liang
 Yikang Zhao
 Yixin Liu
 Bin Gu
- 1State Key Laboratory of Reliability and Intelligence of Electrical Equipment, Hebei University of Technology, Tianjin, China
- 2Key Laboratory of Smart Grid of Ministry of Education, Tianjin University, Tianjin, China
- 3Qinghai Huanghe Intelligent Energy Co., Ltd., Qinghai, China
Traditional voltage control methods for distribution networks assume perfect knowledge of the power system model. Nevertheless, the extensive scale of future distribution networks makes it unrealistic to acquire the overall operation state monitoring. Moreover, with the deregulation of distribution networks, partial controllable resources belong to independent systems, such as microgrids, causing distribution system operators unable to force them to provide voltage support directly. To cope with the previously mentioned problems, a data-driven fast voltage control method for distribution networks with MGs is proposed in this article. First, voltage sensitivity matrices are estimated indirectly by identifying line parameters in a regression approach, without using measurement data of distribution phasor measurement units (DPMUs) in distribution networks. Then, an incomplete information game model is proposed to motivate MGs to provide ancillary services of voltage control. To guarantee privacy, only a little key information is shared among MGs and distribution system operators. Moreover, MGs make voltage control strategies autonomously based on the data-driven deep reinforcement learning algorithms, while maximizing their own profits. Finally, we test the method on the modified IEEE 33-node networks and IEEE 123-node networks. The results demonstrate that the proposed method can provide an accurate voltage estimation in electricity markets with non-DPMU measurement data and increase energy and asset utilization.
Introduction
The increasing penetration of distributed energy resources (DERs) in distribution networks poses new challenges to conventional voltage control, due to DERs’ uncertainty and volatility (Han et al., 2018a). Traditional voltage control methods assume perfect knowledge of the distribution system model including topology and corresponding line parameters (Yu et al., 2019; Jiang, 2021). With the extending scale of distribution networks, however, the overall acquisition of this information is unrealistic (Liu et al., 2021). Consequently, the distribution system operator (DSO) cannot model voltage control problems mathematically. On the other hand, the massive inverter-based DERs have a faster response than traditional on-load tap changers and capacitors, making them responsive in the event of dynamic variations (Taousser et al., 2020). However, the deregulation of distribution networks causes an increasing number of DERs invested and developed by independent system operators, making DSOs unable to control these DERs directly (Wang et al., 2018a; Zhao et al., 2021). As such, there is an urgent need for a novel voltage control method considering multiple participants in situations where a complete model of distribution networks is unknown.
With the development of advanced measurement systems, data-driven methods provide possibilities to deal with the absence of an accurate model in voltage control (Tu et al., 2017). Most data-driven voltage control methods depend on the estimation of voltage sensitivities, which transfers the non-linear relation between voltage magnitude and nodal injected power into a linear relation. The data-driven estimation methods of voltage sensitivities can be divided into three categories: Jacobian matrix identification (Chen et al., 2016; Wang et al., 2018b), online disturbance observation (Sansawatt et al., 2012), and power–voltage mapping (Xu et al., 2019; Dharmawardena and Venayagamoorthy, 2021). The Jacobian matrix can be identified directly by using some regression algorithms such as least-squares regression, linear total least-squares, or ensemble regression (Liu et al., 2019; Zhang et al., 2019). The Jacobian matrix changes with the distribution network operation states. Therefore, the Jacobian matrix needs to be identified dynamically, which requires measurements at a high sampling rate to quickly track changes in system operating conditions. As to online disturbance observation, Huo et al. (2021) proposed a model-free adaptive control strategy of flexible interconnected devices through the real-time interaction of measurement information with distribution networks, to effectively adapt to state changes and improve the operational performance of distribution networks. The aforementioned two methods based on the Jacobian matrix identification and online disturbance observation require to update voltage sensitivities according to distribution network real-time operation states, which need a high requirement of measurement systems (Dasgupta and Soman, 20132013). To acquire adequate online measurement data, many existing methods require the nodal voltage angles measured by distribution phasor measurement units (DPMUs). However, limited by investment and communication techniques in most distribution networks, it is unrealistic to fully equip expensive DPMUs (Pappu et al., 2018). To tackle the problem, methods based on power–voltage mapping obtain voltage sensitivities through a linear power flow model, the parameters of which can be estimated by historical measurements with a regression approach. In Xu et al. (2020), data-driven voltage regulation for controlling DERs in balanced radial distribution networks is proposed without knowing a complete model of the power distribution system. It estimates the voltage sensitivities indirectly by estimating the topology configuration and the corresponding line parameters with much less non-DPMU data than existing algorithms. However, it needs the given distribution line resistance-to-reactance ratios and power factors.
Inverter-based DERs with fast response, low operational cost, and flexible control mode are potential voltage controllers in distribution networks (ndustry Technic, 2018). As independent systems integrating DERs and inner management systems, microgrids (MGs) with high flexibility can be motivated by incentives to provide voltage support in the ancillary service market (Wang et al., 2018c; Liu et al., 2018). The existing applications of MGs in distribution networks are mainly focused on economic operation and energy management and few on ancillary voltage support (Wang et al., 2015; Espina et al., 2020). Moreover, most of the aforementioned applications depend on the accurate models of distribution systems even of MG internal components to achieve desirable performance. It is impractical for the DSO and MGs to share all the personal information, especially in distribution networks with increasingly numerous buses and independent systems (Wang et al., 2020). Recently, deep reinforcement learning (DRL) algorithms have been applied to cope with the imperfect model problems in voltage control (Cao et al., 2021), energy trading (Gao et al., 2021a), frequency control (Yan and Xu, 2019), and energy management (Du et al., 2021). In Liu and Wu (2021), a decentralized control framework of Volt-VAR control without an accurate system model is proposed, and a novel multi-agent constrained soft actor-critic reinforcement learning algorithm is used to train the control agents online. Gao et al. (2021b) proposed a consensus multi-agent DRL algorithm for voltage problems, which is formulated as a networked multi-agent Markov decision process and solved in the maximum entropy reinforcement learning framework. However, these methods do not consider the voltage regulators belonging to different independent systems.
In this study, to target the aforementioned research gaps, a data-driven fast voltage control method for distribution networks with MGs is proposed. Without a complete model of distribution networks, a DSO estimates voltage profiles by identifying true network parameters based on historical non-DPMU measurements. Subsequently, a DSO motivates MGs to provide ancillary services of voltage control by incentives. To guarantee the privacy of MGs, MGs exchange only key information with each other and optimize the control strategies to maximize their own profits based on the data-driven DRL algorithm. To summarize, the main contributions of this article are as follows: 1) A data-driven voltage estimation method in distribution networks is proposed by only a few non-DPMU measurements, including voltage magnitude and nodal injected power. 2) A game bidding scheme in the ancillary service market is proposed for the DSO and MGs. The MGs are utilized to provide voltage control support, increasing energy and asset utilization. 3) In the incomplete information bidding among the DSO and MGs, the MG bidding strategy optimization is formulated in a data-driven DRL model.
The remainder of this article is organized as follows: Data-Driven Voltage Estimation Method for Non-DPMU Distribution Networks proposes a data-driven voltage estimation method for non-DPMU distribution networks without an accurate system model. Game Bidding of Voltage Control Based on DRL Algorithm introduces the game bidding model of voltage control with MGs’ DRL-based decision-making in the ancillary service market. Case studies are presented in Case Studies, while Conclusion concludes this study.
Data-Driven Voltage Estimation Method for Non-DPMU Distribution Networks
To cope with situations where an accurate system model is unavailable, a data-driven voltage estimation method for radial non-DPMU distribution networks is proposed. This method uses historical measurement data, including voltage magnitude and nodal injected power, to identify line parameters of distribution networks. Based on the power flow model, the mapping relationship between nodal injected power and voltage magnitude is established to realize the data-driven voltage estimation. Instead of load flow calculation, voltage estimation based on mapping can reduce computation and improve the responding speed of control systems.
Data-Driven Parameter Identification of Distribution Networks
The proposed voltage estimation method for radial distribution networks is based on the DistFlow power flow model. The simplified radial distribution network is shown in Figure 1, and the DistFlow power flow model can be expressed as follows:
where node i-1 and node i+1 represent the upstream adjacent node and the downstream adjacent node of node i, respectively. Pi and Qi represent the injected active and reactive power of node i, respectively. When the node absorbs power from distribution networks, the nodal injected power is positive. For any branch L(i-1,i), ri-1,i and xi-1,i represent resistance and reactance of L(i-1,i), respectively. Pi-1,i and Qi-1,i represent the active and reactive power from node i-1 into L(i-1,i), respectively. li-1,i represents the square of the current flowing on L(i-1,i). Vi represents the voltage magnitude of node i. Generally, node 0 is the slack node of distribution networks.
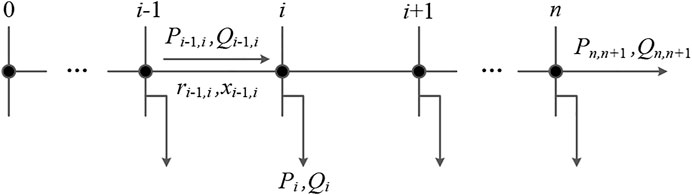
FIGURE 1. Simplified radial distribution network.
Neglecting network losses, the DistFlow power flow model can be simplified as follows:
where β(i) represents the node set including node i and its downstream nodes. Based on Eqs 5–7,
where Li represents the set of branches on the path from node 0 to node i. n represents the number of nodes in distribution networks, excluding node 0. Rij and Xij represent the total resistance and reactance of branches in set Li∩Lj. Once the distribution network topology is fixed, R and X are constant matrices. The matrix expression of Eq. 8 is as follows:
where R and X represent the voltage sensitivity matrices, respectively. Since the voltage of the slack node in distribution networks is always equal to 1, in this study,
To obtain R and X in Eq. 9, the partial least squares (PLS) algorithm is applied to regress between I and J, based on historical operation data of nodal injected power and voltage magnitude. I and J are expressed as follows:
where the index t indicates that the corresponding measurement is obtained at time instant t.
The PLS regression algorithm divides the model into the inner model and the outer model. The outer model converts raw data to the latent variable space and obtains mutually orthogonal score vectors, while the inner model establishes a linear relationship between the scores. The outer model is given as follows:
where w1 and u1 are the first principal component score vectors of I and J, respectively; c1 and d1 are the corresponding loads; and H1 and G1 are the corresponding residuals. The inner model is given as follows:
where b1 is a regression coefficient, which is obtained by minimizing the modeling error h1.
After extracting the first principal component, the second principal component is extracted from residuals in the same way. This process is repeated until all the principal components are extracted. After that, based on the inner model and outer model, the relationship between I and J is established. Likewise, the voltage sensitivity matrices R and X in Eq. 9 are obtained, meanwhile, the branch resistance and reactance in distribution networks can be calculated.
Voltage Estimation Method Based on Accuracy Improvement
To improve the accuracy of the proposed method, voltage estimation is based on modified Eq. 9 through an iterative process. To enhance the regression capability of the proposed model, the constant term C of voltage magnitude is added to Eq. 9, as follows:
Although the voltage estimation equation does not have any constant terms, C is added to the linearization equation to enhance the regression capability. In power systems, values of some independent variables may remain unchanged, and regression parameters of these independent variables in R and X may not be regressed. The influences of these independent variables can be absorbed in these constant terms.
Based on the previous derivation in Data-Driven Parameter Identification of Distribution Networks, the branch resistance and reactance can be obtained based on Eq. 14, in the situation where network losses are ignored. Based on the obtained line parameters, branch losses can be calculated by Eqs 4–6. Then, with network losses considered,
Substituting Eqs 5, 6 by Eqs 15, 16, the regressed voltage sensitivity matrices R and X are more accurate than those in Data-Driven Parameter Identification of Distribution Networks. Consequently, with R, X, and C known in Eq. 14, voltage can be estimated based on nodal injected power, providing theoretical support to the subsequent voltage control in distribution networks with MGs.
Game Bidding of Voltage Control Based on DRL Algorithm
In the distribution electricity market, MGs, as ancillary service providers, often belong to different independent systems. Therefore, in order to guarantee the fairness and privacy of participants, a voltage control method based on the dynamic game bidding between DSO and MGs is proposed. In the proposed method, DSO uses rewards to motivate MGs to provide voltage control ancillary services autonomously. With incomplete information exchanged among DSO and MGs, MGs make decisions based on the DRL algorithm to provide fast voltage support for distribution networks while maximizing their own benefits.
Game Bidding Model of DSO and MGs in Voltage Control
In the proposed voltage control method, the DSO and MGs improve voltage profiles based on the leader–follower game model. In this model, the leader is the DSO and the followers are MGs. The DSO uses rewards to motivate MGs to regulate their power injections at the points of common coupling (PCCs). In turn, power regulation at PCCs can improve voltage profiles of distribution networks. The DSO and MGs continuously update their strategies through an iterative process until none of them change their strategies.
DSO Modeling
To induce MGs to provide voltage support for distribution networks, DSO needs to offer rewards to MGs based on their contribution to voltage improvement. During voltage control, the reward RDSO, provided by the DSO, only depends on voltage profiles of distribution networks before and after voltage control, but does not depend on MGs’ strategies. Since the DSO focuses on nodes with voltage excursions, the set of which can be denoted by Nexceed, RDSO is defined as follows:
where Vexceed, before and Vexceed, after denote the vectors of Vi (
As mentioned, the reward RDSO is shared by all the MGs according to their contributions to voltage control. Therefore, the DSO needs to develop a fair and effective reward allocation system so that the subsidy received by each MG effectively reflects its contribution to voltage regulation. In the game theory, the Shapley value is a solution concept to assign a unique distribution of a total surplus generated by the coalition of all players. Therefore, the proposed method applies the Shapley value to distribute rewards. Let F be a set of n players, each potential coalition Z consists of one or several players in F, and Z has 2n-1 combinations. If each Z has a characteristic function f(Z), the Shapley value of ith player in F can be expressed as follows:
where -i denotes coalition of Z without the ith player; z denotes the number of coalition Z and 1 ≤ z ≤ n. In our proposed method, F is the set of MGs during voltage control, and the elements of F may change with time. f(Z) is the sum of rewards for all the MGs in Z. The reward for any MGi can be calculated based on the Shapley value sh(i) in Eq. 19.
During the interaction process between the DSO and MGs, DSO makes the incentive mechanism first and estimates the voltage improvement under MGs’ bidding strategies, based on the method in Data-Driven Parameter Identification of Distribution Networks. Then, it provides each MG with a corresponding subsidy based on the Shapley allocation principle. Each MG updates strategies based on its own subsidy and bidding strategies of other MGs at the last iteration until none of it changes strategies. The DSO and MGs repeat the previous process until the DSO gets the incentive mechanism that can effectively motivate MGs to participate in voltage control while avoiding unnecessary economic losses, meaning the DSO gets a reasonable value of α in the bidding game with the MGs.
MG Modeling
As providers of voltage control auxiliary services in distribution networks, MGs make decisions in the non-cooperative static game model with incomplete information. More concretely, all the MGs make decisions simultaneously without knowing other MGs’ strategies. Moreover, given that the competition and conflicts of interest always exist among MGs, MGs cannot expose all their information for the purpose of privacy. For any MGi, it provides voltage support while maximizing its own benefits by regulating the increment of power at its PCC, denoted by ΔSMGi = ΔPMGi + jΔQMGi. MGi defines its objective function as follows:
where SubsidyMGi (ΔSMGi) is the subsidy provided by DSO to MGi, which can be calculated by Eq. 19 in Data-Driven Parameter Identification of Distribution Networks. cgrid(ΔSMGi) and cmg(ΔSMGi) denote the cost from the grid and inside MGi, respectively.
In order to guarantee the privacy and fairness of MGs and meanwhile reduce the communication burden, only a little key information is shared among the DSO and MGs in the proposed game model. For any MGi, information including only its own subsidy and strategies of other MGs at the last iteraton is provided by DSO to MGi. But the topological locations of other MGs and voltage profiles in distribution networks are not required. Moreover, each MG provides only power increment at its PCC to DSO, without cost information. In this way, the fairness of competition is satisfied and the transferred information is reduced to fasten the response speed of voltage control systems. Taking the kth iteration as an example, Figure 2 shows data streams between DSO and MGs. In Figure 2,
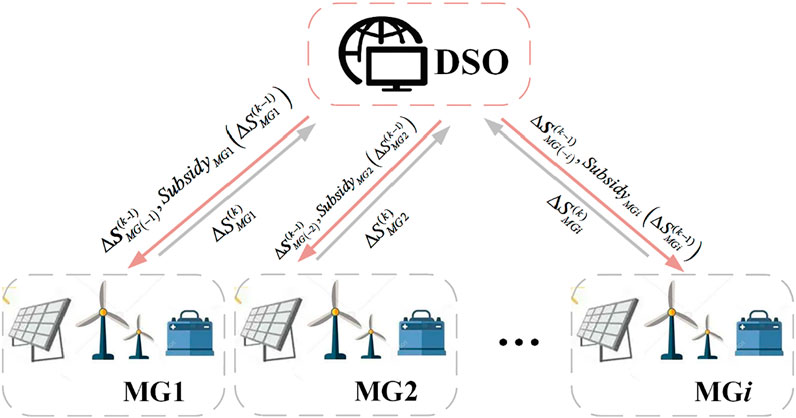
FIGURE 2. Data streams between DSO and MGs.
DRL-Based Dynamic Decision-Making of MGs
Each MG cannot obtain an accurate mathematical model of its objective function only based on key information provided by DSO (Eq. 20). With the emergence of AI techniques, the DRL algorithm enables the formulation of the game model with updating strategies and provides a potentially effective insight to address the DSO–MG dynamic game model with incomplete information. Therefore, a DRL-based decision-making method of MGs is proposed in ancillary markets.
Different from reinforcement learning, DRL uses neural networks to fit functions, replacing the complex iterative process of the Bellman equation with a neural network training process. The basic components of DRL include state, a set of states that characterize the environment; action, a set of actions for agents; and reward, rewards for the agent. The environment provides the agent with its state
The action of MGi at the kth iteration can be expressed as follows:
The reward for MGi is the profits at the kth iteration during voltage control, denoted by ri as follows:
In order to maximize ri, MGi needs to seek the optimal action ai under state si. Since the incentive mechanism and voltage profiles of distribution networks are unknown for MGs, each MG cannot calculate its profit accurately using Eq. 20. Therefore, for MGi, an action value function
To maximize profits, each MG needs to make the optimal action according to the current state. Therefore, without perfect information, an actor-critic-based method is proposed for MG to make decisions. The actor-critic algorithm uses two separate networks, namely, the critic network and the actor network, to approximate the critic function Q(
Critic Network Training
For the critic network, the parameter
where yi is the Q target approximation, which means the net profit profit(ΔSMGi) (Eq. 26) of MGi in this study; E (•) is the expectation function.
The gradient of
where
The
where
Actor Network Training
The actor network provides
where
In the voltage control method proposed, each MG makes its bidding strategy based on its own actor-critic algorithm, so its parameter setting is autonomous. In order to prevent the local optimum, the experience replay mechanism in deep Q networks is used. By storing {si, ai, ri} of each iteration, the replay buffer D is formed. During the training, a random sample of size M is extracted from D at a time, and the network parameters are updated based on the gradient rule. The random sample makes the update more accurate. Figure 3 shows the flowchart of DRL-based dynamic decision-making of MGi. For the actor network, the input is
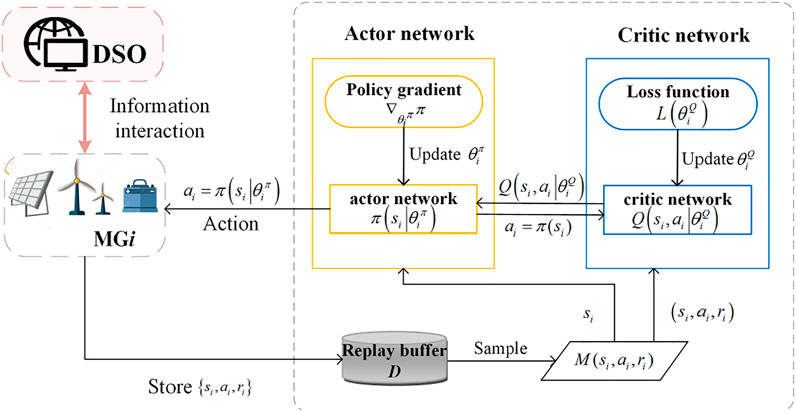
FIGURE 3. Flowchart of DRL-based dynamic decision-making of MGi.
Case Studies
Application in a Modified IEEE 33-Node System
To demonstrate the effectiveness of the proposed method, case studies are carried out in a modified IEEE 33-node distribution network, as shown in Figure 4. There are three MGs involved in voltage control, located at nodes 8, 26, and 28, respectively. Two biomass generations are located at node 11 and node 22. The negative power of PCCs means that the MG injects power into the grid, and vice versa. In the case studies, the voltage constraint is (0.96, 1.04), and namely, ΔVerr = 0.04.
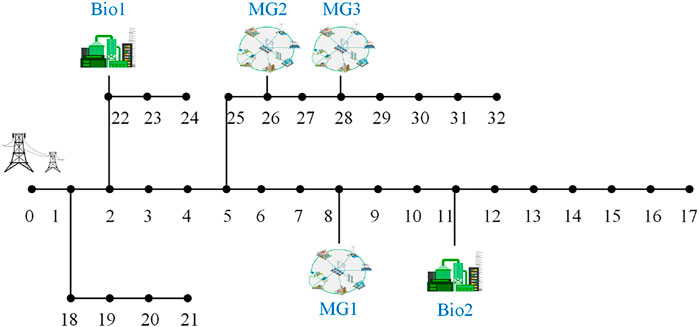
FIGURE 4. Modified IEEE 33-node distribution network.
Data-Driven Voltage Estimation
Operation measurement data of distribution systems used in case studies are based on Monte Carlo simulation. Parameters are regressed using the training dataset, and the accuracy of voltage estimation is tested using the newly generated testing dataset. The size of the training dataset is 3,000, and the size of the testing dataset is 500. In the Monte Carlo simulation, the load consumption is calculated from the preset load consumption multiplied by a factor randomly drawn from a uniform distribution over the interval. The intervals of active and reactive consumption are (0.8, 1.2) and (0.15, 0.25), respectively. The fluctuation range of load is generated by random fluctuation.
Figure 5 shows the calculation errors for the branch resistance and reactance in the test distribution networks. The maximum error values of resistance and reactance are -2.294% of branch L(4,5) and -0.77% of branch L(24,25), respectively. Based on the newly generated testing dataset, the voltage estimation error is shown in Figure 6. Therefore, as Figures 5, 6 show, the small errors demonstrate the effectiveness of the proposed data-driven voltage estimation method, satisfying the accuracy requirement of the voltage control system in distribution networks.
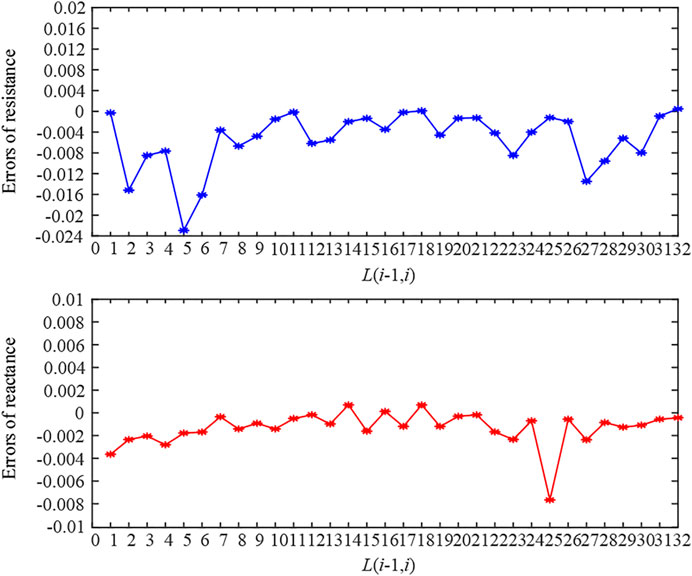
FIGURE 5. Errors of branch resistance and reactance.
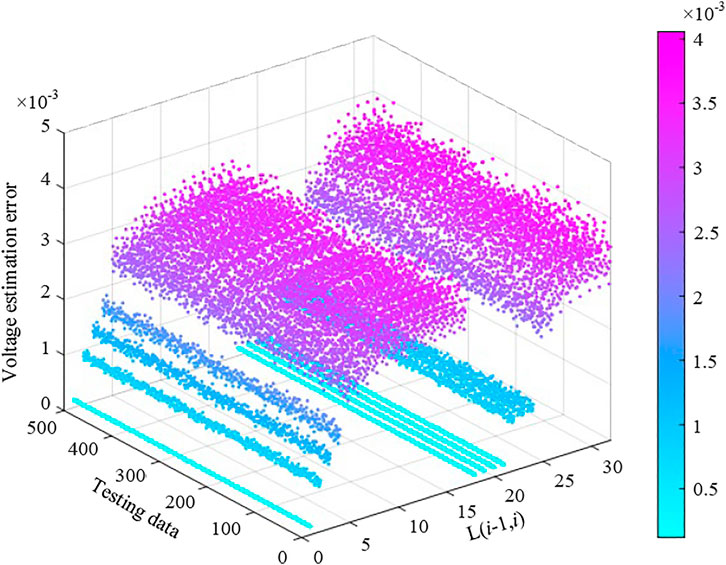
FIGURE 6. Voltage estimation error.
Voltage Control Method With MGs in Ancillary Markets
The proposed voltage control method with the participation of MGs is analyzed in this section. The large R/X ratio in distribution networks makes the effect of active power changes on voltages larger than that of reactive power to some degree. Hence, this study focuses on active power variations of MGs. In the actor-critic algorithm of MGs’ decision-making, both the actor network and critic network have two hidden layers, and the number of neurons in each layer is 64. Rectified non-linearity (ReLU) is used as the activation function for all hidden layers. The learning rate of the actor network is 0.0001, and the learning rate of the critic network is 0.001. The size of the experience replay buffer D is 1,000, and the experience sampling size M is 800 at each iteration.
Taking a certain time with voltage levels exceeding the upper limit as an example, the power of MGs and biomass generations at that time are listed in Table 1. At this moment, the largest nodal voltage value is V28 = 1.06562. When voltage excursion occurs, the DSO starts the game bidding process of voltage control. The three MGs make their final decisions after iterations. After about 700 bidding steps, three MGs converge to the equilibrium and control the voltage profiles within the preset reasonable range. The whole process takes 13.30 s. After voltage control, the voltage profile is shown in Figure 7 with V28 = 1.02986, α = 8, and the specific information of the game bidding among MGs is shown in Table 2. The actions and corresponding rewards of MGs at every bidding step are shown in Figure 8. In the proposed method, MGs approximate their profits using the Q function based on incomplete information. Therefore, in order to verify the approximation ability of the Q function, the Loss in Eq. 25 of each bidding step is shown in Figure 9. As shown, the Loss values gradually decrease and are finally close to 0. This indicates that the Q function can track MG profits and guide MGs to optimize their profits based on only key information effectively.
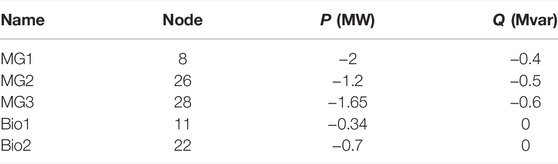
TABLE 1. Injected power of MGs and biomass generations.
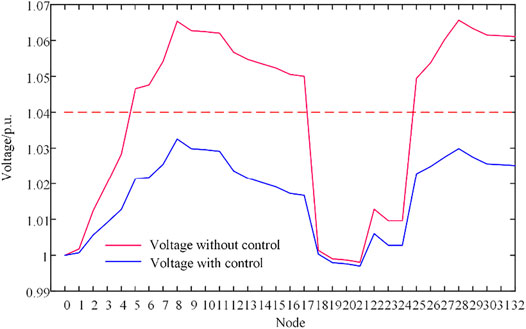
FIGURE 7. Voltage profiles without and with control.
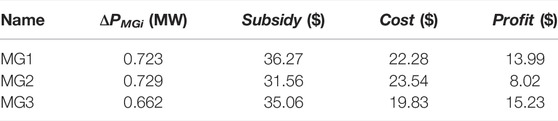
TABLE 2. Information of the final decision.
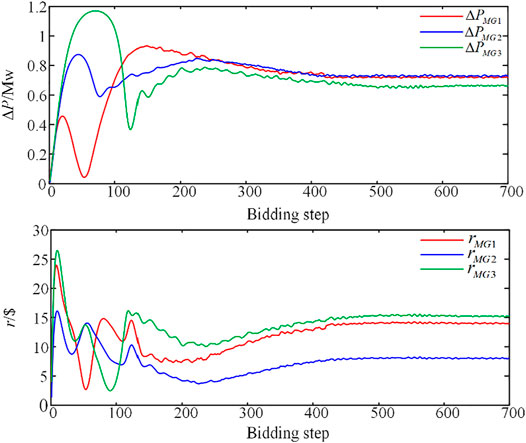
FIGURE 8. Actions and profits of MGs in the bidding process.
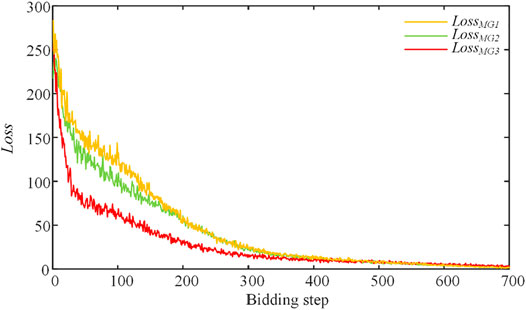
FIGURE 9. Loss value in the bidding process.
The proposed voltage control is based on data-driven voltage estimation. Therefore, there is a certain deviation between the estimated voltage in the proposed method and the actual voltage. Figure 10 shows errors of voltage magnitude between estimated and actual voltage profiles after voltage control. As shown, the maximum voltage magnitude error appears at node 28 and is equal to 0.036%. Obviously, the small errors demonstrate the effectiveness of the proposed voltage estimation method in distribution networks.
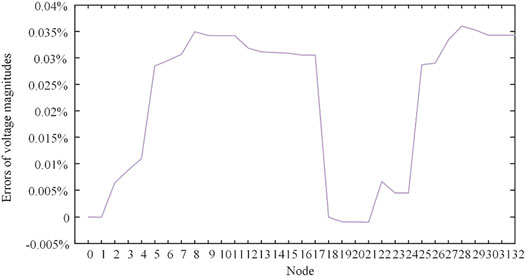
FIGURE 10. Errors of voltage magnitude between estimated and actual voltage profiles.
A reasonable α value in Eq. 18, defined by the DSO, can motivate MGs to participate in voltage control efficiently and also avoid unnecessary expenses of DSO. In the aforementioned case, voltage control effects under different values of α are shown in Figure 11. Moreover, the total rewards provided by the DSO in different α are RDSO = 38.49$ at α = 6, RDSO = 102.89$ at α = 8, and RDSO = 276.40$ at α = 10, respectively. When α < 8, MGs do not receive enough subsidies to motivate demand response for voltage control. Oppositely, when α > 8, all the nodal voltages are within limits, but DSO needs to pay more. Thus, the DSO chooses α = 8 in the previous case.
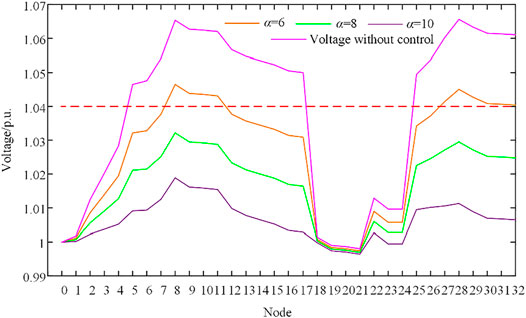
FIGURE 11. Voltage control effects for different α-values.
Application in a Modified IEEE 123-Node System
The modified IEEE 123-node distribution networks, with 4 MGs located at nodes 24, 26, 87, and 91, respectively, are shown in Figure 12. In voltage estimation, calculation errors for resistance and reactance are shown in Figure 13A. The maximum error values of resistance and reactance are -3.127% of branch L(64,65) and 1.979% of branch L(61,62), respectively. Based on the newly generated testing dataset, the voltage estimation error is shown in Figure 13B. Taking a certain time with voltage levels exceeding the upper limit as an example, the largest nodal voltage value is V84 = 1.06445. After about 800 bidding steps, voltage profiles have been controlled into the preset reasonable range with taking 23.719 s. The voltage profiles before and after voltage control are shown in Figure 13C. The actions and corresponding rewards of MGs at every bidding step are shown in Figure 13D. Obviously, this case demonstrates the effectiveness of the proposed voltage control method in a large-scale distribution network.
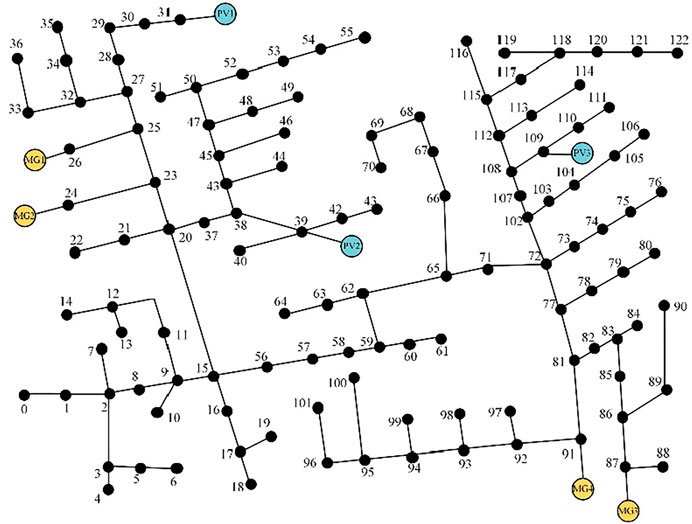
FIGURE 12. A modified IEEE 123-node distribution network.
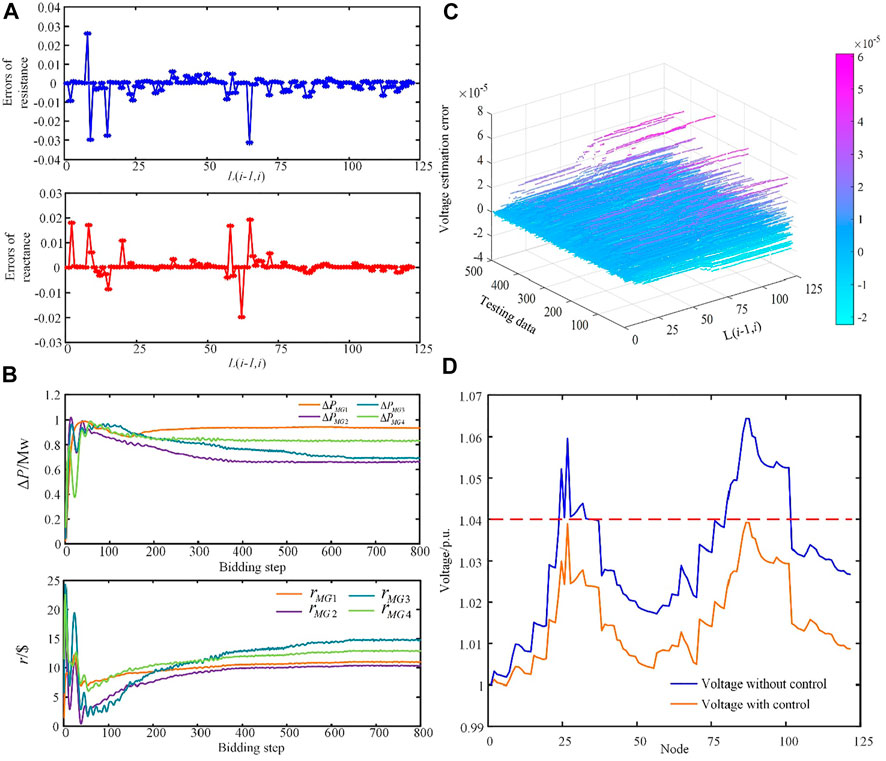
FIGURE 13. (A) Errors of branch resistance and reactance. (B) Voltage estimation error. (C) Actions and profits of MGs in the bidding process. (D) Voltage profiles without and with control.
Conclusion
In this study, a data-driven fast voltage control method in distribution networks with MGs is proposed. To cope with the incomplete information, voltage profiles are estimated by identifying the true network parameters based on historical non-DPMU measurements. This method utilizes a linear model that approximates the non-linear relation between the voltage magnitude and nodal injected power. Results in case studies show that both line parameters and voltage profiles in distribution networks can be accurately estimated with maximum errors −3.12 and 0.39%, respectively. The small errors indicate the proposed voltage estimation can provide effective theoretical support to voltage control with MGs. Subsequently, to encourage the independent MGs to participate in voltage control, a game bidding model is established between DSO and MGs. In MGs’ decision-making process, only key information is shared among DSO and MGs, which guarantees the participants’ privacy and decreases the communication burden simultaneously. With incomplete information, each MG optimizes its bidding strategy based on a data-driven DRL algorithm. Compared with conventional methods, the proposed data-driven voltage control requires less measurement data and calculation time. Meanwhile, under incentives, MGs are utilized to provide voltage control support, increasing the energy and asset utilization of distribution networks. For future work, we can extend the proposed voltage control method to more complex distribution networks and combine dynamic planning and real-time control together (Han et al., 2018b). In this way, distribution network operation and control systems can take full advantage of various voltage controllers with different characteristics, which will increase energy utilization.
Data Availability Statement
The raw data supporting the conclusion of this article will be made available by the authors, without undue reservation.
Author Contributions
XW contributed toward supervision, conceptualization, and writing—review and editing. YR contributed toward methodology, software, data curation, and writing—original draft. DL contributed toward writing—review and editing. YZ contributed toward data curation. YL and BG contributed toward editing.
Funding
This work was supported by the State Key Laboratory of Reliability and Intelligence of Electrical Equipment (No. EERI_0Y2021008); Hebei University of Technology, China Postdoctoral Science Foundation (Grant: 2021T140174); the Natural Science Foundation of Hebei province (Grant: E2021202053); Humanities and Social Science Research Project of Hebei Education Department (Grant: BJ2020036); and the Natural Science Foundation of Tianjin (Grant: 19JCQNJC06300).
Conflict of Interest
BG was employed by Qinghai Huanghe Intelligent Energy Co., Ltd.
The remaining authors declare that the research was conducted in the absence of any commercial or financial relationships that could be construed as a potential conflict of interest.
Publisher’s Note
All claims expressed in this article are solely those of the authors and do not necessarily represent those of their affiliated organizations, or those of the publisher, the editors, and the reviewers. Any product that may be evaluated in this article, or claim that may be made by its manufacturer, is not guaranteed or endorsed by the publisher.
References
Cao, D., Zhao, J., Hu, W., Ding, F., Huang, Q., Chen, Z., et al. (2021). Data-driven Multi-Agent Deep Reinforcement Learning for Distribution System Decentralized Voltage Control with High Penetration of Pvs. IEEE Trans. Smart Grid 12 (5), 4137–4150. doi:10.1109/TSG.2021.3072251
Chen, Y. C., Wang, J., Dominguez-Garcia, A. D., and Sauer, P. W. (2016). Measurement-based Estimation of the Power Flow Jacobian Matrix. IEEE Trans. Smart Grid 7 (5), 2507–2515. doi:10.1109/TSG.2015.2502484
Dasgupta, K., and Soman, S. A. (20132013). Line Parameter Estimation Using Phasor Measurements by the Total Least Squares Approach. IEEE Power Energ. Soc. Gen. Meet. 1, 1–5. doi:10.1109/PESMG.2013.6672179
Dharmawardena, H., and Venayagamoorthy, G. K. (2021). A Distributed Data‐driven Modelling Framework for Power Flow Estimation in Power Distribution Systems. IET Energ. Syst. Integration 3 (3), 367–379. doi:10.1049/esi2.12035
Du, Y., Zandi, H., Kotevska, O., Kurte, K., Munk, J., Amasyali, K., et al. (2021). Intelligent Multi-Zone Residential Hvac Control Strategy Based on Deep Reinforcement Learning. Appl. Energ. 281, 116117. doi:10.1016/j.apenergy.2020.116117
Espina, E., Llanos, J., Burgos-Mellado, C., Cardenas-Dobson, R., Martinez-Gomez, M., and Saez, D. (2020). Distributed Control Strategies for Microgrids: an Overview. IEEE Access 8, 193412–193448. doi:10.1109/ACCESS.2020.3032378
Gao, X., Chan, K. W., Xia, S., Zhang, X., Zhang, K., and Zhou, J. (2021). A Multiagent Competitive Bidding Strategy in a Pool-Based Electricity Market with Price-Maker Participants of WPPs and EV Aggregators. IEEE Trans. Ind. Inf. 17 (11), 7256–7268. doi:10.1109/TII.2021.3055817
Gao, Y., Wang, W., and Yu, N. (2021). Consensus Multi-Agent Reinforcement Learning for Volt-Var Control in Power Distribution Networks. IEEE Trans. Smart Grid 12 (4), 3594–3604. doi:10.1109/TSG.2021.3058996
Han, T., Chen, Y., and Ma, J. (2018). Multi‐objective Robust Dynamic VAR Planning in Power Transmission Girds for Improving Short‐term Voltage Stability under Uncertainties. IET Generation, Transm. Distribution 12 (8), 1929–1940. doi:10.1049/iet-gtd.2017.1521
Han, T., Chen, Y., Ma, J., Zhao, Y., and Chi, Y.-y. (2018). Surrogate Modeling-Based Multi-Objective Dynamic VAR Planning Considering Short-Term Voltage Stability and Transient Stability. IEEE Trans. Power Syst. 33 (1), 622–633. doi:10.1109/TPWRS.2017.2696021
Huo, Y., Li, P., Ji, H., Yan, J., Song, G., Wu, J., et al. (2021). Data-driven Adaptive Operation of Soft Open Points in Active Distribution Networks. IEEE Trans. Ind. Inf. 17 (12), 8230–8242. doi:10.1109/TII.2021.3064370
IEEE PES Industry Technical Support Task Force (2018). Impact Of IEEE 1547 Standard On Smart Inverters IEEE, PES-TR67. Available at https://resourcecenter.ieee-pes.org/publications/technical-reports/PES-TR0067-5-18/.
Jiang, T. (2021). Guest Editorial: Artificial Intelligence and Data Analytics for Smart Grids with High Penetrations of Renewables. IET Energ. Syst. Integration 3 (3), 223–226. doi:10.1049/esi2.12040
Liu, H., and Wu, W. (2021). Online Multi-Agent Reinforcement Learning for Decentralized Inverter-Based Volt-Var Control. IEEE Trans. Smart Grid 12 (2), 2980–2990. doi:10.1109/TSG.2021.3060027
Liu, Y., Guo, L., Hou, R., Wang, C., and Wang, X. (2021). A Hybrid Stochastic/robust-Based Multi-Period Investment Planning Model for Island Microgrid. Int. J. Electr. Power Energ. Syst. 130, 106998. doi:10.1016/j.ijepes.2021.106998
Liu, Y., Guo, L., and Wang, C. (2018). A Robust Operation-Based Scheduling Optimization for Smart Distribution Networks with Multi-Microgrids. Appl. Energ. 228, 130–140. doi:10.1016/j.apenergy.2018.04.087
Liu, Y., Zhang, N., Wang, Y., Yang, J., and Kang, C. (2019). Data-driven Power Flow Linearization: a Regression Approach. IEEE Trans. Smart Grid 10 (3), 2569–2580. doi:10.1109/TSG.2018.2805169
Pappu, S. J., Bhatt, N., Pasumarthy, R., and Rajeswaran, A. (2018). Identifying Topology of Low Voltage Distribution Networks Based on Smart Meter Data. IEEE Trans. Smart Grid 9 (5), 5113–5122. doi:10.1109/TSG.2017.2680542
Sansawatt, T., Ochoa, L. F., and Harrison, G. P. (2012). Smart Decentralized Control of Dg for Voltage and thermal Constraint Management. IEEE Trans. Power Syst. 27 (3), 1637–1645. doi:10.1109/TPWRS.2012.2186470
Taousser, F. Z., Olama, M. M., Djouadi, S. M., Tomsovic, K., Zhang, Y., and Xue, Y. (2020). Model Predictive Control for Voltage Restoration in Microgrids Using Temporal Logic Specifications. IET Energ. Syst. Integr. 2 (2), 207–214. doi:10.1049/iet-esi.2019.0135
Tu, C., He, X., Shuai, Z., and Jiang, F. (2017). Big Data Issues in Smart Grid - A Review. Renew. Sustainable Energ. Rev. 79 (12), 1099–1107. doi:10.1016/j.rser.2017.05.134
Wang, W., Yu, N., Gao, Y., and Shi, J. (2020). Safe Off-Policy Deep Reinforcement Learning Algorithm for Volt-Var Control in Power Distribution Systems. IEEE Trans. Smart Grid 11 (4), 3008–3018. doi:10.1109/TSG.2019.2962625
Wang, X., Bialek, J. W., and Turitsyn, K. (2018). Pmu-based Estimation of Dynamic State Jacobian Matrix and Dynamic System State Matrix in Ambient Conditions. IEEE Trans. Power Syst. 33 (1), 681–690. doi:10.1109/TPWRS.2017.2712762
Wang, X., Wang, C., Xu, T., Guo, L., Fan, S., and Wei, Z. (2018). Decentralised Voltage Control with Built‐in Incentives for Participants in Distribution Networks. IET Generation, Transm. Distribution 12 (3), 790–797. doi:10.1049/iet-gtd.2017.0487
Wang, X., Wang, C., Xu, T., Guo, L., Li, P., Yu, L., et al. (2018). Optimal Voltage Regulation for Distribution Networks with Multi-Microgrids. Appl. Energ. 210, 1027–1036. doi:10.1016/j.apenergy.2017.08.113
Wang, Z., Chen, B., Wang, J., Begovic, M. M., and Chen, C. (2015). Coordinated Energy Management of Networked Microgrids in Distribution Systems. IEEE Trans. Smart Grid 6 (1), 45–53. doi:10.1109/TSG.2014.2329846
Xu, H., Dominguez-Garcia, A. D., and Sauer, P. W. (2019). Data-driven Coordination of Distributed Energy Resources for Active Power Provision. IEEE Trans. Power Syst. 34 (4), 3047–3058. doi:10.1109/TPWRS.2019.2899451
Xu, H., Dominguez-Garcia, A. D., Veeravalli, V. V., and Sauer, P. W. (2020). Data-driven Voltage Regulation in Radial Power Distribution Systems. IEEE Trans. Power Syst. 35 (3), 2133–2143. doi:10.1109/TPWRS.2019.2948138
Yan, Z., and Xu, Y. (2019). Data-Driven Load Frequency Control for Stochastic Power Systems: A Deep Reinforcement Learning Method With Continuous Action Search. IEEE Trans. Power Syst. 34 (2), 1653–1656. doi:10.1109/TPWRS.2018.2881359
Yu, J., Weng, Y., and Rajagopal, R. (2019). PaToPaEM: A Data-Driven Parameter and Topology Joint Estimation Framework for Time-Varying System in Distribution Grids. IEEE Trans. Power Syst. 34 (3), 1682–1692. doi:10.1109/TPWRS.2018.2888619
Zhang, J., Chen, Z., He, C., Jiang, Z., and Guan, L. (2019). Data-Driven-Based Optimization for Power System Var-Voltage Sequential Control. IEEE Trans. Ind. Inf. 15 (4), 2136–2145. doi:10.1109/TII.2018.2856826
Keywords: voltage control, non-DPMU distribution networks, data-driven, ancillary services, incomplete information
Citation: Wang X, Rong Y, Liang D, Zhao Y, Liu Y and Gu B (2022) Data-Driven Fast Voltage Control in Non-DPMU Distribution Networks With Microgrids. Front. Energy Res. 10:865377. doi: 10.3389/fenrg.2022.865377
Received: 29 January 2022; Accepted: 21 March 2022;
Published: 26 April 2022.
Edited by:
Yue Zhou, Cardiff University, United KingdomReviewed by:
Yanbo Chen, North China Electric Power University, ChinaWei Zhou, Dalian University of Technology, China
Copyright © 2022 Wang, Rong, Liang, Zhao, Liu and Gu. This is an open-access article distributed under the terms of the Creative Commons Attribution License (CC BY). The use, distribution or reproduction in other forums is permitted, provided the original author(s) and the copyright owner(s) are credited and that the original publication in this journal is cited, in accordance with accepted academic practice. No use, distribution or reproduction is permitted which does not comply with these terms.
*Correspondence: Dong Liang, bGlhbmdkb25nQGhlYnV0LmVkdS5jbg==