 Esmail Ansari
 Eugene Holubnyak
 Franciszek Hasiuk
 Jennifer Raney
95% of researchers rate our articles as excellent or good
Learn more about the work of our research integrity team to safeguard the quality of each article we publish.
Find out more
HYPOTHESIS AND THEORY article
Front. Energy Res. , 27 May 2022
Sec. Carbon Capture, Utilization and Storage
Volume 10 - 2022 | https://doi.org/10.3389/fenrg.2022.864013
This article is part of the Research Topic Developments in Reservoir Characterization for Carbon Dioxide Sequestration View all 8 articles
There is a renewed interest in carbon capture, utilization, and storage technology due to recently expanded US Internal Revenue Service 45Q credits as well as to reduce anthropogenic carbon emissions to the atmosphere. Deep carbonate reservoirs in western Kansas have the potential for CO2 storage because they have experienced low waste-fluid injection volumes to date. Waste-fluid injection in Kansas has not caused felt seismicity for more than seven decades. However, beginning in 2013, the state has experienced increased seismicity due to increased subsurface pressure associated with the injection of large volumes of variable-TDS (total dissolved solids) waste-fluid in US EPA Class I and Class II wells. This work compares CO2, low-TDS, and high-TDS injection practices and quantifies the induced spatial and temporal patterns in overpressure in the caprock, reservoir, and its hydraulically connected crystalline basement, where the majority of induced seismicity in Kansas has been observed. Our results show that pressure buildup is higher in the caprock and lower in the crystalline basement when injecting CO2 as compared to variable-TDS waste-fluid injection. The CO2 plume tends to expand at the top of the reservoir, primarily due to its lower density and viscosity than reservoir brines, creating an overpressure plume that moves the resident brine across the caprock. In contrast, waste-fluid injection moves more resident brine down into the basement, particularly when high-TDS waste-fluid is injected. This result is particularly valid for high-permeability carbonate reservoirs, in which gravity forces dominate over viscous forces and move the CO2 and overpressure plume toward the top of the reservoir. Our study may explain the lack of human-perceivable induced seismicity at operating CO2 injection projects globally.
• CO2 injection causes higher overpressure in the caprock and lower overpressure in the crystalline basement
• Variable-TDS waste-fluid causes lower overpressure in the caprock and higher overpressure in the crystalline basement
• The risk of induced-seismicity can be lower for CO2 injection compared to waste-fluid injection
Carbon storage in deep saline reservoirs can reduce anthropologic CO2, mitigate global warming, and support a carbon-negative economy. In the United states , there is a renewed interest in carbon capture, utilization, and storage (CCUS) technology due to recently expanded US Internal Revenue Service 45Q credits and multiple other initiatives (Eames and Lowman, 2018; EFI, 2018). For CCUS to be a meaningful component in reducing CO2 emissions and concomitant global warming, it must operate at a large scale [on the order of 3.5 billion tonnes of CO2 per year, an amount roughly equivalent to the annual global oil production (Zoback and Gorelick, 2012)]. However, concerns have been raised that such large-scale CO2 injection may induce seismicity, as has been observed during the injection of denser waste-fluids such as brine and thus jeopardize caprock integrity, causing CO2 leakage to the surface (Zoback and Gorelick, 2012). Deep saline reservoirs are a primary target for waste-fluid and CO2 disposal because they are ubiquitous and can offer the needed large-scale storage and injectivity rates (Celia et al., 2015). Some of these reservoirs, however, are in pressure and fluid communication with the Precambrian crystalline basement, where some existing faults are in critical equilibrium and can slip under small pressure changes, triggering seismicity (Keranen and Weingarten, 2018). Recent seismicity across the US Midcontinent induced by large-scale waste-fluid disposal has renewed concerns about induced seismicity for large-scale CO2 storage (White and Foxall, 2016). The increase in US Midcontinent seismicity has been attributed to injection brines from United States Environmental Protection Agency Class I and Class II wells (Weingarten et al., 2015). Class I wells inject low-TDS hazardous and non-hazardous waste-fluid from municipal and industrial sources, which often has lower density than the formation brine. Class II wells inject high-TDS waste-fluid coproduced from oil and gas operations, which often has higher density than the resident formation brine. Almost all of the US Midcontinent seismicity has occurred in the Precambrian basement (median depth of 4.5 km into the basement (Schoenball and Ellsworth, 2017)) and not in the sedimentary cover, which is between 0.15 and 1.5 km thick across Kansas. Small pressure changes (100 kPa) in the basement are known to induce seismicity (Hornbach et al., 2015; Langenbruch et al., 2018). Unlike seismicity associated with waste-fluid injection, no publicly felt earthquakes (M3+) have been linked to CO2 injection projects to date. However, microseismic events have been reported at many CO2 injection projects–Aneth, Weyburn, Otway, Illinois Basin-Decatur Project. For example, the In-Salah project (Algeria), where a significant well head injection pressure (>15 MPa) was linked to CO2 injection (0.5 Mt/year), is known to have induced 9,500 microseismic events (Goertz-Allmann et al., 2014; Stork et al., 2015).
A second concern associated with CO2 and waste-fluid injection is leakage to shallower formations or the surface through existing or induced fluid pathways in the caprock (e.g., fractures, faults) or the wellbore. To study the risk of seismicity and leakage associated with waste-fluid or CO2 injection, we investigated the pressure increase (overpressure) due to fluid movement into geological layers that were not initially determined as injection targets (i.e., caprock and basement).
Three stacked and separate saline carbonate units in Kansas are the research targets for CO2 storage: the Osage Limestone, the Viola Limestone and the Arbuckle Group. These units are separated by thick shales and are hydraulically isolated. The depth of the Osage and the Viola formations in the Patterson field, a study area for CO2 storage located in western Kansas, are in the range of 1603–1645 m and 1676–1737 m, respectively. The Osage is capped by low-porosity Mississippian-aged limestones and Pennsylvanian-aged shales. The Viola Limestone is overlain by the Maquoketa Shale caprock. The bottommost Arbuckle aquifer has a depth of 1750–1930 m, a pressure of 11.82 MPa, a temperature of 45–50°C (Ansari, 2019), and is isolated from the Viola Limestone by Simpson Group shale caprocks (∼50 m thick). The Arbuckle aquifer is studied in this work because it is a common waste-fluid disposal zone, it overlies the crystalline basement, and is sealed by a caprock. Figure 1 shows a schematic of fluid movement in a reservoir overlain by a caprock and underlain by crystalline basement and illustrates similarities between CO2, low-TDS waste-fluid, and high-TDS waste-fluid injection. The contrast in the resident formation brine and injection fluid properties (density, viscosity, and compressibility) creates different pressure profiles for each scenario. For deep reservoirs (3000 m), the density of supercritical CO2 is generally in the range of 479–733 kg/m3. In contrast, the density of formation water (reservoir or produced waters) ranges between 945 and 1202 kg/m3 (Nordbotten et al., 2005). Supercritical CO2 has a density of
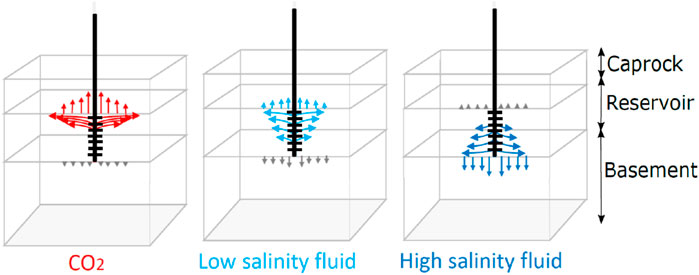
FIGURE 1. Comparison of CO2 injection (red) with low-TDS (cyan) and high-TDS (dark blue) waste-fluid injection. CO2, like low-TDS waste-fluid, has a lower density than the resident brine. When the injection brine has a higher density than the resident brine, as in high-TDS waste-fluid, the injected brine sinks to the base of the reservoir and moves more fluid into the basement along faults compared with CO2 or low-TDS waste-fluid injection.
This paper compares the pressure increase (i.e., overpressure,
To compare the three scenarios, we used typical data on the Arbuckle group reservoir obtained from core and well log analysis, and well test interpretation (Fazel Alavi, 2015; Holubnyak et al., 2017; Ansari, 2019). We assumed a homogenous model confined with an overlying caprock and an underlying crystalline basement (Figure 2). The model has lengths of 14 km, 14 km, and 850 m in the X, Y and Z directions, and is divided into 31, 31, and 35 grid blocks in each direction, respectively. The model is connected to an analytical aquifer with leakage (Carter-Tracy model; Dake, 1983) at its external bottom and side boundaries to represent the infinite extent of the caprock, reservoir, and the crystalline basement. We then relax the infinite-extent assumption and consider a finite reservoir bounded by a finite caprock and crystalline basement.
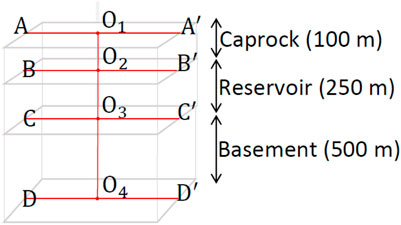
FIGURE 2. Synthetic model used in this study. Spatial overpressure profiles were simulated along the wellbore (O1–O4), in the caprock (A–A′), at the caprock-reservoir interface (B–B′), at the reservoir-basement interface (C–C′), and in the basement (D–D′) at shut-in time (25 years). Temporal overpressure profiles were simulated at points
The crystalline basement in intraplate regions has a bulk permeability of ∼10−17–10−16 m2 over length scale of 1–10 km, three to four orders of magnitude higher than that measured on core samples (Townend and Zoback, 2000). Similarly, although the measured core permeability of caprock is generally low (∼10−20–10−18 m2), overpressure plumes can horizontally reach distances of tens to hundreds of kilometers within 30–50 years. Because of the existence of discontinuities (e.g., fracture and faults) at these spatial scales, the effective permeability of the caprock can be two orders of magnitude larger than that measured at core scales (e.g., up to 10−16 m2) (Neuzil, 1994; Birkholzer and Zhou, 2009). Arbuckle reservoir porosity and permeability are based on fall-off test data (Ansari, 2019). The permeability and porosity of the analytical aquifers connected to the external boundaries of the model are equal to their adjacent numerical grid.
Table 1 summarizes the parameters used for the simulations. The Arbuckle reservoir in Western Kansas has a pressure of
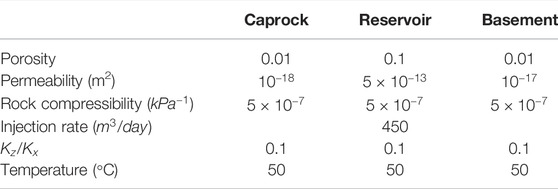
TABLE 1. Material properties of the rock types in Figure 2.
Relative permeability and capillary pressure data (Figure 3) are based on the small-scale field study of the Arbuckle Group reservoir in the Wellington Field, south-central Kansas, and Cutter KGS #1 well, southwest Kansas, for which continuous coring, modern wireline well log data, including nuclear magnetic resonance (NMR) data, are available (Holubnyak et al., 2017). Continuous core data and NMR well logs were used to derive irreducible water saturations and capillary pressure curves. Based on the estimated end points, generic relative permeability curves were generated for the Arbuckle reservoir using a formula that correlates them to the end points and the reservoir quality index (RQI) (Fazel Alavi, 2015).
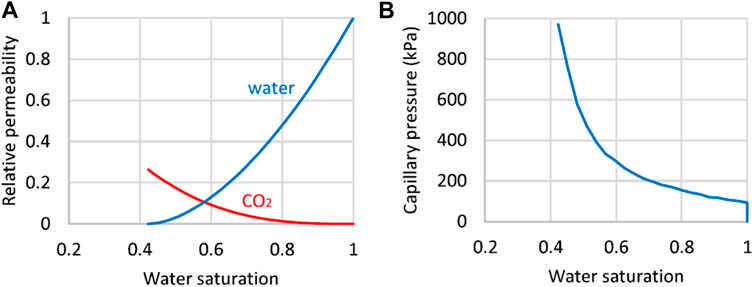
FIGURE 3. Relative permeability and capillary pressure curves for the carbonate Arbuckle reservoir (Fazel Alavi, 2015).
The injection is only into the reservoir (representing the Arbuckle Group reservoir), assuming fully penetrating wells. Each well injects at a bottom hole rate of 450 m3/day rate to obtain a commercial scale rate of 50 Mt (Million metric tons) per year in 25 years, which is planned to be injected using four wells into the Osage, the Viola and the Arbuckle reservoirs, assuming each accepts one-third of the total injection volume (i.e., four wells × 3 formations × 450 m3/day × 1000 kg/m3 × 365 days/year × 25 years ≈ 50 Mt water). The density of CO2 at the Patterson Field conditions, i.e., pressure of 11.82 MPa and temperature of 45–50°C, is
TABLE 2. TDS values used in the simulation runs.
Simulations were conducted using the Computer Modeling Group (CMG) GEM simulator (CMG-GEM User Manual, 2018), a full equation-of-state compositional reservoir simulator with advanced features for modeling the flow of three-phase, multicomponent fluids, that has been used to conduct numerous CO2 studies (Schuetter and Mishra, 2015; Mishra et al., 2017; Zulqarnain et al., 2020). This study assumes that the supercritical CO2 arrives at the base of the reservoir at reservoir temperature. In reality, supercritical CO2 arrives at the base of the injection well at a colder temperature than that of the formation brine, but the temperature effect in the simulation can be ignored because studies have shown that the cooling front extends only a few hundred meters from the injection well after decades of injection (Vilarrasa et al., 2019).
We simulated temporal overpressure profiles at several points along the wellbore (O1, O2, O3, and O4), as well as the spatial overpressure profiles at shut-in time (25 years) along the wellbore (O1–O4), and up to 1 km distance from the wellbore along several lines (A–A′, B–B′, C–C′ and D–D′, Figure 2).
Figure 4 shows simulation results comparing CO2 (equivalent mass and volume to that of water), low-TDS waste-fluid, and high-TDS waste-fluid injection into an Arbuckle reservoir after 25 years of injection at an industrial scale. The pressure diffuses away from the reservoir and into the numerical basement and subsequently into the analytical aquifer (bottom and side boundaries) when the pressure is high in each of the formations. In each case, the buoyancy force determined the overall overpressure distribution in the caprock, reservoir, and basement. When the injected brine has higher TDS than the resident brine, it sinks to the base of the reservoir and moves more pressure into the basement compared with when CO2 or low-TDS waste fluid are injected. In contrast, when the injected fluid TDS is lower than the resident brine, more fluid is displaced in the caprock. Thus, when injecting CO2 or low-TDS waste-fluid, the buoyancy force forms a pressure plume that floats at the top of the reservoir and subsequently into the caprock. In contrast, the high-TDS pressure plume tends to advance toward the base of the reservoir.
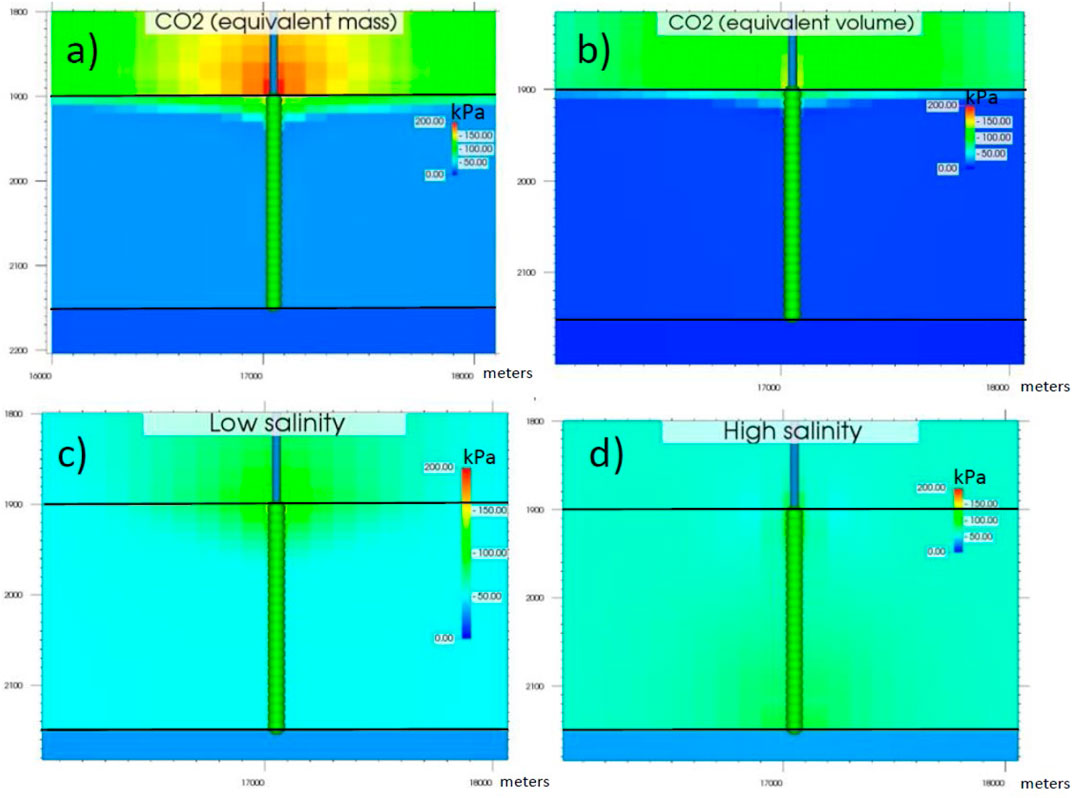
FIGURE 4. Overpressure plume (in kPa) at shut-in after 25 years of injection of (A) CO2 equivalent mass, (B) CO2 equivalent volume, (C) low-TDS waste-fluid, and (D) high-TDS waste-fluid. The thicker green section shows that the entire Arbuckle aquifer (250 m) is perforated in this study.
Because CO2 is less dense than water and is highly compressible and because pressure increase is governed by the injected volume, we compared injecting both mass-equivalent CO2 and volume-equivalent CO2 with waste-fluid injection to quantify the risks of each injection scenario. Our results indicated that mass-equivalent CO2 created maximum overpressure (200 kPa) in the caprock, followed by volume-equivalent CO2, which created 150 kPa overpressure in the caprock (also Figure 5). In contrast, high-TDS injection-induced minimum pressure buildup in the caprock (110 kPa) and maximum pressure buildup in the crystalline basement (
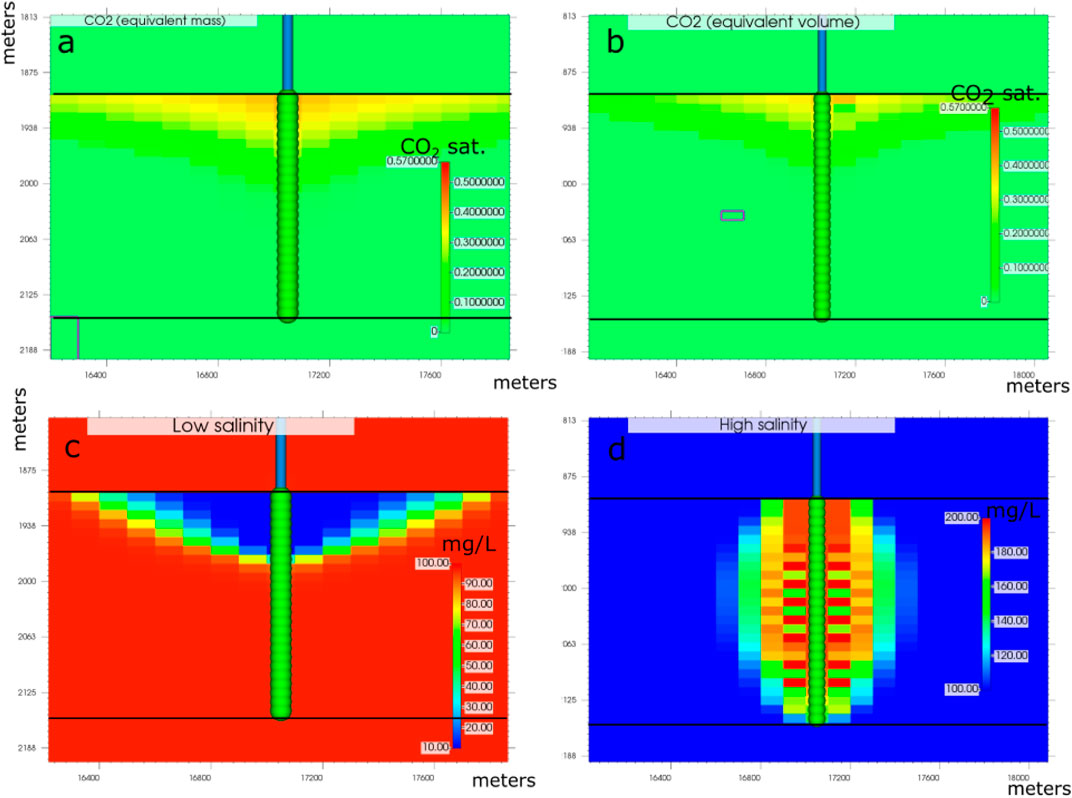
FIGURE 5. CO2 saturation and salinity profiles. The CO2 plume expands at the top of the aquifer because of its lower density. (A) CO2 saturation for equivalent-mass CO2 injection. (B) CO2 saturation for equivalent-volume CO2 injection. (C) salinity decrease (mg per liter) due to low-salinity waste-fluid injection. (D) salinity increase (mg per liter) due to high-salinity waste-fluid injection.
Figure 5 shows the CO2 saturation and salinity profiles in the caprock, the reservoir, and the basement. Most of the injected fluid remains in the reservoir because of the capillary effects and lower permeability of the caprock and the basement. The native brine, however, can easily move into the caprock or basement to compensate for the volume changes in the reservoir. The caprock overpressure from CO2 injection, and the basement overpressure from saline waste-fluid injection cause native brine movements into these formations. Five important system properties are responsible for the observed CO2 saturation, salinity, and overpressure distribution (Figures 4, 5): injectant density, injectant viscosity, injectant compressibility, injectant relative permeability, and capillary pressure. First, the density of injectant is the most important factor determining the movement of the CO2 and waste-fluid front and thus overpressure distribution. Supercritical CO2 density at the Arbuckle temperature and pressure is almost half that of water. The pressure increase follows injection volume and the volume of CO2 injected at equivalent mass is approximately two times that of waste-fluid. Second, the lower viscosity of supercritical CO2 moves the CO2 plume in the reservoir. Third, the injection overpressure is partially accommodated by the compressibility of the injected fluid as well as the reservoir. Supercritical CO2 is highly compressible compared to waste-fluids and creates less overpressure in the reservoir. Because waste-fluid is slightly compressible, its injection requires that an equivalent volume of fluid exit the boundaries of the reservoir and into the caprock/basement during injection. Fourth, at the beginning of injection and before a CO2-rich front with higher saturation and higher relative permeability is formed, CO2 has lower relative permeability than the resident brine and more pressure is needed to inject CO2 than the waste-fluid, which has a relative permeability almost that of resident brine. Fifth, once the capillary threshold is reached, the formation can drain the non-wet CO2 phase, while wastewater does not need to overcome the capillary pressure threshold because, similar to the resident brine, the wastewater is a wet phase.
Figure 6 shows the overpressure profile along the wellbore in the caprock, reservoir, and basement after 25 years of injection. Caprock overpressure for CO2 injection is always higher (
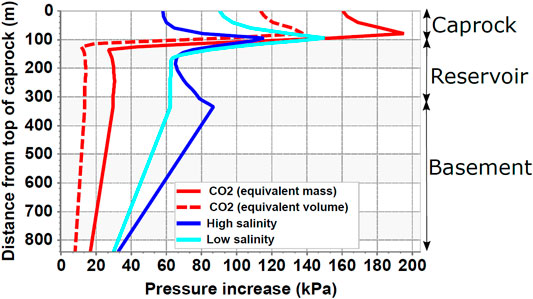
FIGURE 6. Overpressure profiles along the wellbore (O1–O4 in Figure 2) after 25 years of injection. The pressure increase in the caprock is highest for CO2 injection, while the pressure increase into the basement is highest for the high-TDS waste-fluid injection.
Figure 7 shows the overpressure through different levels of the simulation. Across the caprock, the overpressure induced by both equivalent-mass and equivalent-volume CO2 injection is ∼2–3 times higher than that of waste-fluid (Figure 7A). CO2 and low-TDS waste-fluid injection induces lower overpressure at far distances from the injection well; however, the overpressure from the high-TDS waste-fluid is almost constant across the caprock. Figure 7B shows that at the caprock-reservoir interface, only the overpressure induced by equivalent-mass CO2 injection is higher than waste-fluid injection and the overpressure induced by equivalent-volume CO2 injection is lower than waste-fluid injection. Figure 7C shows that at the reservoir-basement interface, the overpressure induced by variable-TDS injection is ∼2–3 times higher than equivalent-mass CO2 injection and almost one order of magnitude higher than equivalent-volume CO2 injection. The high-TDS and low-TDS waste-fluid injection create almost the same overpressure at distances (
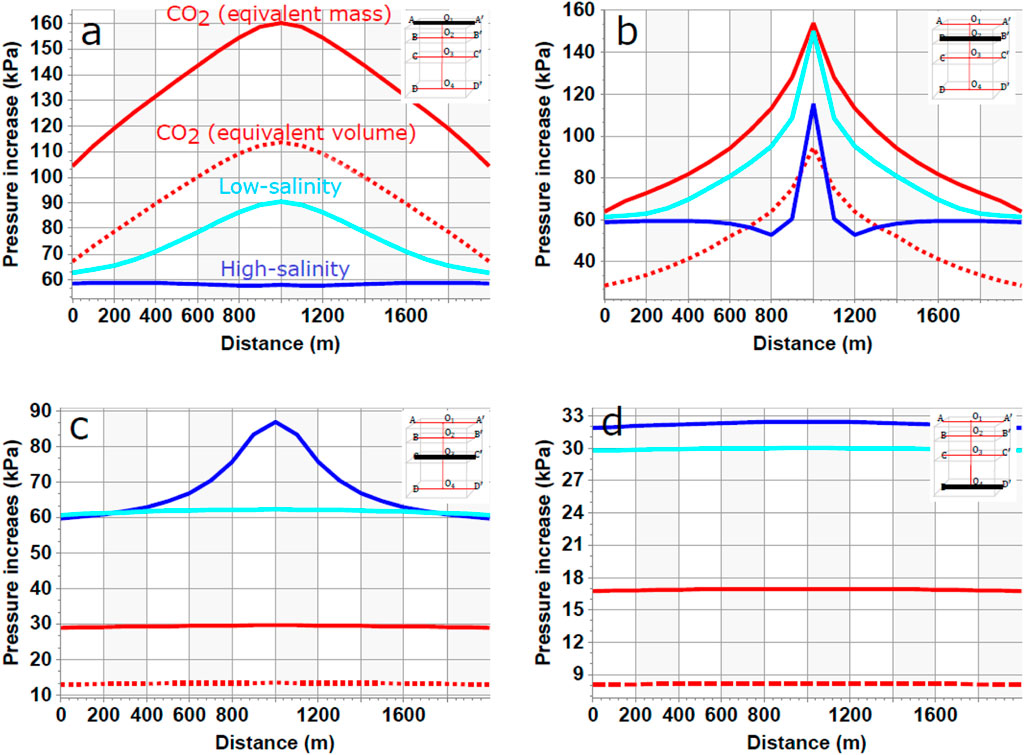
FIGURE 7. Spatial overpressure profile at shut-in time (i.e., after 25 years of injection) (A) along the top of caprock
Figure 8 shows the temporal change in pressure near the wellbore at different points along the wellbore. Figure 8A shows that temporal overpressure in the caprock for CO2 injection is higher than waste-fluid injection but drops sharply at the shut-in time. Unlike CO2 injection, the caprock’s overpressure remains high even after shut-in, which implies that resident brine movement into the caprock continues after shut-in. Simulation results show an initial sharp increase in pressure in the caprock followed by a subsequent more gradual increase in pressure, likely due to CO2-water phase separation and an increase in CO2 relative permeability. However, when injecting waste-fluid, the pressure increases consistently and monotonically because the resident brine’s relative permeability is the same as waste-fluid. In the long term, the overpressure for high-TDS and low-TDS waste-fluid in the caprock are comparable. Figure 8B shows that the pressure increase at the top of reservoir is higher for equivalent mass CO2 injection. This is primarily because a similar mass of CO2 occupies almost double the waste-fluid volume. Overpressure at the top of reservoir drops immediately after shut-in and returns almost to pre-injection pressure, which requires that an equivalent volume of resident brine to the injectant volume exits the boundaries of the model. CO2 is compressible and has a lower viscosity than reservoir brine, so this volume balance mainly happens within the reservoir. High-TDS waste-fluid has a higher density than the formation brine and is less compressible; thus, this volume balance occurs in the basement. In addition, injecting equivalent-volume CO2 results in lower overpressure at the top of reservoir. Figure 8C shows that at the base of the reservoir, the overpressure from high-TDS injection is highest followed by overpressure caused by low-TDS injection. The overpressure caused by CO2 injection in the reservoir (both top and base) is linearly related to the injection, and CO2 injection creates the lowest overpressure at the base of reservoir. In the basement (Figure 7D), injection overpressures are similar until shut-in (<3 kPa). After injection ceases, CO2 injection results in only minor overpressure (<4 kPa), while waste-fluid injection (both high and low TDS) results in approximately 10-fold larger increases in overpressure. The overpressure in the basement induced by waste-fluid injection in the reservoir increases almost linearly with time, and the pressure when injecting CO2 increases at the beginning of injection and remains almost constant after shut-in (Figure 8D).

FIGURE 8. Temporal overpressure profiles (A) at the top of caprock (O1), (B) at the caprock-reservoir interface (O2), (C) at the reservoir-basement interface (O3), and (D) within the basement (O4). The injection simulation starts in 2020, continues for 25 years, and stops in 2045.
We further investigated the effect of three assumptions on the results: First, we replaced the original relative permeability and capillary pressure curves with the Van Genuchten relative permeability and capillary pressure models and scaled the curves for different geological layers using parameters presented in Table 3 (Van Genuchten, 1980; Vilarrasa et al., 2019). The reason for this investigation is that because measuring relative permeability and capillary pressure is often challenging and uncertain, researchers typically use the Van Genuchten model for these curves in CO2 storage studies, especially for the caprock shale and the crystalline basement (Okwen et al., 2011; Vilarrasa et al., 2019). Second, we added geomechanical effects to the model. In production practices, the geomechanical effect is the primary mechanism for changes in the subsurface stress field; however, in injection practices, the pressure change is the primary mechanism for changes in the subsurface stress field (Zhai et al., 2019). The geomechanical parameters for the study area are described in Table 3, in which

TABLE 3. Van Genuchten parameters for the relative permeability and capillary pressure, and the geomechanical properties of the Patterson field. Sl stands for liquid saturation.
Figure 9 shows the wellbore pressure profile after applying these assumptions with infinite (Figure 9A) and finite aquifer assumption (Figure 9B). Assuming relative permeability scaling and geomechanical effects, in the infinite aquifer case (Figure 9A), the caprock’s overpressure is highest for the equivalent-mass CO2 injection, followed by equivalent-volume CO2 and low salinity waste-fluid injection. In the basement, the high-salinity waste-fluid creates the highest overpressure, followed by low-salinity and equivalent-mass CO2 injection.
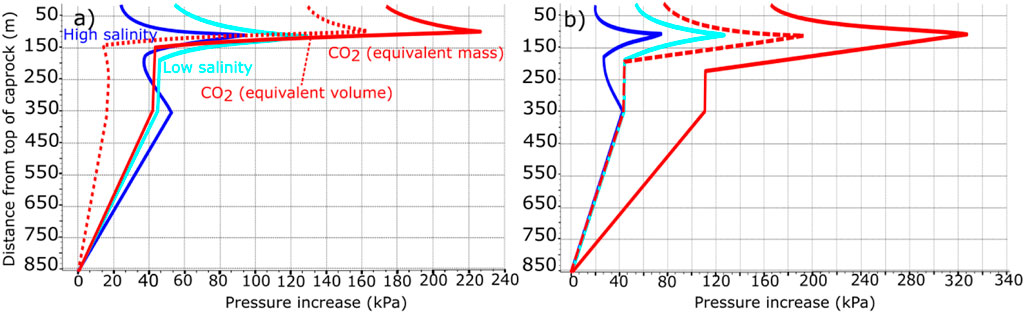
FIGURE 9. Pressure profile along the wellbore after scaling the relative permeability and capillary pressure for each formation using the Van Genuchten model and assuming geomechanical effects. (A) the aquifer is assumed infinite (B) the aquifer is considered finite.
However, in the finite aquifer case (Figure 9B), the overpressure associated with the mass-equivalent CO2 is more significant in all formations because more CO2 volume is injected. In the crystalline basement, however, the overpressure caused by volume-equivalent CO2 and waste-fluid are comparable. These results suggest that if the deep saline aquifers are extensive and act as infinite aquifers, which is the case for the Arbuckle aquifer, the equivalent-mass CO2 results in a lower pressure increase compared with waste-fluid injection. However, in regions where the aquifer is enclosed by geological features such as faults, the pressure increase due to equivalent-mass CO2 injection is higher in the basement.
Although micro-seismic events have been recorded at CO2 injection projects (Kaven et al., 2015), these earthquake events have not been major (M3+) and have not been felt by the public (Vilarrasa and Carrera, 2015; White and Foxall, 2016), primarily because the shale caprock and the sedimentary reservoir are not stiff and therefore do not accumulate stress. Because of its lower level of stiffness, the caprock is not critically stressed, and, therefore, only micro-seismic events are likely to occur there. Nevertheless, a hydraulically connected fault extending vertically from the basement into the reservoir and the caprock can transmit fluid and stress as well as trigger larger events. The crystalline basement is stiffer than both the sedimentary reservoir and the caprock shale. Stiffer formations can accumulate more stress when their pore pressure increases and are more likely to be critically stressed with faults ready to slip under small pore pressure changes. Therefore, it is the basement that poses highest induced seismicity risks and this is why the vast majority of the recent increase in seismicity in Kansas has occurred in the basement. Because overpressure in the basement due to CO2 injection is lower than that for injected waste fluids (Figures 6, 8), the risk of induced seismicity in CO2 injection projects is lower than from waste-fluid injection. Figure 8 shows that injecting high-TDS waste-fluid, which is often coproduced from oil and gas wells, induces the greatest overpressure at the base of the reservoir and within the basement. This result may imply that at shallower depths (<500 m), the Class II wells, which inject high-TDS waste-fluid, have the greater potential to induce seismicity than the Class I wells, which inject low-TDS waste-fluid. These results are in agreement with Pollyea et al. (2019), where it was shown that the injection of high-density oilfield waste-fluids can induce deeper and stronger earthquakes. Nevertheless, Figure 4 shows that deep in the basement (>500 m), the overpressure induced by high and low-TDS waste-fluids are comparable, suggesting that Class I and II wells have an equal potential for inducing seismicity.
Deep carbonate reservoirs in Kansas generally act as infinite reservoirs and experience minimum pressure buildup caused by hydraulically sealed faults. Therefore, pressure plumes can extend spatially across large areas. The ability of CO2 overpressure plumes to reach farther distances (Figure 7) implies that stress changes on faults intersecting the reservoir further afield will be more significant than for waste-fluid injection. The large areal extent of CO2 overpressure plumes, caused by the unfavorable mobility ratio of CO2 relative to the resident brine, also means that more faults will see the overpressure effect, although the overpressure magnitude will remain low far afield. Post-injection monitoring and verification programs will need to account for the broader extent of CO2 plumes to ensure secure storage and account for any environmental effects such as induced seismicity.
Caprock can be more vulnerable to failure near the wellbore as maximum overpressure occurs in this area (Figures 7A,B). These results also suggest that conducting geomechanical tests on core samples retrieved from the caprock would be crucial to evaluate caprock integrity during the evaluation of potential CO2 storage projects.
Pressure increase behavior near the wellbore strongly depends on the relative permeability and capillary pressure curves of the geological materials. In the absence of data, some researchers use Van Genuchten equations for CO2-water relative permeability and capillary pressure curves (Okwen et al., 2011; Vilarrasa et al., 2019). These researchers conclude that unlike waste-fluid injection, which has a linear increase in overpressure with time, CO2 injection leads to a maximum pressure increase at the initiation of injection, followed by overpressure drop and a relatively constant pressure afterward. Real field pressure data for CO2 injection into a fluvial sandstone at Ketzin Field, Germany, seems to show a similar pattern (Henninges et al., 2011). In addition, Locke et al., 2018 provide formation pressure for the Illinois Basin-Decatur Project (IBDP), a sandstone reservoir, and show a sharp overpressure increase in the injection well within the first few months followed by almost constant formation pressure at constant injection rate. Sharp overpressure for sandstone reservoirs can be explained considering that the displaced brine’s viscosity is high and relative permeability of CO2 at the beginning of injection is low because CO2 has not established flow pathways. The overpressure drop can be explained because CO2 relative permeability increases in the vicinity of the well, and CO2’s lower viscosity compared to the resident brine helps CO2 flow. The sharp initial overpressure suggests that high initial injection rates pose the greatest risk to caprock failure and slowly increasing the injection rate could be a method to reduce this risk. Slowly increasing the injection rate when the injection begins, maintaining a constant rate during injection, and slowly decreasing the injection rate at shut-in can likely reduce the risk of inducing seismicity by avoiding the accumulation of pressure and stress change (Segall and Lu, 2015).
Because the reservoir-scale permeability of the caprock and the basement is about 10−18–10−16 m2, the overpressure in the reservoir is significantly reduced by resident brine flow vertically upward into the caprock or downward into the basement. Therefore, including the caprock and basement in injection modeling significantly decreases the CO2 overpressure (and thus stress change) in the reservoir. This reduction in pressure is primarily because the pressure plume extends to a large area, far greater than that of the CO2 plume. When the pressure plume occupies a large area and the pressure difference between the reservoir and caprock is high, a significant volume of resident brine is expected to move into the caprock and contribute to a pressure drop in the reservoir. This pressure reduction in the reservoir can be even higher because confining caprock/baserock units may have effective permeability two to three orders of magnitude larger at the field scale than the core scale, due to the presence of discontinuities, fractures, and faults (Neuzil, 1994).
Current pressure plume assessments have several limitations. This study ignores CO2 dissolution in brine and any chemical reactions with the reservoir rocks (here carbonates), which may change the reservoir’s porosity and permeability. Field-scale studies show that 10% of the total injected CO2 may dissolve in resident brine in sandstone reservoirs (Ringrose, 2018) and even more in carbonate reservoirs, where more reaction with the reservoir rock may be reasonably expected (Gilfillan et al., 2009). The shape and extent of modeled CO2 pressure plumes primarily depend on porosity and permeability values, which are not well constrained for carbonate reservoirs such as the Arbuckle reservoir. The Arbuckle is known to be a highly heterogeneous unit that is fractured and vuggy (Franseen et al., 2004), characteristics that have enabled the reservoir to safely accept large quantities of waste-fluid disposal across the state for more than seven decades but that also make accurate reservoir modeling difficult. Further, relative permeability and capillary pressure curves of the Arbuckle Group are based on well logs, which ignore important fluid conduits in the carbonate rocks such as faults. This study assumes hydrostatic pressure for the reservoirs; however, deep saline reservoirs of Kansas are known to be under-pressured, which makes them attractive for waste-fluid disposal because they will accept waste-fluid under gravity drainage. This study’s findings support that CO2 injection poses less risk for inducing seismicity than waste-fluid injection but is not a substitute for detailed site characterization. The risk of injection-induced seismicity and leakage must be determined on a case-by-case basis.
Contrast in the properties (such as density, viscosity, and compressibility) between resident brine and injection fluid (e.g., CO2, high-TDS waste fluid, and low-TDS waste-fluid) creates different spatial and vertical overpressure profiles during injection. Because of buoyancy forces, injected CO2 overrides the resident brine, and because of its lower viscosity, CO2 induces a more areally extensive overpressure plume, although with a lower magnitude of overpressure than injected waste fluids. CO2 relative permeability curves determine the mobility of CO2 in the reservoir and govern the temporal change in overpressure near the wellbore. In addition, waste-fluid is a wetting phase with respect to reservoir rocks, while CO2 is a non-wetting phase, and its injection requires overcoming the capillary pressure threshold. Because the reservoir-scale permeability of the caprock and the basement are high, the overpressure in the reservoir is significantly reduced by resident brine flow vertically upward into the caprock or downward into the basement during CO2 injection.
We find that for CO2 injection, overpressure in the caprock is always greater (
The original contributions presented in the study are included in the article/Supplementary Material, further inquiries can be directed to the corresponding author.
EA—modeling execution, writing EH—concept development, writing, modeling support FH—concept support, writing support JR—project management, writing support.
This work was funded by the Department of Energy under Award Number DE-FE0031623, Midcontinent Stacked Storage Hub.
This report was prepared as an account of work sponsored by an agency of the United States Government. Neither the United States Government nor any agency thereof, nor any of their employees, makes any warranty, express or implied, or assumes any legal liability or responsibility for the accuracy, completeness, or usefulness of any information, apparatus, product, or process disclosed.
The authors declare that the research was conducted in the absence of any commercial or financial relationships that could be construed as a potential conflict of interest.
All claims expressed in this article are solely those of the authors and do not necessarily represent those of their affiliated organizations, or those of the publisher, the editors and the reviewers. Any product that may be evaluated in this article, or claim that may be made by its manufacturer, is not guaranteed or endorsed by the publisher.
This work benefited from discussions with Marty Dubois and Shelby Peterie. Authors thank Julie Tollefson for preparing this manuscript for print.
The Supplementary Material for this article can be found online at: https://www.frontiersin.org/articles/10.3389/fenrg.2022.864013/full#supplementary-material
Ansari, E. (2019). Estimates of Permeability and CO2 Storage Capacity at the Patterson Field Using Analysis of City of Lakin Wastewater Injection Well Characteristics. Lawrence, Kansas. Available at: http://www.kgs.ku.edu/Publications/OFR/2019/OFR19_22/index.html.
Birkholzer, J. T., and Zhou, Q. (2009). Basin-scale Hydrogeologic Impacts of CO2 Storage: Capacity and Regulatory Implications. Int. J. Greenh. Gas Control 3 (6), 745–756. doi:10.1016/j.ijggc.2009.07.002
Carr, T. R., Merriam, D. F., and Bartley, J. D. (2005). Use of Relational Databases to Evaluate Regional Petroleum Accumulation, Groundwater Flow, and CO2 Sequestration in Kansas. Bulletin 89 (12), 1607–1627. doi:10.1306/07190504086
Celia, M. A., Bachu, S., Nordbotten, J. M., and Bandilla, K. W. (2015). Status of CO2storage in Deep Saline Aquifers with Emphasis on Modeling Approaches and Practical Simulations. Water Resour. Res. 51 (9), 6846–6892. doi:10.1002/2015WR017609
EFI (2018). Advancing Large Scale Carbon Management: Expansion of the 45Q Tax Credit. Washington, DC.
Fanchi, J. R. (2006). Principles of Applied Reservoir Simulation. doi:10.1016/B978-0-7506-7933-6.X5000-4
Fazel Alavi, M. (2015). Determination of Relative Permeability Curves in the Arbuckle. Lawrence, Kansas.
Franseen, E. K., Byrnes, A. P., Cansler, J. R., and Carr, T. (2004). The Geology of Kansas: Arbuckle Group. Kansas Geological Survey.
Gilfillan, S. M. V., Lollar, B. S., Holland, G., Blagburn, D., Stevens, S., Schoell, M., et al. (2009). Solubility Trapping in Formation Water as Dominant CO2 Sink in Natural Gas Fields. Nature 458 (7238), 614–618. doi:10.1038/nature07852
Goertz-Allmann, B. P., Kühn, D., Oye, V., Bohloli, B., and Aker, E. (2014). Combining Microseismic and Geomechanical Observations to Interpret Storage Integrity at the in Salah CCS Site. Geophys. J. Int. 198 (1), 447–461. doi:10.1093/gji/ggu010
Henninges, J., Liebscher, A., Bannach, A., Brandt, W., Hurter, S., Köhler, S., et al. (2011). P-T-ρ and Two-phase Fluid Conditions with Inverted Density Profile in Observation Wells at the CO2 Storage Site at Ketzin (Germany). Energy Procedia 4, 6085–6090. doi:10.1016/j.egypro.2011.02.614
Holubnyak, E., Watney, L., Jennifer, H., Tandis, B., Fatemeh Mina, F., John, D., et al. (2017). Small Scale Field Test Demonstrating CO2 Sequestration in Arbuckle Aquifer and by CO2-EOR at Wellington Field, Sumner County. Lawrence, Kansas.
Hornbach, M. J., DeShon, H. R., Ellsworth, W. L., Stump, B. W., Hayward, C., Frohlich, C., et al. (2015). Causal Factors for Seismicity Near Azle, Texas. Nat. Commun. 6, 6728. doi:10.1038/ncomms7728
Kaven, J. O., Hickman, S. H., McGarr, A. F., and Ellsworth, W. L. (2015). Surface Monitoring of Microseismicity at the Decatur, Illinois, CO2Sequestration Demonstration Site. Seismol. Res. Lett. 86 (4), 1096–1101. doi:10.1785/0220150062
Keranen, K. M., and Weingarten, M. (2018). Induced Seismicity. Annu. Rev. Earth Planet. Sci. 46 (1), 149–174. doi:10.1146/annurev-earth-082517-010054
Langenbruch, C., Weingarten, M., and Zoback, M. D. (2018). Physics-based Forecasting of Man-Made Earthquake Hazards in Oklahoma and Kansas. Nat. Commun. 9 (1). doi:10.1038/s41467-018-06167-4
Locke, R., Iranmanesh, A., Wimmer, B., Kirksey, J., Malkewicz, N., and Greenberg, S. (2018). “Verification Well # 1 : How a Deep Monitoring Well Was Used and Adapted to Meet the Evolving Monitoring Needs and Challenges at the Illinois Basin – Decatur Project,” in 14th Greenhouse Gas Control Technologies Conference, Melbourne, 21-26 October 2018, 1–12.
Mishra, S., Ganesh, P. R., Kelley, M., and Gupta, N. (2017). Analyzing the Performance of Closed Reservoirs Following CO2 Injection in CCUS Projects. Energy Procedia 114 (July), 3465–3475. doi:10.1016/j.egypro.2017.03.1477
Neuzil, C. E. (1994). How Permeable Are Clays and Shales? Water Resour. Res. 30 (2), 145–150. doi:10.1029/93WR02930
Nordbotten, J. M., Celia, M. A., and Bachu, S. (2005). Injection and Storage of CO2 in Deep Saline Aquifers: Analytical Solution for CO2 Plume Evolution during Injection. Transp. Porous Med. 58 (3), 339–360. doi:10.1007/s11242-004-0670-9
Okwen, R. T., Stewart, M. T., and Cunningham, J. A. (2011). Temporal Variations in Near-Wellbore Pressures during CO2 Injection in Saline Aquifers. Int. J. Greenh. Gas Control 5 (5), 1140–1148. doi:10.1016/j.ijggc.2011.07.011
Pollyea, R. M., Chapman, M. C., Jayne, R. S., and Wu, H. (2019). High Density Oilfield Wastewater Disposal Causes Deeper, Stronger, and More Persistent Earthquakes. Nat. Commun. 10 (1), 1–10. doi:10.1038/s41467-019-11029-8
Ringrose, P. S. (2018). The CCS Hub in Norway: Some Insights from 22 Years of Saline Aquifer Storage. Energy Procedia 146, 166–172. doi:10.1016/j.egypro.2018.07.021
Schoenball, M., and Ellsworth, W. L. (2017). Waveform‐Relocated Earthquake Catalog for Oklahoma and Southern Kansas Illuminates the Regional Fault Network. Seismol. Res. Lett. 88 (5), 1252–1258. doi:10.1785/0220170083
Schuetter, J., and Mishra, S. (2015). “Experimental Design or Monte Carlo Simulation? Strategies for Building Robust Surrogate Models,” in SPE Annual Technical Conference and Exhibition, Houston, Texas, USA, September 28–30, 2015. doi:10.2118/174905-ms
Segall, P., and Lu, S. (2015). Injection-induced Seismicity: Poroelastic and Earthquake Nucleation Effects. J. Geophys. Res. Solid Earth 120 (7), 5082–5103. doi:10.1002/2015JB012060
Stork, A. L., Verdon, J. P., and Kendall, J.-M. (2015). The Microseismic Response at the in Salah Carbon Capture and Storage (CCS) Site. Int. J. Greenh. Gas Control 32, 159–171. doi:10.1016/j.ijggc.2014.11.014
Townend, J., and Zoback, M. D. (2000). How Faulting Keeps the Crust Strong. Geology 28 (5), 399–402. doi:10.1130/0091-7613(2000)28<399:HFKTCS>2.0.CO10.1130/0091-7613(2000)028<0399:hfktcs>2.3.co;2
Van Genuchten, M. T. (1980). A Closed-form Equation for Predicting the Hydraulic Conductivity of Unsaturated Soils. Soil Sci. Soc. Am. J. 44 (5), 892–898. doi:10.2136/sssaj1980.03615995004400050002x
Vilarrasa, V., Bolster, D., Dentz, M., Olivella, S., and Carrera, J. (2010). Effects of CO2 Compressibility on CO2 Storage in Deep Saline Aquifers. Transp. Porous Med. 85 (2), 619–639. doi:10.1007/s11242-010-9582-z
Vilarrasa, V., and Carrera, J. (2015). Geologic Carbon Storage Is Unlikely to Trigger Large Earthquakes and Reactivate Faults through Which CO 2 Could Leak. Proc. Natl. Acad. Sci. U.S.A. 112 (19), 5938–5943. doi:10.1073/pnas.1413284112
Vilarrasa, V., Carrera, J., Olivella, S., Rutqvist, J., and Laloui, L. (2019). Induced Seismicity in Geologic Carbon Storage. Solid earth. 10 (3), 871–892. doi:10.5194/se-10-871-2019
Weingarten, M., Ge, S., Godt, J. W., Bekins, B. A., and Rubinstein, J. L. (2015). High-rate Injection Is Associated with the Increase in U.S. Mid-continent Seismicity. Science 348 (6241), 1336–1340. doi:10.1126/science.aab1345
White, J. A., and Foxall, W. (2016). Assessing Induced Seismicity Risk at CO2 Storage Projects: Recent Progress and Remaining Challenges. Int. J. Greenh. Gas Control 49, 413–424. doi:10.1016/j.ijggc.2016.03.021
Zhai, G., Shirzaei, M., Manga, M., and Chen, X. (2019). Pore-pressure Diffusion, Enhanced by Poroelastic Stresses, Controls Induced Seismicity in Oklahoma. Proc. Natl. Acad. Sci. U.S.A. 116 (33), 16228–16233. doi:10.1073/pnas.1819225116
Zoback, M. D., and Gorelick, S. M. (2012). Earthquake Triggering and Large-Scale Geologic Storage of Carbon Dioxide. Proc. Natl. Acad. Sci. U.S.A. 109 (26), 10164–10168. doi:10.1073/pnas.1202473109
Keywords: wastewater disposal, CCUS, carbon management, brine disposal, reservoir modeling and simulation, induced seismicity, produced water
Citation: Ansari E, Holubnyak E, Hasiuk F and Raney J (2022) Comparing CO2 and Variable-TDS Waste-Fluid Injection Into Deep Saline Geologic Formations. Front. Energy Res. 10:864013. doi: 10.3389/fenrg.2022.864013
Received: 28 January 2022; Accepted: 27 April 2022;
Published: 27 May 2022.
Edited by:
Priyank Jaiswal, Oklahoma State University, United StatesReviewed by:
Anouar Romdhane, SINTEF Industry, NorwayCopyright © 2022 Ansari, Holubnyak, Hasiuk and Raney. This is an open-access article distributed under the terms of the Creative Commons Attribution License (CC BY). The use, distribution or reproduction in other forums is permitted, provided the original author(s) and the copyright owner(s) are credited and that the original publication in this journal is cited, in accordance with accepted academic practice. No use, distribution or reproduction is permitted which does not comply with these terms.
*Correspondence: Eugene Holubnyak, ZWhvbHVibnlAdXd5by5lZHU=
Disclaimer: All claims expressed in this article are solely those of the authors and do not necessarily represent those of their affiliated organizations, or those of the publisher, the editors and the reviewers. Any product that may be evaluated in this article or claim that may be made by its manufacturer is not guaranteed or endorsed by the publisher.
Research integrity at Frontiers
Learn more about the work of our research integrity team to safeguard the quality of each article we publish.