- School of Power and Energy, Northwestern Polytechnical University, Xi’an, China
The parametric design method of equal and unequal thickness reverse thrust blades is studied based on the cubic Bessel curve controlled by four control points. In order to improve the aerodynamic performance of the thrust reverser and reduce the structure weight, the geometry shape of the blade in the three-dimensional thrust reverser cascade assembly was optimized by using a genetic algorithm based on BP artificial neural network, and the fluid-structure coupling and modal analysis of the optimized thrust reverser cascade were carried out. The results show that: compared with the benchmark model, the thrust reverses of the optimized equal thickness and non-equal thickness blades are increased by 15.64 and 12.71%, respectively, and the flow rate increases by 11.32 and 13.52%, respectively; based on the optimized blade profile, increasing the number of stiffeners is more efficient than increasing the thickness of cascade assembly in the area of reducing the maximum stress and strain; Increasing the number of stiffeners and the thickness of cascade assembly can improve the first-order natural vibration frequency of the cascade assembly.
Introduction
The thrust reverser device can shorten the aircraft’s landing distance, reduce the use of the brake device, prolong the life of the brake components, and enhance the ability of the aircraft to cope with emergencies, adverse weather conditions, and short runways (Reemsnyderj and Sagerser, 2015; Hall et al., 2006),(Hall et al., 2006; Reemsnyderj and Sagerser, 2015). However, using a thrust reverser will lead to an increase in engine weight and fuel consumption rate. For cascade thrust reverser, the cascade is the core component to change the airflow direction and generate thrust. The aerodynamic performance of the blade in cascade directly affects the thrust reverser efficiency and thrust reverser. Therefore, the blade profile design is critical for cascade thrust devices. Improving the aerodynamic performance of the thrust device and reducing the structural weight is also an essential part of the research on the thrust reverser device.
Many scholars have done much work and made some progress in the research of thrust reversers. J. Butterfield et al. (Butterfield et al., 2003; Butterfield et al., 2004) established a multidisciplinary and multi-objective optimization design method with aerodynamics, structure, machining and cost control. He Yan et al. (He and Liu, 2010a; He and Liu, 2010b) studied the effects of two-dimensional blade parameters on the thrust reverser efficiency and flow coefficient. Zhou Li et al. (Zhou et al., 2015) systematically studied the effect of cascade installation angle on the performance of thrust devices. Chen Jun et al. (Chen et al., 2019) analyzed the effect of main cascade geometry parameters on the performance of thrust reversals. Zhang Yunhao et al. (Zhang and Eriqitai, 2012) did the aerodynamic/structural coupling analysis of the cascade of the thrust reverser, studied the influence of the cascade parameters on the thrust reverser efficiency, and the influence of blade number and stiffener number on maximum stress value and maximum deformation of a cascade. Compared with the research on two-dimensional blades in cascade thrust reverser devices, the parametric design optimization of three-dimensional equal thickness and unequal thickness thrust blades and their research on thrust performance is still insufficient at present. At the same time, the influence on the structural characteristics of thrust reverser cascade thickness has not been reported. Therefore, it is necessary to carry out research on parametric design optimization of thrust reverser blades and the structural characteristics of the optimized thrust reverser cascade.
In this paper, the blade profile of the cascade thrust reverser is designed by using the Bézier curve and the parameterized design idea. In order to improve the reverse thrust under the design condition, the blade shape is optimized by the genetic algorithm based on BP artificial neural network developed by the research group. Based on the optimal blade profile, the strength and stiffness of a single cascade with a different number of stiffeners and different thicknesses are checked by the unidirectional fluid-solid coupling analysis method and the modal analysis of cascade components is carried out.
Blade Parameterization Method
Blade of Equal Thickness
The traditional equal thickness blade comprises two arcs and a straight line. The geometric meaning of each parameter is evident, which can be generated directly by a geometric method. However, this method has limitations on the range of parameters, and only the first derivative of the profile curve is continuous. The aerodynamic performance of the blade profile is poor. Therefore, this paper uses the Bézier curve to describe the blade shape.
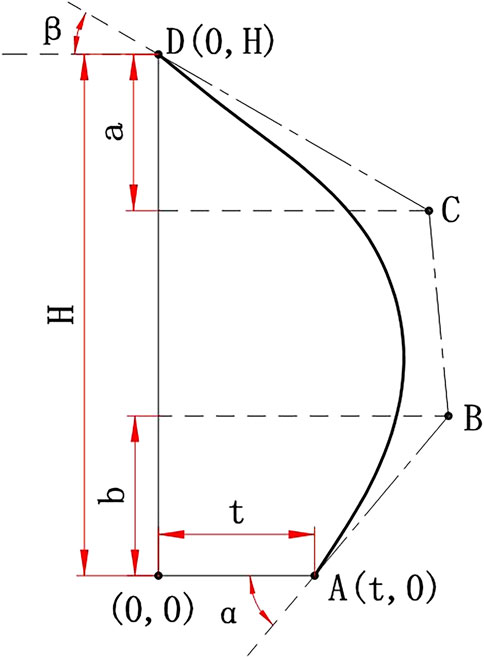
In order to meet the requirements of calculation accuracy and optimization efficiency, a cubic Bezier curve consisting of four control points is used to generate the blade. The disadvantage of this method is that the geometric meaning of design parameters (the x-coordinate, y-coordinate of the control point) is not apparent. The parameters such as inlet airflow angle and outlet airflow angle, which significantly influence blade performance, can not be given directly. To this end, as shown in Figure 1, two parameters are added, and the control point coordinates of the Bézier curve are converted into blade parameters with obvious geometric significance by using six design parameters.
The meanings of the parameters in Figure 1 are as follows:
1) The inlet airflow angle α of the blade;
2) The outlet airflow angle β of the blade;
3) The relative position a of the Y coordinate of the point C;
4) The relative position b of the Y coordinate of the point B;
5) The blade-height H;
6) The axial spacing t between the upper and lower ends of the Blade.
The coordinates of the control points A, B, C, and D can be obtained from these six control parameters. Thus, the Bézier curve can be determined.
Blades of Unequal Thickness
Although the blade with equal thickness is easy to process, further aerodynamic performance improvement is neglected. In contrast, blades with different thicknesses can have a better aerodynamic shape, reducing the front and back edges of the blade to the obstruction of airflow.
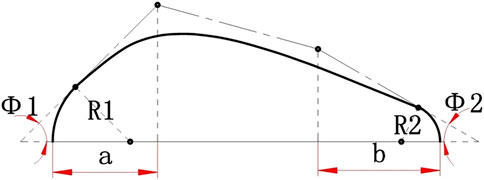
Using the method of generating equal thickness blades described above generates the mid-arc of unequal thickness blades. Then the thickness distribution law of the blade is generated by using the Bézier curve, and the thickness law is attached to the middle arc to generate unequal thickness blades. As shown in Figure 2, the following six parameters are selected as design parameters:
1) Leading edge radius R1;
2) Trailing edge radius R2;
3) Leading edge angle
4) Trailing edge angle
5) The relative position a of the Y coordinate of the second control point
6) The relative position b of the Y coordinate of the third control point.
It is easy to know the coordinates of the control points of the Bézier curve (see Table 1), then the Bézier curve can be determined. That is, the thickness distribution law of the blade can be determined.
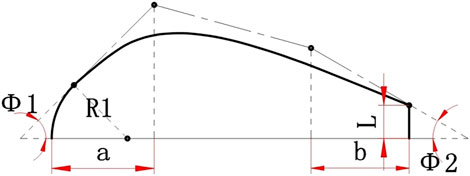
Sometimes the trailing edge of the blade is not circular but blunt. As shown in Figure 3, similar to the above round head thickness law generated, only the parameter of the trailing edge angle
The coordinates of the two control points on the left of the Bézier curve are the same as above. The third control point coordinates are (1-b,
After the thickness distribution law of the blade is determined, the blade with unequal thickness can be generated by superimposing it on the middle arc. Figure 4 show two kinds of typical unequal thickness blades with a round head and blunt head and their local enlargement of trailing edge. It can be seen from the figure that the trailing edge of the blade with unequal thickness generated by the law of round generated by the law of is relatively smooth, while the trailing edge of the blade with unequal thickness generated by the thickness law of generated by the law of blunt head thickness has prominent sharp angles. Although it is not smooth, it is easy to manufacture the blade.
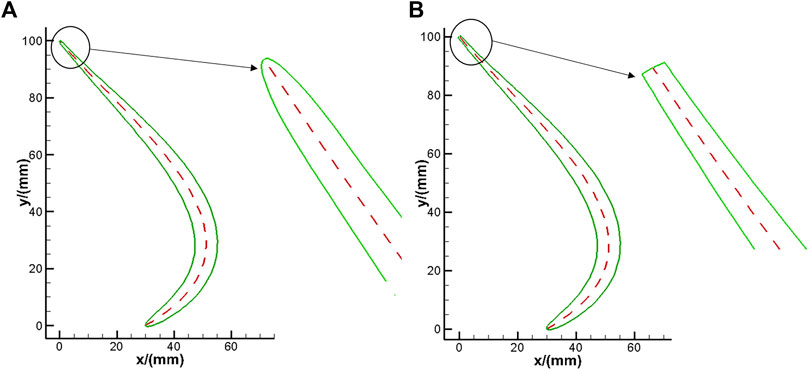
FIGURE 4. The unequal thickness blade generated by the thickness distribution law of the round head. (A) round head (B) blunt head.
Blade Optimization
Optimistic Method
Taking the minimum value of function
As shown in Figure 5, it can be seen from the comparison results that the Bp artificial neural network designed by this algorithm meets the accuracy requirements at the sample points and has good generalization ability at non-sample points, which can accurately fit the surface. At the same time, the genetic algorithm finally obtains the minimum value of the function at (0.0003128, 0.008446), where the minimum value is 0.0324, while the actual minimum value of the function is at (0, 0) where the minimum value is 0. The results show that the optimization algorithm used in this paper has good optimization ability, and the minimum surface value in the definition domain can be estimated only through 17 sample points.
In order to verify the ability of the pseudo-parallel multi-population niche genetic algorithm with elite preservation strategy for the multi-peak function, the global minimum of six-peak value hump function
As the name suggests, the six-peak humpback function has six local minimum points (shown in Figure 6), the genetic algorithm finally gets the global minimum points (−0.0898, 0.7126), and (0.0898, −0.7126) with a minimum value of −1.031628. The error between the minimum fitness value of the genetic algorithm and the actual value is less than 10–5, which shows that the optimization algorithm used in this paper has a better optimization ability.
Geometric Models and Numerical Methods
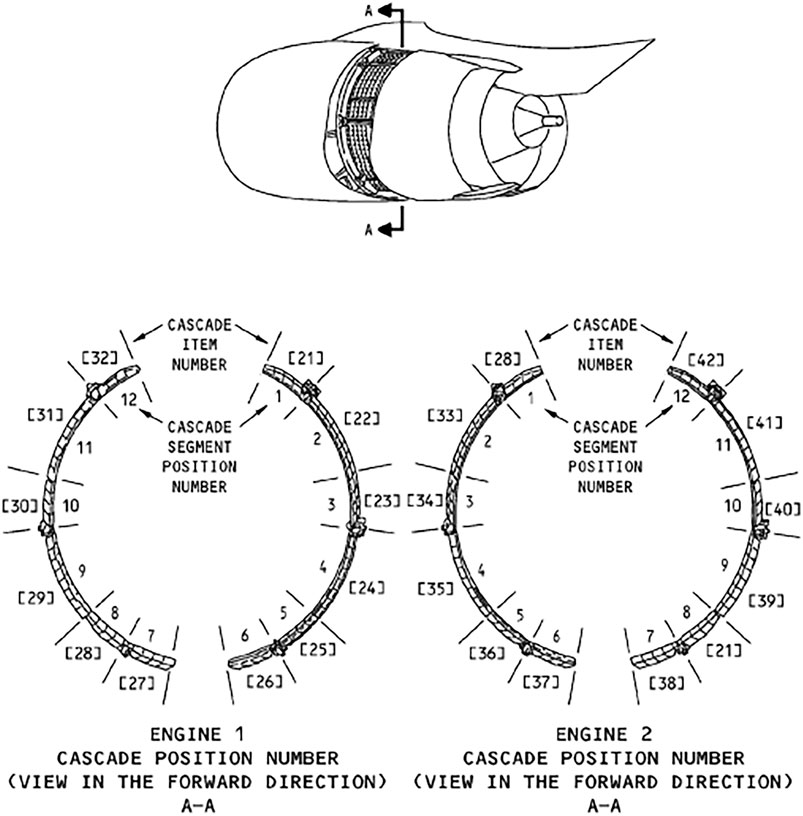
As shown in Figure 7, the CFM-56 engine, for example, each side of the thrust reverser has six cascades, which are not precisely the same.
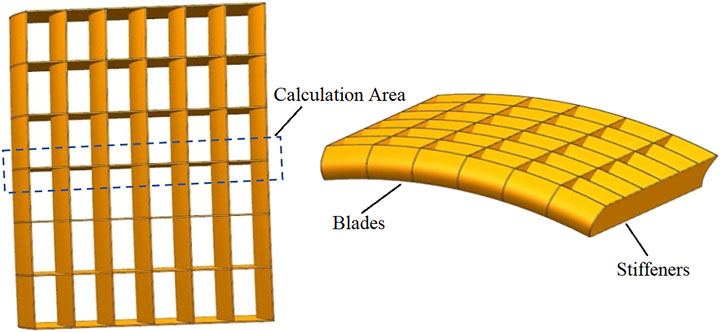
In order to simplify the calculation, it is considered that the 12 cascades are the same and surrounded by 360°. The initial blade shapes of each cascade are: inlet angle α = 50°, outlet angle β = 30°, leading edge radius R1 = 40 mm, trailing edge radius R2 = 30 mm, blade height H = 100 mm, the axial distance between the upper and lower end of blade t = 45 mm. The blade profile was designed by the parametric method described above, and the blade in the cascade can be obtained by stretching the profile. In order to use the periodic boundary condition conveniently in the flow-field calculation, half of the adjacent cascade is selected, and the stiffeners are surrounded in the middle. The final single cascade and its calculation area are shown in Figure 8.
As shown in Figure 9, the calculation area has meshed. The mesh encryption was carried out near the wall to ensure that the y+ of the boundary layer mesh is close to 1, and 0.83 million, 1.24 million and 3.01 million meshes are used to verify the mesh independence. Finally, 1.24 million meshes are selected as the calculation mesh. Numerical simulation of cascade flow-field using Fluent software. The three-dimensional steady Reynolds-averaged Navier-Stokes equation is selected as the control equation, while the density-based implicit algorithm is used to solve the equations, and the turbulence model is the SST
Optimized Results
The blade height H is a crucial design variable of the thrust cascade, and its size affects the thickness of the cascade, which is not used as an optimization variable here. The x coordinates of the four control points of the Bessel curve are used as the optimization variables to study the blades with equal thickness and those with unequal thickness. The control point X coordinate of the initial leaf type is selected as the initial value of optimization, and the range of the X coordinate is preliminarily limited, as shown in Table 2. The flow field is calculated to obtain the aerodynamic performance parameters of different thrust devices. The optimization algorithm in this paper is used to optimize the design (Trelea, 2003; Han, 2006).
Blades of Equal Thickness
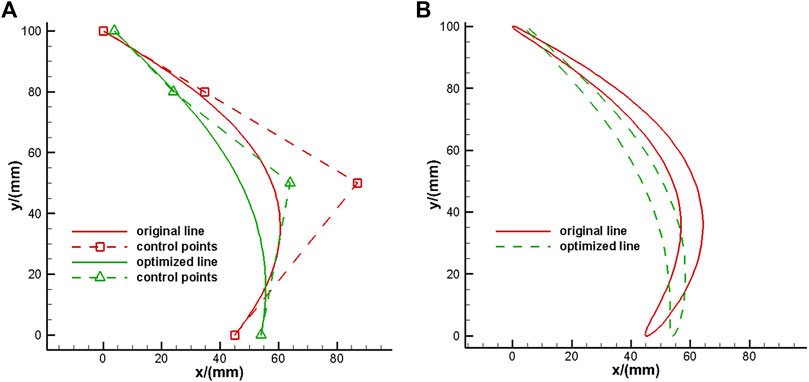
The blade with equal thickness of the thrust reverser was optimized, and the optimal control point coordinates of the equal thickness blade are (3.918, 100), (24, 80), (64, 50), (54, 0). The comparison of the blade shape between the optimal individual and the benchmark model is shown in Figure 10.
The aerodynamic parameters of the optimum individual are shown in Table 3.
When the cascade spacing remains unchanged, the effective area at the cascade outlet increases with the optimal individual outlet flow angle, and the flow increases when the cascade outlet velocity does not change much. At the same time, the outlet area increases and the flow increases, but the inlet area of the bypass does not change, which will lead to the increase of the Mach number of the inlet airflow of the bypass. Therefore, there is a local high Mach number region appears in the upper wall of bypass in the Mach number distribution diagram in Figure 11, and accordingly, a corresponding low-pressure region appears in the static pressure diagram.
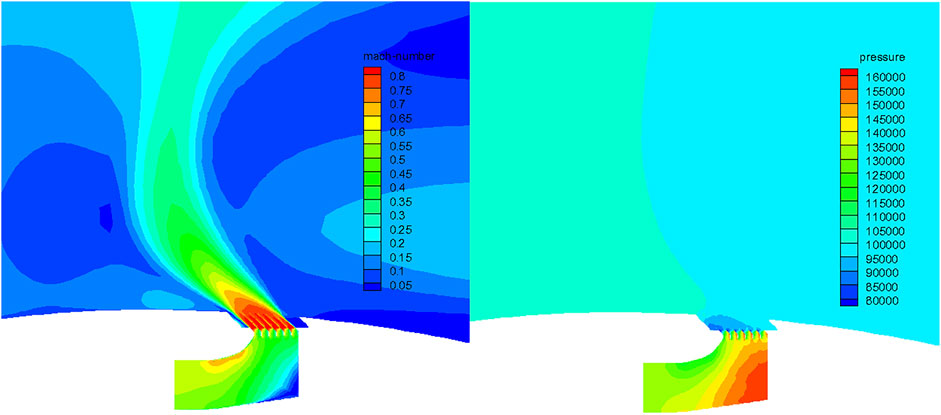
FIGURE 11. Mach number distribution and static pressure distribution of optimal individual of equal thickness blade.
On the other hand, the increase of the outlet airflow angle will reduce the axial velocity of the outlet. That is, the direction of the outlet airflow is more deviated from the axial direction. Under the combined action of flow rate and outlet axial velocity, the optimal individual thrust reversals reach the maximum.
Blades of Unequal Thickness
The same method was used to optimize the design of the blade with unequal thickness of the thrust device. The coordinates of the control points for the optimal blade shape of the blade with different thicknesses are (4.259, 100), (24, 80), (64, 50), (54, 0). The comparison of blade shape between the optimal individual and the benchmark model is shown in Figure 10.
The aerodynamic parameters of the optimum individual are shown in Table 4.
The Mach number distribution and static pressure distribution of the optimal individual are shown in Figure 12. It can be seen from the figure that there is a local high Mach number region on the upper wall of the bypass. Accordingly, there is a low-pressure region in the static pressure diagram. Similar to the thrust cascade with the same thickness blade, the optimal individual thrust reversals reach the maximum under the combined action of flow rate and outlet axial velocity.
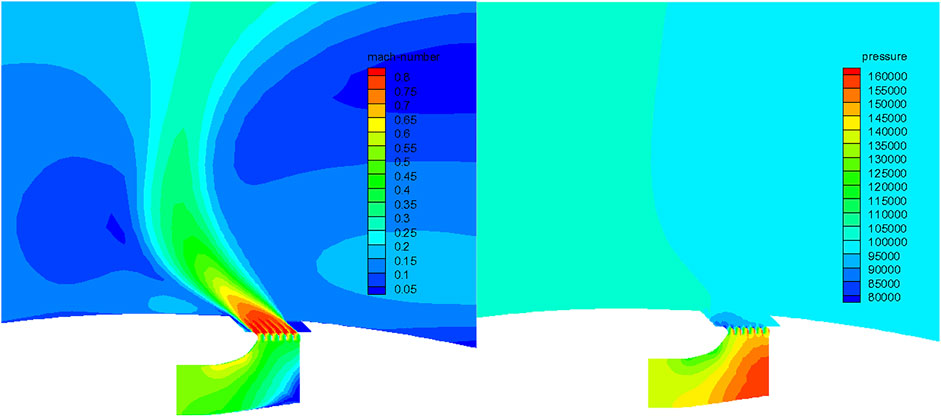
FIGURE 12. Mach number distribution and static pressure distribution of the optimal individual of unequal thickness blades.
The optimization results show that compared with the initial thrust device, the thrust reversals of equal thickness and non-equal thickness are increased by 15.64 and 12.71%, respectively, and the flow rate is increased by 11.32% 13.52%, respectively.
Analysis of Structural Characteristics
Taking cascades with the optimal equal thickness blade as an example, the one-way fluid-structure coupling analysis is carried out through the ANSYS Workbench, and the pressure distribution calculated by the flow field is loaded onto the cascades. The strength and stiffness of the cascades with different stiffeners and thicknesses are checked, and the modal analysis is carried out (Butterfield et al., 2006).
Fluid-Structure Coupling Analysis
In order to study the effect of the number of stiffeners on the strength and stiffness of a single cascade assembly, the number of stiffeners was changed to 5, 6, 7 (see Figure 8). The blade and stiffener are both equal thickness, and the thicknesses are divided into 3 and 4 mm to study the effect of thickness on the strength and stiffness of cascade assembly (Butterfield et al., 2006).
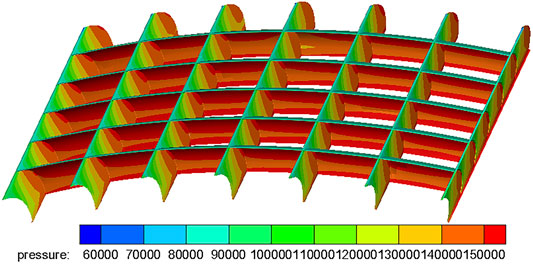
The pressure distributions on the cascades and the stiffeners are obtained by calculating the flow field of the cascades using the above method, as shown in Figure 13. It is also considered that the front and rear ends of the cascades are supported by a strong structure and treated as a fixed boundary condition. Moreover, the stiffeners on both sides of the cascades are supported by solid structures with significant stiffness. In order to simplify the calculation, fixed constraints are also applied. In addition to the surface with fixed constraints, the pressure distribution calculated by the flow field must be loaded on the other surfaces.
After setting constraints and loading pressure, the cascade’s equivalent stress and total deformation can be solved. Since the airflow temperature at the backstepping cascade is low, the influence of thermal stress on the strength analysis of the cascade is ignored in this paper. Material is defined as structural steel, density
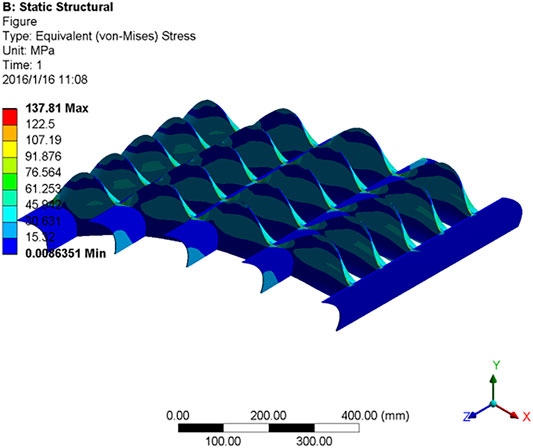
The equivalent stress distribution is shown in Figure 14 (taking five stiffeners with a thickness of 4 mm as an example). In the figure, the maximum stress value is located at the connection between the blade and the stiffener, while the stress value on the stiffener is minimal. At the same time, since the blades and stiffeners are of equal thickness, the corner at the joint is prone to stress concentration, so the improvement of these places should be considered first in structural optimization.
The maximum stress values of each model are shown in Table 5.
As shown in Table 5, the highest maximum stress value is the thickness of 3 mm, five stiffener cascade assembly, and lowest for the cascades with 4 mm thickness and seven stiffeners. It shows that increasing the thickness of blades and stiffeners and increasing the number of stiffeners can effectively reduce the maximum stress value of cascade assembly, and the maximum stress values of each model are lower than the tensile yield ultimate strength of the material of 250 MPa.
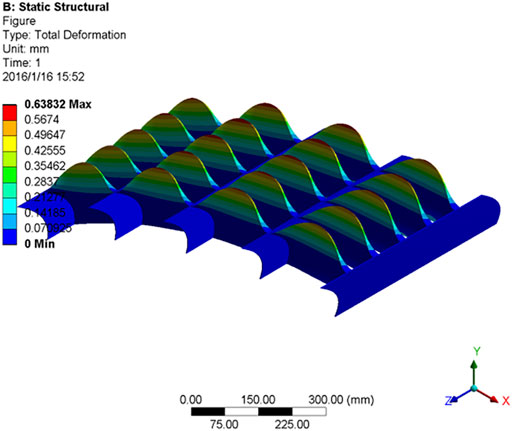
The total deformation distribution of each model is shown in Figure 15 (five stiffeners, thickness 3 mm, for example), where the deformation is overstated for clarity. It can be seen from the figure that the main deformation area occurs in the blade part between every two stiffeners, and the closer to the middle part, the greater the deformation. The deformation on the reinforced ribs is small. In this paper, structural steel is selected as the material, and its elastic modulus is relatively large, so the deformation is small.
The maximum deformation of each model is shown in Table 6.
As shown in Table 6, it can be seen that the highest maximum deformation is the thickness of 3 mm, five stiffener cascade assembly, and lowest for the cascades with 4 mm thickness and seven stiffeners. It shows that the maximum deformation of the cascade assembly can be effectively reduced by increasing the thickness of the blade and the stiffeners and increasing the number of the stiffeners.
Increasing the number of stiffeners or the thickness of the cascades assembly can undoubtedly improve the strength and stiffness of the cascade assembly, but it also leads to an increase in the weight of the thrust reverser device. The mass of each model is shown in Table 7.
As can be seen from Table 7, increasing the number of stiffeners or the thickness of the cascade assembly will increase the mass of the cascade assembly. At the same time, it can be found that, compared with increasing the number of stiffeners, the mass increase caused by increasing the thickness of the cascade component is more prominent. By comparing Table 5 and Table 6, it can be identified that increasing the number of stiffeners has a higher efficiency-cost ratio than increasing the thickness of cascade assembly. Therefore, in practical application, the cascade assembly can be designed “Thin and dense” to reduce the weight and improve the economy.
In order to explain this problem quantitatively, the cascades assembly with five stiffeners and a thickness of 3 mm are taken as the benchmark to obtain the decrease of the maximum stress value and the maximum deformation caused by the increase of unit mass of other cascade assemblies, as shown in Table 8 and Table 9.
Table 8 intuitively shows that increasing the number of stiffeners is more effective than increasing the thickness of cascade assembly in reducing the maximum stress value.
As shown in Table 9, compared with increasing the thickness of the cascade assembly, increasing the number of stiffeners has a higher efficiency-cost ratio in reducing the maximum deformation.
When the limit load is used as an external load on a structure, the safety factor of the general aircraft must be greater than 1.5. Therefore, in the numerical example selected in this paper, Considering the structural weight and structural safety factor of the engine thrust reverser device, the cascade assembly with seven stiffeners and a thickness of 3 mm can significantly reduce the maximum stress and maximum deformation while only bringing a slight structural weight increase. This cascade assembly has the best performance.
Modal Analysis
After the modal analysis of the cascade with flow-field pressure applied (Miao, 2019; Zhang et al., 2019), the first-order natural frequencies of each model are obtained, as shown in Table 10.
As can be seen from Table 10, the cascade assembly with a thickness of 3 mm and five stiffeners has the lowest first-order natural frequency; The highest first-order natural frequency is the cascade assembly with a thickness of 4 mm and seven stiffeners. It shows that increasing the thickness of the blade and the number of stiffeners improves the stiffness of cascade assembly and then improves the first-order natural frequency of cascade assembly.
Conclusion
In this paper, a cubic Bézier curve controlled by four points was selected for the parametric design of the blades of cascade thrust reverser device with equal thickness and unequal thickness. On this basis, the genetic algorithm based on Bp artificial neural network is used to optimize the geometric shape of the designed blade, and the structural statics analysis and modal analysis were carried out on the optimized cascade assembly of the thrust reverse device. The results show that:
1) When the cascade spacing remains unchanged and the cascade outlet velocity does not change much, the flow increases with the optimal individual outlet flow angle. On the other hand, the increase of outlet flow angle will reduce the outlet axial velocity when the outlet Mach number changes little. Under the combined action of flow and outlet axial velocity, the optimal individual thrust reverser reaches the maximum.
2) Compared with the benchmark model, the reverse thrust of the optimized blades with equal thickness and non-equal thickness increase by 15.64 and 12.71%, respectively, and the flow rate increases by 11.32 and 13.52%, respectively.
3) The blade strength meets the design requirements, and the number of stiffeners in reducing the maximum stress and deformation has a higher efficiency-cost ratio than increasing the thickness of the cascade assembly. Considering the thrust reverse device’s structural weight and safety factor, the cascade assembly with a thickness of 3 mm and seven stiffeners has the best performance in the selected examples.
4) Increasing the number of stiffeners and the cascade assembly’s thickness can increase the cascade assembly’s stiffness and the first-order natural frequency of its vibration.
Data Availability Statement
The raw data supporting the conclusion of this article will be made available by the authors, without undue reservation.
Author Contributions
YH, YQ, and WC provide research ideas. YH write the original manuscript. YH and WC carried out all the calculation work. BJ and YQ are responsible for the revision of the paper.
Funding
The research work is financially supported by the fundamental research funds for the central universities (31020190MS708). This work was carried out at the School of Power and Energy, Northwestern Polytechnical University, China.
Conflict of Interest
The authors declare that the research was conducted in the absence of any commercial or financial relationships that could be construed as a potential conflict of interest.
Publisher’s Note
All claims expressed in this article are solely those of the authors and do not necessarily represent those of their affiliated organizations, or those of the publisher, the editors and the reviewers. Any product that may be evaluated in this article, or claim that may be made by its manufacturer, is not guaranteed or endorsed by the publisher.
References
Butterfield, J., Yao, H., Benard, E., Price, M., Cooper, R., Monaghan, D., et al. (2003). Investigation of Weight Reduction in a Thrust Reverser Cascade Using Aerodynamic and Structural Integration [R]. Norfolk: AIAA, 2003–1576.
Butterfield, J., Yao, H., Curran, R., Price, M., Armstrong, C., Raghunathan, S., et al. (2004). Integration of Aerodynamic, Structural, Cost and Manufacturing Considerations during the Conceptual Design of a Thrust Reverser Cascade [R]. Reno: AIAA, 2004–2282.
Butterfield, J., Yao, H., Curran, R., Price, M., Armstrong, C., and Raghunathan, S. (2006). Integrated Methods for the Design of a Thrust Reverser Cascade. J. Propulsion Power 22 (4), 862–871. doi:10.2514/1.14446
Chen, J., Han, L., and Shan, Y. (2019). Study on Reverse Thrust Performance in Cascade Thrust Reverser[J]. Aeronaut. Comput. Tech. 49 (02), 34–36+42.
Hall, S., Cooper, R., and Raghunathan, S. (2006). “Fluidic Flow Control in a Natural Blockage Thrust Reverser[C],” in 3rd AIAA Flow Control Conference.
Han, L. (2006). Course of Artificial Neural Network[M]. Beijing: Beijing University of Posts and Telecommunications Press.
He, Y., and Liu, Y. (2010a). Effect of Blade Exit Angle and Pressure Ratio on Cascade Thrust Reverser Performance[J]. Sci. Technol. Eng. 10 (02), 458–465.
He, Y., and Liu, Y. (2010b). Effect of Blade Solidity and Pressure Ratio on Cascade Thrust Reverser Performance[J]. Aeroengine 36 (02), 16–21.
Liu, G., Yang, S., Wen, L., and Sun, Y. (2019). Static Analysis of Compressor Blade Based on Inverse Modeling [J]. J. Mech. Eng. 2019 (01), 50–53+56.
Lu, L., Qi, W., and Wang, L. (2017). Structural Designs and Statics Analysis of 2 MW Wind Turbine Blade[J]. Mater. Sci. Technol. 25 (03), 69–76.
Miao, Y. (2019). Fault Mechanism Anasysis of Fan Blade Based on Fluid-Structure Coupling[D]. Beijing: Beijing University of Technology.
Reemsnyderj, D. C., and Sagerser, D. A. (2015). Reverse Thrust Performance of a Variable-Pitch Fan Engine at Forward Velocity[J]. J. Aircraft 16 (12), 848–855.
Trelea, I. C. (2003). The Particle Swarm Optimization Algorithm: Convergence Analysis and Parameter Selection. Inf. Process. Lett. 85 (6), 317–325. doi:10.1016/s0020-0190(02)00447-7
Zhang, L., Liu, Y., Chun, L., and Deng, Y. (2019). Mechanical Performance Analysis of Wind Turbine Blade Web Based on Bionic Design [J]. J. Eng. Therm. Energ. Power 34 (09), 141–147.
Zhang, Y., and Eriqitai, Q. (2012). Aerodynamic and Structural Coupling Design for Cascade Configuration of Thrust Reverser[J]. J. Shenyang Univ. Technol. 34 (01), 56–62.
Keywords: reverse thrust blades, parametric design optimization, BP artificial neural networks, genetic algorithm, fluid-solid coupling
Citation: Huicheng Y, Qingzhen Y, Canliang W and Jin B (2022) Parametric Design Optimization of Reverse Thrust Blades and Analysis of Fluid-Solid Coupling. Front. Energy Res. 10:860337. doi: 10.3389/fenrg.2022.860337
Received: 22 January 2022; Accepted: 08 April 2022;
Published: 28 April 2022.
Edited by:
Lei Luo, Harbin Institute of Technology, ChinaReviewed by:
Qingjun Zhao, Institute of Engineering Thermophysics (CAS), ChinaJian Liu, Central South University, China
Copyright © 2022 Huicheng, Qingzhen, Canliang and Jin. This is an open-access article distributed under the terms of the Creative Commons Attribution License (CC BY). The use, distribution or reproduction in other forums is permitted, provided the original author(s) and the copyright owner(s) are credited and that the original publication in this journal is cited, in accordance with accepted academic practice. No use, distribution or reproduction is permitted which does not comply with these terms.
*Correspondence: Yang Huicheng, eWFuZ2hjQG1haWwubndwdS5lZHUuY24=
 Yang Huicheng
 Yang Qingzhen