 Yifan He
 Pengxu Chang3
- 1School of Energy Resources, China University of Geosciences, Beijing, China
- 2CNOOC (China) Co. Ltd. Tianjin Branch, Tianjin City, China
- 3No.6 Gas Production Plant, Changqing Oilfield Company, PetroChina, Xi’an, China
Determining the optimal well location is a challenging task because the effects of geological and engineering variables on reservoir performance are often highly nonlinear and multimodal. The computational requirements for this problem based on automatic optimization are extensive, as many functional evaluations are required, each of which requires a complete reservoir simulation. Therefore, reducing the optimization time and improving the optimization effect is the key to promote the wide application of automatic optimization technology. In this study, we present a technique that combines the genetic algorithm (GA) with the helper method, productivity potential maps (PPMs) (GA + PPMs), to improve the effect of well placement optimization. The PPMs are generated by three typical methods: analysis method, numerical simulation method, and fuzzy system method. Numerical tests are carried out on three well placement methods in the PUNQ-S3 oilfield, namely, the original well placement and well placement proposed by GA and GA + PPMs plans. The result shows that generating the PPMs by an analytical method is the best choice. The cumulative oil production (COP) generated by GA + PPMs increased by 20.95% and 8.09%, respectively, compared with the original well scheme and GA well scheme, which demonstrates that the initial well location determined by reservoir engineers based on the PPMs has a significant impact on GA performance. Overall, the combination of GA and productivity potential maps is promising for this challenging task.
1 Introduction
The determination of optimum well placement is one of the key issues in the development of oil and gas fields, whether it is the development of green fields or the management of brown fields (Ariadji et al., 2014). The problem in finding optimum numbers and locations of wells where the maximization of net present value (NPV) or the cumulative oil production (COP) is sought while minimizing costs and accommodating operating limits and other constraints is recognized as a nonlinear optimization problem with integer parameters (Cullick et al., 2005). The key step into handling this optimization problem is to find a pragmatic way to solve it. In general, intuition alone cannot determine the best well location because geological and engineering variables are associated with uncertainty and are often highly correlated. As well placement planning plays a critical role in return on investment, well placement decisions can be challenging for drilling and reservoir engineers. But fortunately, we could use the concept of automatic well placement optimization, which usually by means of reservoir model and mathematical optimization algorithm, to solve this complexity problem. However, almost 99% of CPU consumption is spent on the objective function evaluation based on numerical simulator (Yeten, 2003). Therefore, improving the optimization efficiency of automatic well placement optimization has been a difficult and challenging research direction for many scholars, which mainly includes reducing the optimization time and improving the optimization effect.
Da Cruz et al. (1999) first proposed the concept of PPMs in the area of well location optimization. This map is constructed in a way that measures whether a particular part of the reservoir is suitable for oil production or water injection. According to Da Cruz, this map allows us to determine the location of the wells, and give the uncertainty of the geology and the risk profile for decision makers. In the PPMs, reservoir engineers bring together static reservoir description data (such as permeability, porosity, and fluid viscosity), as well as dynamic reservoir production information (such as oil saturation and reservoir pressure). Typically, the generation of PPMs is based on reservoir numerical simulation models. There are several achievements in the literature that the utilization of PPMs guide the process of well placement optimization (Badru and Dissertation, 2003; Nakajima and Schiozer, 2003; Cottini-Loureiro and Araujo, 2005; Maschio et al., 2008).
According to literature research, many intelligent algorithms have been used in automatic well location optimization, including simulated annealing algorithm, genetic algorithm (GA), covariance matrix adaptation evolution strategy, and particle swarm optimization algorithm (Holland, 1975; Beckner and Song, 1995; Salmachi et al., 2013; Lu and Reynolds, 2019; Wang et al., 2007; Onwunalu and Durlofsky, 2010; Ding et al., 2020; Wang et al., 2012; Humphries and Haynes, 2015; Xu et al., 2018; Karkevandi-Talkhooncheh et al., 2018; Rostami et al., 2018; Rostami and Baghban, 2018; Ding et al., 2019; Wang et al., 2021; Mahdaviara et al., 2021). Readers can derive much information from a review article by Islam et al. (2020) on the application of artificial intelligence optimization techniques to well location optimization problems. Among them, GA is the most frequently used optimization algorithm because of its better performance. GA is a computational model that simulates the biological evolution process of natural selection and genetic mechanism of Darwin’s biological evolution. It is a method to search the optimal solution by simulating the natural evolution process. GAs have been applied in various areas of petroleum industry, from optimizing pipe diameter, determining pressure distribution, to corrosion detection, and including well location problems. However, GA is typically used as an integrated unit for reservoir simulators when determining the well location (Bittencourt and Horne, 1997; Montes et al., 2001; Guyaguler and Horne, 2001; Yeten et al., 2002; Morales et al., 2010; Salmachi et al., 2013). In this case, the well location given by the GA in each iteration needs to be evaluated using the results of a reservoir simulator, especially for large or complex reservoirs, which can take a considerable amount of time. Since GA is an iterative algorithm which is sensitive to initial values, this work will provide an initialization method with the help of productivity potential maps (PPMs) to solve this issue.
To the best of our knowledge, this is the first time that a combination of GA and PPMs for well placement optimization in the current literature is used (Islam et al., 2020). The purpose of this work is to select the appropriate generation method of PPMs and compare the effect of GA using PPM initialization and random initialization in well placement optimization. The organizational framework of this work is as follows: we first describe GA, productivity potential maps (PPMs), and well location optimization method in the combination of GA and PPMs in Sections 2. Then, the PUNQ-S3 numerical model in the case study in Section 3 is used to verify the proposed method. Finally, we made a brief summary in the “Concluding remarks".
2 Methodology
2.1 Genetic Algorithm (GA)
GA starts from a randomly generated population representing the set of possible potential solutions to the problem. In this work, random initializations will be replaced with the help of PPMs. The strategy of “survival of the fittest” is used to select relatively superior individuals as fathers, and then perform the genetic operation between the fathers. According to different problem situations, the decision variables will also be subject to different constraints of the problem. GA is mainly composed of genetic factor, chromosome, and population. Among them, genetic factor can be used as any decision variable, and the chromosome is regarded as the main carrier of genetic material which is a collection of many genetic factors. Therefore, the objective evaluation function of solving the issue could be abstracted as a function of chromosome, and the population can be defined as a collection of individual chromosomes (Kinnear, 1994).
The essence of genetic basic operation is a kind of simulated genetic operation of biological evolution, which generates initial group through coding in order to realize the species, and the individuals in the population can be operated according to the fitness value by basic genetic operation and the optimization process of “survival of the fittest”. It usually consists of three basic operations: selection, crossover, and mutation (Goldberg, 1989).
2.1.1 Selection
Selection operation is used to identify individuals in a population who perform down-step crossover or recombination operations and the number of offspring that the selected individuals will produce. The first step is to calculate the fitness and make the actual selection according to the size of their fitness for parental selection. In this work, roulette wheel selection (RWS) will be chosen as the selection strategy (Simon, 2013).
RWS, also known as proportional selection, is a simple selection strategy. The probability of an individual being selected is proportional to the size of its fitness, which will be converted into the probability of being selected in proportion. The wheel is divided into k fans because the operation will carry out k rounds of selection, and a uniform random number between 0 and 1 is generated for each round. Therefore, there will be k random numbers, which will be used as a pointer to determine the selected individuals. In fact, this process is equivalent to rotating the wheel k times, so as to obtain k pointer positions when the wheel stops. When the pointer stops in a sector, the individual represented by that sector is selected as follows:
a) Solving individual fitness
b) Calculate the probability
c The cumulative probability
2.1.2 Crossover
Crossover also known as gene recombination, is an operation in which the genetic structure of two paternal samples is mated and recombined to produce a new sample. The purpose of this operation is to generate new excellent individuals in the offspring, and at the same time, improve the global search ability of the algorithm. Due to the different representations of individual codes, single-point crossover will be used in this work. Single-point crossover refers that the value range of the crossover point K is [1, Nvar-1], where Nvar is the number of variables contained in an individual and is used as a demarcation point for variable transformation. Take the crossover of individuals with the number of individual variables being 8 as an example. Assume that the crossover operation is performed at 5, as shown in Figure 1.
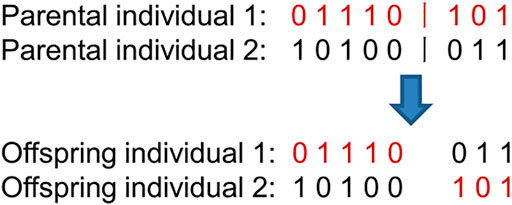
FIGURE 1. Illustration of single-point crossover.
2.1.3 Mutation
The variation performed by offspring after crossover operation is actually the transformation of offspring gene individuals by small step size or probability perturbation. The probability of individual variable change is inversely proportional to the number (dimension) of the variable, but has no relationship with population size. Generally, the value of the step of variation should not be too large. If the value is too large, the diversity of the population will be reduced or even lost, and the searching ability will also degenerate.
2.2 Productivity Potential Maps (PPMs)
It is considered that the convergence speed of GA at initial position is slow, PPMs is introduced in order to improve the efficiency of GA. Now, several methods have been proposed to calculate the productivity potential maps (Nakajima and Schiozer, 2003; Filho, 2005; Ding et al., 2019). Here we introduce some of the most promising methods and make some comparisons. According to the maps, it is easy for reservoir engineers to identify the most productivity potential regions.
2.2.1 Analysis Method
Based on the material balance and Darcy’s law, Nakajima and Schiozer (2003) proposed an analysis way to generate productivity potential field. The productivity potential is calculated in Eq. 3:
where
However, the above productivity potential method proposed by Nakajima and Schiozer (2003) do not consider the negative impact of bottom water and gas ceiling on the field development. Practice has proved that water cone and gas channeling will seriously affect the normal development of oil and gas, resulting in the decline of oil and gas production. Therefore, the effect of bottom water and gas ceiling needs to be considered. Therefore, the revised productivity potential value is described as follows (Ding et al., 2019):
where
2.2.2 Numerical Simulation Method
This method distributes wells evenly on a grid with the goal of covering the entire reservoir area. Two kinds of wells which are production wells and injection wells will be added to the reservoir grids (Filho, 2005). When engineers design a production strategy for an oilfield, water injection is usually used to keep-up pressure and increase reservoir production. Injection-production balance should be ensured throughout the simulation process. After the simulation, we can get the accumulative oil production of the grid where the production well is located, and the accumulative oil production of other rest grids can be obtained by a geostatistical method called the ordinary Kriging method. The normalized cumulative oil production is the productivity potential of the grid. Figure 2 shows the well placement in this method.
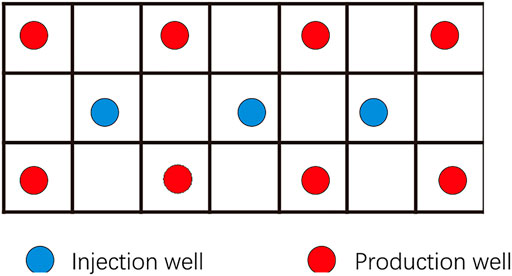
FIGURE 2. Illustration of well placement in evaluating the productivity potential by using the numerical simulation method.
2.2.3 Fuzzy System Method
Problems associated with decision making, such as well placement, can be complex and difficult to solve quantitatively. In recent years, fuzzy logic has been widely used to solve these kinds of problems. The advantage of fuzzy systems is that there is no need for computational models or mathematical equations to control the relationship between the input parameters and output, because the relationship is defined by simple rules based on the expert knowledge and experience (Nakajima and Schiozer, 2003). The basic steps of a fuzzy system are as follows:
① Combined sensitivity analysis with reservoir and crude oil feature, and the parameter needs to be evaluated can be determined. The common parameters are including oil saturation, porosity, permeability, distance to the nearest oil-water interface and net thickness of the pay zone.
② To calculate the weight of index, we usually adopt expert experience and the analytic hierarchy process.
③ After calculating the membership of each grid block, we can comprehensively evaluate the scores of each grid block. And then we can know the productivity index of every layer.
2.3 Well Placement Optimization Coupling GA With PPMs
2.3.1 Objective Function Evaluation and Constrains
In this problem, cumulative oil production (COP) is taken as the objective function. The COP is calculated by the cumulative annual oil production from the results of reservoir numerical simulation, as shown below:
where
If (xi, yi) is defined as the locations of well i and j, i, j = 1,2, … , nw , i≠j. There are three constraints during optimization:
① Minimum distance
② The coordinates of all wells should be integers:
③ All wells should be deployed in active grid cells:
For optimization problems with boundary constraints, applying GA directly may make some seeds leave the feasible region of the search space. In response to these unworkable solutions, we introduced penal measures; That is, if seeds are located outside an invalid grid or boundary, we pull these seeds back to the grids which are mostly close to the boundary.
2.3.2 Initializing the Seeds for GA
Given that GA is a stochastic global optimization method, most promising well locations are assigned to the initial seeds in order to help the GA can search the optimization well locations more efficiently. The promising well sites are selected by engineers according to the PPMs generated by the above three methods.
2.3.3 GA Coupling With PPMs Steps
First, we use the analysis method, numerical simulation method, and fuzzy system method to generate PPMs. Based on these maps, select some well sites as initial seeds.
Second, call simulation runs for about 20 years to calculate the COP objective function.
Third, determine whether the maximum number of iterations is satisfied. If the conditions are not met, go to step fourth.
Fourth, through the basic genetic operations (selection, crossover, and mutation) to get better populations.
Fifth, if the well locations proposed by the GA is not match, the constraint of minimum distance between wells, the program would randomly assign another location.
Sixth, repeat steps second,third, fourth, fifth until the termination criterion is met.
Figure 3 illustrates the optimizing well placement procedure proposed by the GA and PPMs.
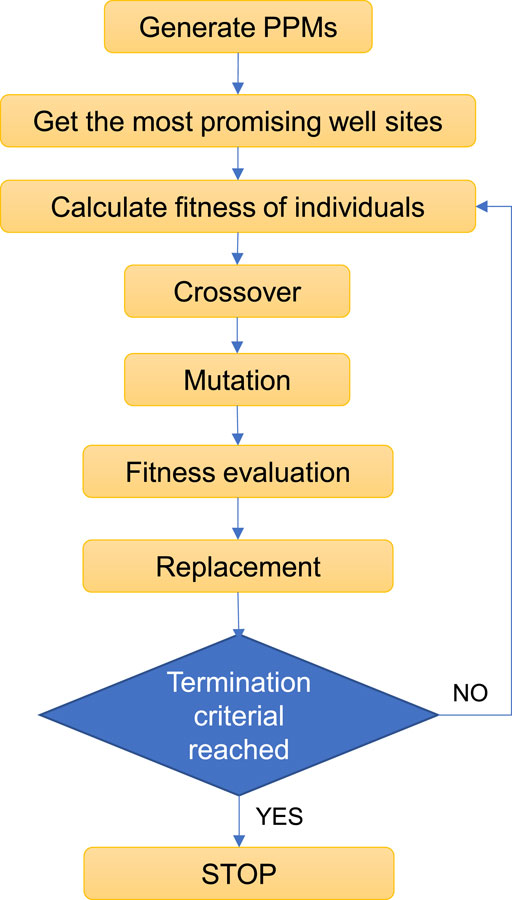
FIGURE 3. Optimizing well placement procedure proposed by GA and PPMs.
3 Case Study
3.1 Model Description
The PUNQ-S3 case comes from a reservoir engineering study of an actual field example provided by Elf Exploration Production. Several studies have been published demonstrating novel techniques on the PUNQ-S3 reservoir model (Wang et al., 2016; Ding et al., 2019). The numerical simulation model consists of 19 × 28 × 5 grid blocks, of which 1,761 blocks are active. The grid block size is set to 180 m × 180 m × 4.4 m, and the net to gross thickness ratio is set to 1. The reservoir has been modelled with corner point geometry. Three-dimensional horizontal permeability field are presented in Figure 4. The average matrix porosity and horizontal permeability are 13.9% and 269.37 mD, respectively. The structure at the top shows the field connecting the north and west with a fairly strong aquifer. A stingy crest is located at the center of the dome-like structure. The initial oil and gas saturation is set at 0.8 and the initial reservoir pressure is set at 236.51 bar. Water, oil, and gas coexist and flow without capillary pressure. The saturation ternary diagram is shown in Figure 5. The original field development plan consisted of 10 producing wells. The model gets its pressure support from a relatively strong aquifer and is bounded by a fault moving from east to south. There are no injection wells because the strong aquifer is connected to the field. The production wells are operated at a fixed bottom hole pressure (BHP) of 140 bar. The simulated reservoir life is 20 years. For this field, there are about
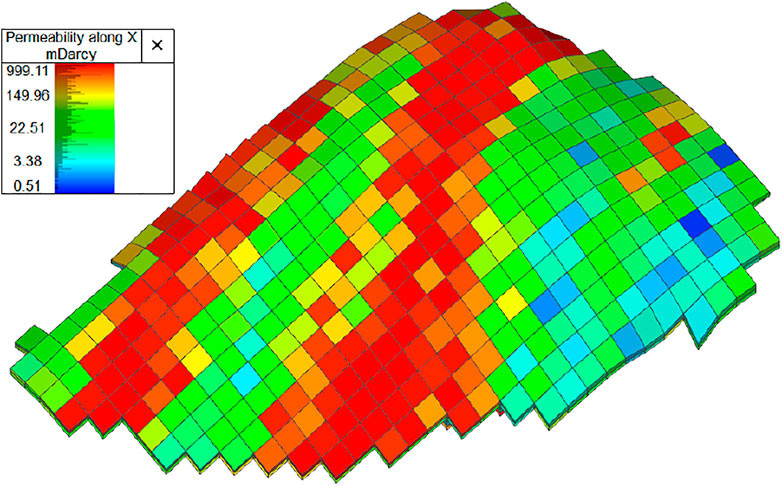
FIGURE 4. Three-dimensional horizontal permeability field of the PUNQ-S3 case.
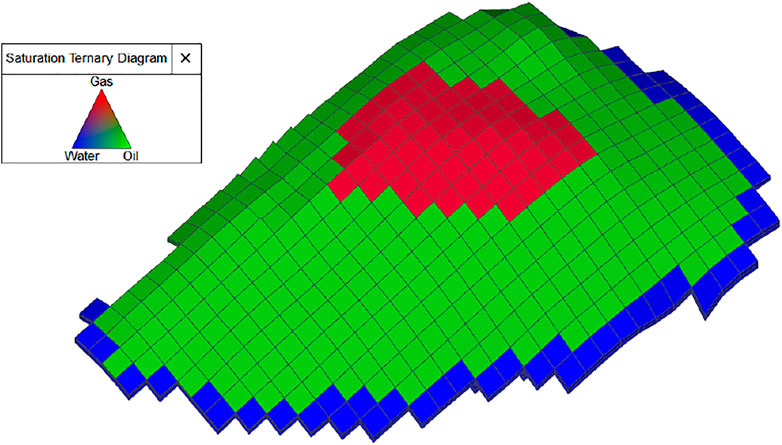
FIGURE 5. Saturation ternary diagram of the PUNQ-S3 case.
3.2 Selection of Production Potential Maps
The production potential maps (PPMs) produced by the three methods above which are analysis method, numerical simulation method, and fuzzy system method has been shown in Figure 6, respectively. From the maps, we can know that region A is the most promising area since it has the relative high production index shown by all three methods. In order to choose the most accurate map for initialization. We also do some comparison among these methods by drilling 10 wells in the top 30% production index area in each map. The locations of these 10 wells are shown in Figure 6 as the blank black circles. Unlike conventional well patterns, these wells are typically located in premium zones and are not in a conventional area pattern. Figure 7 is a statistical histogram of cumulative production proposed by the three methods and original well placement. From the results, we can know the analysis method is more reliable than the others. The cumulative oil production of the analysis method is 4.5×10⁶ m3, which is 15.38%, 4.65%, and 7.14% higher than the results of fuzzy system method, numerical simulation method, and original well placement, thus we assign the well locations in Figure 6(a) as the initial seeds for the GA in the following case study.
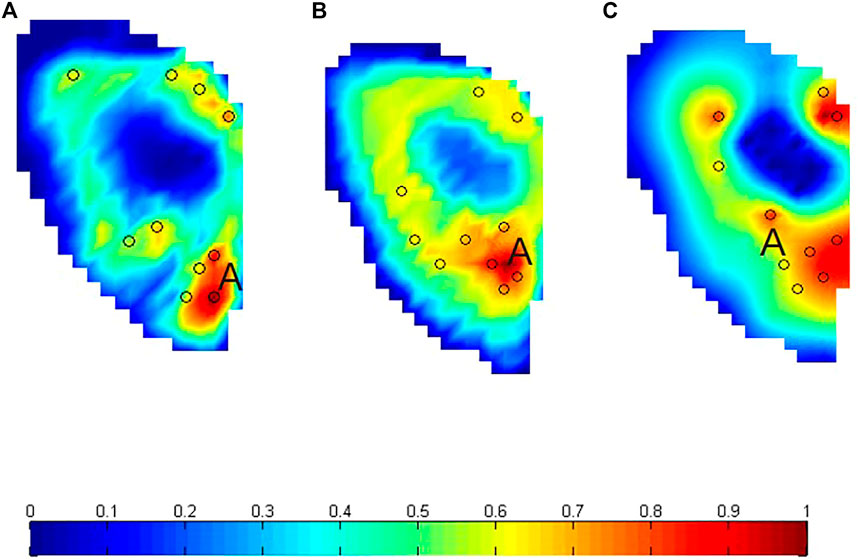
FIGURE 6. Production potential maps produced by (A) analysis method, (B) fuzzy system method, and (C) numerical simulation method.
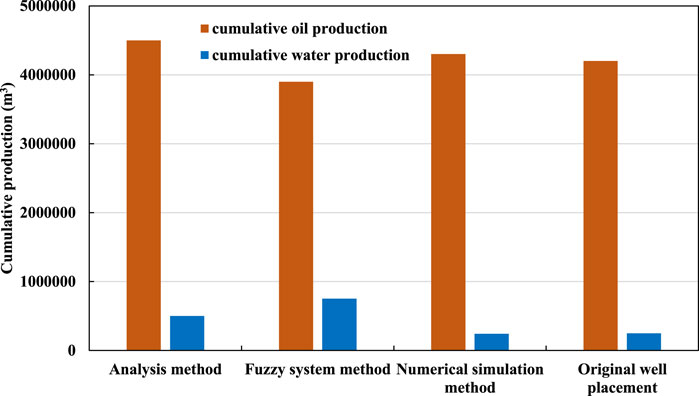
FIGURE 7. Comparison of well location results between the three methods and the original well plan.
3.3 Optimization of 10 Production Wells
In this section, 10 production wells will be optimized by the proposed method. Each well has the coordinate (x, y), thus the total number of variables to be optimized in this case is 20. The GA standalone and original well plan will be added as the comparison. The population size of GA is 50, and the probability of crossover and mutation are all set to 0.9. Maximum number of generations is 100 and minimum distance is two grids.
Each optimization is repeated 3 times to consider the stochastic nature of GA and their average results are used to compare the performance. Figure 8 is the average cumulative oil production produced by GA + PPMs, GA, and original well plan. As shown in Figure 8, the GA + PPMs based well location achieves the highest COP, demonstrating that the initial well locations determined by the reservoir engineer based on the PPMs is critical to the final performance of the GA. We can obtain a relatively high oil production even without iterations with the help of PPMs. we can also learn that the well plan proposed by GA + PPMs is 20.95% higher than the original well placement, 8.09% higher than the well plan proposed by the GA standalone. Figure 9 shows the optimal well locations obtained by GA + PPMs method. It is clear that these producing wells are often located in areas with a high production potential, and the well pattern does not appear to have any regular form which indirectly demonstrates the effectiveness of the application of PPMs. Taken in total, it can conclude that GA + PPMs is a reliable method to optimize the well placement.
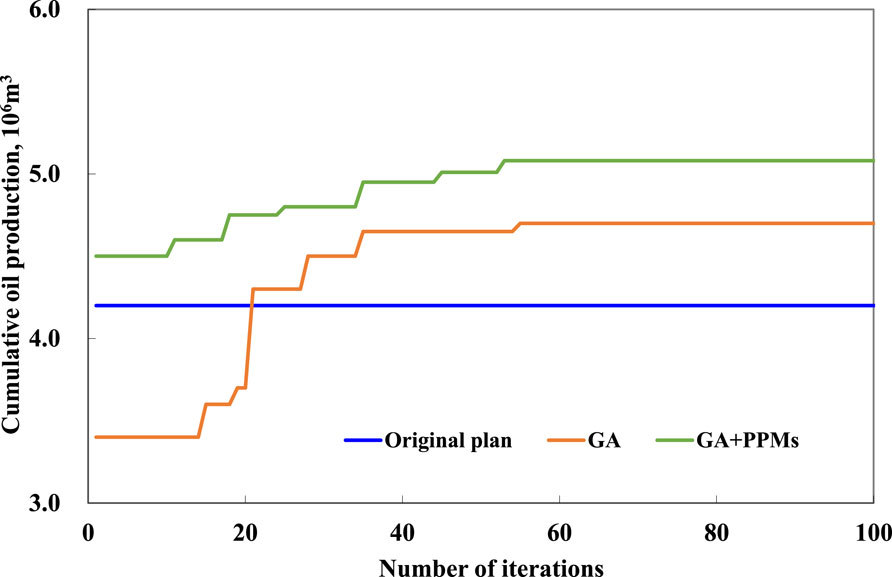
FIGURE 8. Curve of the cumulative oil production changing with the number of iterations proposed by GA + PPMs, GA, and original plan.
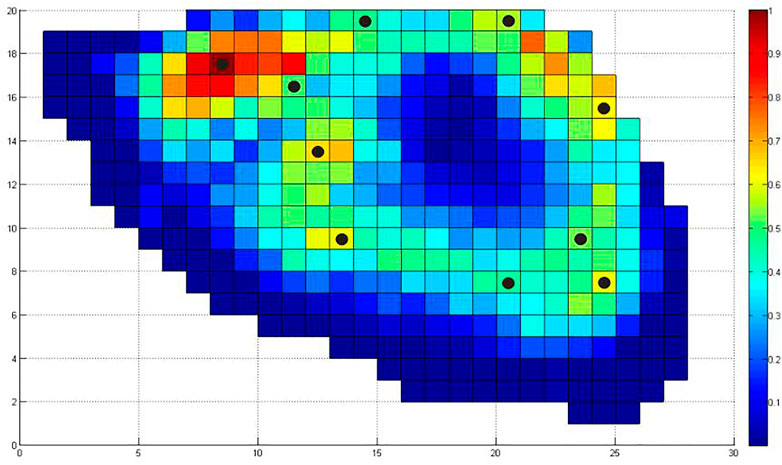
FIGURE 9. Optimum well placement proposed by the GA + PPMs method.
4 Concluding Remarks
In this work, we applied GA coupled with production potential maps (PPMs) for efficient well placement optimization problems.
The three methods namely analysis method, numerical simulation, and fuzzy system are used to generate production potential maps. The simulation results show that the analysis method is more effective than the other methods in guiding the well placement.
Although the reservoir engineer came up with a better well placement plan based on PPMs, the GA’s proposed well placement plan significantly improved the cumulative oil production with the help of PPMs. Practice shows that the initial well location determined by engineers according to PPMs is crucial to the final performance of GA. This method can be easily combined with any optimization algorithm.
Data Availability Statement
The original contributions presented in the study are included in the article/Supplementary Material, further inquiries can be directed to the corresponding author.
Author Contributions
YH: conceptualization, methodology, software, project administration, writing—original draft. PC: Further comb and analyze the data and revise the manuscript to meet the publishing requirements. YL: data curation, visualization. JC: visualization, investigation, writing—review and editing, supervision. CL: formal analysis, resources, writing—review and editing, project administration.
Conflict of Interest
Authors YH, YL, JC, and CL are employed by CNOOC (China) Co., Ltd. PC are employed by No.6 Gas Production Plant, Changqing Oilfield Company, PetroChina.
Publisher’s Note
All claims expressed in this article are solely those of the authors and do not necessarily represent those of their affiliated organizations, or those of the publisher, the editors, and the reviewers. Any product that may be evaluated in this article, or claim that may be made by its manufacturer, is not guaranteed or endorsed by the publisher.
References
Ariadji, T., Haryadi, F., Rau, I. T., Aziz, P. A., and Dasilfa, R. (2014). A Novel Tool for Designing Well Placements by Combination of Modified Genetic Algorithm and Artificial Neural Network. J. Petroleum Sci. Eng. 122, 69–82. doi:10.1016/j.petrol.2014.05.018
Badru, O. (2003). Well-placement Optimization Using the Quality Map Approach. M.Sc. Dissertation. United States: Stanford University.
Beckner, B. L., and Song, X. (1995). “Field Development Planning Using Simulated Annealing-Optimal Economic Well Scheduling and Placement,” in SPE Annual Technical Conference and Exhibition. Society of Petroleum Engineers. doi:10.2118/30650-ms
Bittencourt, A. C., and Horne, R. N. (1997). “Reservoir Development and Design Optimization,” in Proceedings of the SPE Annual Technical Conference and Exhibition. Paper SPE 38895. doi:10.2118/38895-ms
Cottini-Loureiro, A., and Araujo, M. (2005). “Optimized Well Location by Combination of Multiple-Realisation Approach and Quality Map,” in SPE Annual Technical Conference and Exhibition. SPE 95413. doi:10.2118/95413-ms
Cullick, A., Narayanan, K., and Gorell, S. (2005). “Optimal Field Development Planning of Well Locations with Reservoir Uncertainty,” in SPE Annual Technical Conference and Exhibition. SPE 96986. doi:10.2118/96986-ms
Da Cruz, P. S., Horne, R. N., and Deutsch, C. V. (1999). “The Quality Map: a Tool for Reservoir Uncertainty Quantification and Decision Making,” in SPE Annual Technical Conference and Exhibition. SPE 56578. doi:10.2118/56578-ms
Ding, S., Lu, R., Xi, Y., Liu, G., and Ma, J. (2020). Efficient Well Placement Optimization Coupling Hybrid Objective Function with Particle Swarm Optimization Algorithm. Appl. Soft Comput. 95, 106511. doi:10.1016/j.asoc.2020.106511
Ding, S., Lu, R., Xi, Y., Wang, S., and Wu, Y. (2019). Well Placement Optimization Using Direct Mapping of Productivity Potential and Threshold Value of Productivity Potential Management Strategy. Comput. Chem. Eng. 121, 327–337. doi:10.1016/j.compchemeng.2018.11.013
Filho, J. S. (2005). “Methodology for Quality Map Generation to Assist with the Selection and Refinement of Production Strategies,” in SPE Annual Technical Conference and Exhibition. doi:10.2118/101940-stu
Goldberg, D. E. (1989). Genetic Algorithms in Search, Optimization, and Machine Learning. Reading: Addison-Wesley.
Guyaguler, B., and Horne, R. N. (2001). Uncertainty Assessment of Well Placement Optimization. SPE Reserv. Evaluation Eng. 7. doi:10.2523/71625-MS
Holland, J. H. (1975). Adaptation in Natural and Artificial Systems. An Introductory Analysis with Application to Biology, Control, and Artificial Intelligence. Ann Arbor, MI: University of Michigan Press.
Humphries, T. D., and Haynes, R. D. (2015). Joint Optimization of Well Placement and Control for Nonconventional Well Types. J. Petroleum Sci. Eng. 126, 242–253. doi:10.1016/j.petrol.2014.12.016
Islam, J., Vasant, P. M., Negash, B. M., Laruccia, M. B., Myint, M., and Watada, J. (2020). A Holistic Review on Artificial Intelligence Techniques for Well Placement Optimization Problem. Adv. Eng. Softw. 141, 102767. doi:10.1016/j.advengsoft.2019.102767
Karkevandi-Talkhooncheh, A., Rostami, A., Hemmati-Sarapardeh, A., Ahmadi, M., Husein, M. M., and Dabir, B. (2018). Modeling Minimum Miscibility Pressure during Pure and Impure CO2 Flooding Using Hybrid of Radial Basis Function Neural Network and Evolutionary Techniques. Fuel 220, 270–282. doi:10.1016/j.fuel.2018.01.101
Kinnear, K. E. (1994). “A Perspective on the Work in This Book,” in Advances in Genetic Programming. Editor K. E. Kinnear (Cambridge: MIT Press), 3–17.
Lu, R., and Reynolds, A. C. (2019). “Joint Optimization of Well Locations, Types, Drilling Order and Controls Given a Set of Potential Drilling Paths,” in SPE Reservoir Simulation Conference Society of Petroleum Engineers. doi:10.2118/193885-ms
Mahdaviara, M., Rostami, A., Helalizadeh, A., and Shahbazi, K. (2021). Smart Modeling of Viscosity of Viscoelastic Surfactant Self-Diverting Acids. J. Petroleum Sci. Eng. 196, 107617. doi:10.1016/j.petrol.2020.107617
Maschio, C., Nakajima, L., and Schiozer, D. (2008). “Production Strategy Optimization Using Genetic Algorithm and Quality Map,” in Europec/EAGE Conference and Exhibition. SPE 113483. doi:10.2118/113483-ms
Montes, G., Bartolome, P., and Udias, A. L. (2001). “The Use of Genetic Algorithms in Well Placement Optimization,” in Proceedings of SPE Latin American and Caribbean Petroleum Engineering Conference, Argentina. Paper SPE 69439. doi:10.2118/69439-ms
Morales, A. N., Nasrabadi, H., and Zhu, D. (2010). “A Modified Genetic Algorithm for Horizontal Well Placement Optimization in Gas Condensate Reservoirs,” in Paper presented at the SPE Annual Technical Conference and Exhibition, Florence, Italy, September, 2010. doi:10.2118/135182-ms
Nakajima, L., and Schiozer, D. (2003). “Horizontal Well Placement Optimization Using Quality Map Definition,” in Canadian International Petroleum Conference. PETSOC-053. doi:10.2118/2003-053
Onwunalu, J. E., and Durlofsky, L. J. (2010). Application of a Particle Swarm Optimization Algorithm for Determining Optimum Well Location and Type. Comput. Geosci. 14 (1), 183–198. doi:10.1007/s10596-009-9142-1
Rostami, A., and Baghban, A. (2018). Application of a Supervised Learning Machine for Accurate Prognostication of Higher Heating Values of Solid Wastes. Energy Sources, Part A Recovery, Util. Environ. Eff. 40 (5), 558–564. doi:10.1080/15567036.2017.1360967
Rostami, A., Hemmati-Sarapardeh, A., and Shamshirband, S. (2018). Rigorous Prognostication of Natural Gas Viscosity: Smart Modeling and Comparative Study. Fuel 222, 766–778. doi:10.1016/j.fuel.2018.02.069
Salmachi, A., Sayyafzadeh, M., and Haghighi, M. (2013). Infill Well Placement Optimization in Coal Bed Methane Reservoirs Using Genetic Algorithm. Fuel 111, 248–258. doi:10.1016/j.fuel.2013.04.022
Simon, D. (2013). Evolutionary Optimization Algorithms: Biologically-Inspired and Population-Based Approaches to Computer Intelligence. Hoboken: Wiley.
Wang, C., Li, G., and Reynolds, A. C. (2007). “Optimal Well Placement for Production Optimization,” in Eastern Regional Meeting. Society of Petroleum Engineers. doi:10.2118/111154-ms
Wang, H., Ciaurri, D. E., Durlofsky, L. J., and Cominelli, A. (2012). Optimal Well Placement under Uncertainty Using a Retrospective Optimization Framework. SPE J. 17 (01), 112–121. doi:10.2118/141950-pa
Wang, S., Qin, C., Feng, Q., Javadpour, F., and Rui, Z. (2021). A Framework for Predicting the Production Performance of Unconventional Resources Using Deep Learning. Appl. Energy 295, 117016. doi:10.1016/j.apenergy.2021.117016
Wang, X., Haynes, R. D., and Feng, Q. (2016). A Multilevel Coordinate Search Algorithm for Well Placement, Control and Joint Optimization. Comput. Chem. Eng. 95, 75–96. doi:10.1016/j.compchemeng.2016.09.006
Xu, S., Feng, Q., Wang, S., Javadpour, F., and Li, Y. (2018). Optimization of Multistage Fractured Horizontal Well in Tight Oil Based on Embedded Discrete Fracture Model. Comput. Chem. Eng. 117, 291–308. doi:10.1016/j.compchemeng.2018.06.015
Keywords: automatic optimization, well location optimization, genetic algorithm, productivity potential maps, PUNQ-S3 model, numerical simulation
Citation: He Y, Chang P, Liu Y, Chen J and Li C (2022) Optimize Well Placement Based on Genetic Algorithm and Productivity Potential Maps. Front. Energy Res. 10:860220. doi: 10.3389/fenrg.2022.860220
Received: 22 January 2022; Accepted: 23 May 2022;
Published: 26 September 2022.
Edited by:
Abdolhossein Hemmati-Sarapardeh, Shahid Bahonar University of Kerman, IranReviewed by:
Sen Wang, China University of Petroleum, ChinaMehdi Mahdaviara, Amirkabir University of Technology, Iran
Alireza Rostami, Petroleum University of Technology, Iran
Copyright © 2022 He, Chang, Liu, Chen and Li. This is an open-access article distributed under the terms of the Creative Commons Attribution License (CC BY). The use, distribution or reproduction in other forums is permitted, provided the original author(s) and the copyright owner(s) are credited and that the original publication in this journal is cited, in accordance with accepted academic practice. No use, distribution or reproduction is permitted which does not comply with these terms.
*Correspondence: Yifan He, aGV5aWZhbjEyMTZAMTYzLmNvbQ==