 Ahmed Hamed
 Yidong Xia
 Nepu Saha
 Jordan Klinger
 David N. Lanning
 Jim Dooley2
- 1Energy and Environmental Science and Technology Directorate, Idaho National Laboratory, Idaho Falls, ID, United States
- 2Forest Concepts LLC, Auburn, WA, United States
Biomass has potential as a carbon-neutral alternative to petroleum for chemical and energy products. However, complete replacement of fossil fuel is contingent upon efficient processes to eliminate undesirable characteristics of biomass, e.g., low bulk density, variability, and storage-induced quality problems. Mechanical size reduction via comminution is a processing operation to engineer favorable biomass flowability in handling. Crumbler rotary shear mill has been empirically demonstrated to produce more uniformly shaped particles with higher flowability than hammermilled biomass. This study combines modeling and experimentation to unveil fundamental understandings of the relation between granular particle characteristics and biomass flow behavior, which elucidate underlying mechanisms and guide selection of critical processing parameters. For this purpose, the impact of critical material attributes, including particle size (2–6 mm), particle shape (briquette, chip, clumped-sphere, cube, etc.), and surface roughness, on the angle of repose (AOR) of milled pine chips were investigated using discrete element method (DEM) simulations. Forest Concepts Crumbler rotary shear system is used to produce milled pine particles within the same size range considered in DEM simulations. AOR of different sets of these particles were measured experimentally to benchmark DEM results against experimental data. Specific energy consumption for the comminution of biomass with different particle size and moisture content are measured for technoeconomic analysis. Our results show that the smaller size (2 mm) of pine particle achieves better followability (i.e., smaller AOR) while the energy cost of comminution is significantly higher and bulk density is almost the same as the 6-mm pine particles. For the 2-mm particle size, Crumbles from veneer have better flow properties than Crumbles from chips. Contrarily, no significant difference was observed between the AOR of the two materials for the 6-mm particle size. Furthermore, from DEM simulations, mechanical interlocking between particles was found as a dominant factor in determining AOR of complex-shaped particles such as milled pine, which cannot be accurately captured by using simple particle shapes (e.g., mono-sphere) with a rolling resistance model. Conversely, clumped-sphere model alleviates this limitation without increasing computational cost significantly and can be used for accurate representation of biomass granular particles when simulating free-flow behavior.
1 Introduction
The continuing global increase of energy demand dictates exploring more energy resources and expanding the utilization of available options, which should be accompanied by improving the efficiency of the existing technologies. At the same time, the rising concerns about climate change have led to international initiatives that attempt to enforce the decarbonization of energy systems by advocating the transition to clean energy technologies. Accordingly, more stringent constraints on greenhouse gas emission rates to decelerate the global warming effect puts diminishing fossil fuels in a least favorable position in the strategic planning for the future energy roadmap (Renewable Energy Agency, 2018). Bioenergy is a promising technology that can be a crucial player in supplying the energy needs in the years to come (U.S. Department of Energy Bioenergy Technologies Office, 2016). In addition to bioenergy, beneficial bio-based products (e.g., chemicals and materials) are produced during biomass conversion in the biorefinery, analogous to a petroleum refinery. Although biomass is a versatile source of energy with the advantage of being one of the few renewable energy sources that can generate energy on-demand, there are several technical challenges that need to be overcome before policy makers can depend widely on this naturally abundant resource. For example, unlike fossil fuel, the raw form of biomass is not suitable for energy applications due to several reasons including its low bulk density, low calorific value, high moisture and oxygen content, high variability, and hydrophilic nature (Ciesielski et al., 2020; Oyedeji et al., 2020). Consequently, biomass preprocessing is imperative. In this regard, different mechanical (e.g., size reduction and densification), chemical (i.e., washing and leaching), and thermal (e.g., drying and torrefaction) processes can be applied to produce high-quality, uniform feedstock from lignocellulosic biomass (Stelte et al., 2012). This is achieved through changing the biomass physical properties and chemical composition in a way that improves the biofuel conversion performance and efficiency (Gao et al., 2021). Biomass preprocessing techniques are energy intensive processes. Starting from the pretreatment of the raw biomass materials, the energy produced during the feedstock conversion must be much higher than the overall energy consumed in manufacturing the fuel for the biofuel to be economically competitive. In addition, logistics operations (i.e., storage, transport, and reactor feeding) represent another large component of the total cost of generating bioenergy in the biorefinery. Moreover, poor flowability of the biomass feedstocks can lead to process upsets, such as jamming and clogging, during the handling operations (Rackl et al., 2017; Jin et al., 2020; Xia et al., 2020; Lu et al., 2021). This, in turn, can further increase the cost by increasing the downtime. Therefore, optimizing all different processes involved in the production of the biomass feedstock is necessary for this industry to be viable on commercial scale.
Instead of depending on empirical techniques applying univariate trial-and-error methods to reach this goal, Quality by Design (QbD) is a science- and risk-based holistic approach that can be employed to advance the product and process quality in a streamlined, systematic way (Adam et al., 2011). In this approach, the identification of the critical process parameters (CPPs) and critical materials attributes (CMAs) is required to develop a thorough understanding of the relation between the final product quality and the involved materials and processes. In addition, the sensitivity of the end-product quality to the variation in these critical parameters should be determined. Comminution, which comprises several mechanical size reduction techniques such as impact, shear, or compression forces, is an example of an energy consuming unit operation used in the preprocessing of the biomass materials to change the particle size and shape.
Inspired by the QbD approach, the present study investigates the effect of the granular biomass particle characteristics on its flow behavior by combining experimental and computational work. More specifically, the Forest Concepts Crumbler® rotary shear system is used to produce a set of “matched” bulk feedstock samples from conifer veneer and chips that are used to compare the effect of feedstock physical properties, such as particle size and shape, on flowability properties, i.e., angle of repose (AOR). After milling, the feedstocks were dried to less than 10 percent wet-weight basis (%wb) in a low temperature (50°C) downdraft tray dryer. One objective is to compare the attributes and performance of similarly sized particles made from conifer veneer and from Douglas fir chips. The target nominal particle sizes are 6 and 2 mm geometric mean diameter. These represent the most common particle size specifications for gasification and catalytic fast pyrolysis, respectively. Both sizes are also used for biochemical conversion, depending on the pretreatment process, and are in the typical size range for thermochemical conversion of lignocellulosic biomass produced from woody residues. Furthermore, the specific energy consumption for comminution of the biomass with different particle size and moisture content of the feeds and products are measured to facilitate a potential technoeconomic analysis (TEA). Bottomless cylinder test is then used to measure the static AOR experimentally for the different sets of the milled particles to validate the simulation results. For the computational work, the particle-based discrete element method (DEM) is employed to examine the effects of the milled particle morphology models on the granular flow behavior. In details, the impact of particle size (2–6 mm), particle shape (briquette, chips, clumped-sphere, cube, etc.), and surface roughness on the AOR of milled pine are investigated.
AOR, defined as the steepest slope measured from a horizontal plane a heap of unconfined material can maintain without collapsing, is one of the critical parameters used to characterize the mechanical behavior of the granular materials (Cheng and Zhao, 2017; Beakawi Al-Hashemi and Baghabra Al-Amoudi, 2018). It depends on particle contacts and packing arrangements and indicates the self-stability of the materials under certain loading conditions and stress states. Therefore, it is used as a design parameter in applications that depend on slope stability such as bins and hoppers. For example, it is an important index in the design of silos for stockpiling. Moreover, AOR can be used as a quantitative indicator of material flowability. However, several material attributes influence the AOR, which make understanding the micro-behavior of the granular particles essential to reliably predict the macro-behavior, because of the interplay between various underlying mechanisms acting at different length and time scales. Zhou et al. (Zhou et al., 2014) found particle size as well as sliding and rolling frictions to be significant factors controlling the angle of repose in the case of a sand pile, while the bulk density, Young’s modulus, Poisson’s ratio, and the damping coefficients played negligible roles. The effects of lifting velocity and container shape on the repose angle in a bottomless cylinder test were examined by Liu et al. (Liu et al., 2014). They observed that the repose angle decreases when the lifting velocity or the material height is increased. On the other hand, the increase of the base roughness results in an increase of the AOR. In addition, Nakashima et al. (Nakashima et al., 2011) showed that the sensitivity of AOR to gravity is minimal. Many DEM simulations of AOR considered simplified particle shapes to improve the simulation efficiency and to reduce the computational cost. To examine the validity of this simplification, Chen et al. (Chen et al., 2019, 2020) studied the effect of particle morphology on the angle of repose of ballast materials. They concluded that simple particle shapes can satisfactorily make a good prediction of the AOR in the case of fine particles, where the particle size (rather than the particle morphology) is the predominant factor in determining the mechanical response. However, interlocking effects due to the angularity on the particle surface become more important for larger size aggregates. Liu et al. (Liu et al., 2014, 2020) used ellipsoidal particles to understand the effect of particle shape on flow behavior in cylindrical hoppers and it was found that spherical particles with unity aspect ratio achieves the highest flow rate, and that particle shape has a significant effect on the discharge rate.
From the discussion above, it is evident that DEM is an adept tool to tackle the AOR problem in granular materials. Its significance relies on the fact that emergent dynamics from the interplay between attractive interparticle forces (arising from interatomic and intermolecular interactions) and contact forces (due to friction and resistance to rolling and sliding along the heap surface) are still poorly understood. Thus, without the aid of numerical experiments, it is hard to make a theoretical prediction about which attribute is more important in determining the granular material flowability: particle size or particle shape. This question becomes more important in the case of milled biomass particles with their complex shapes and the high energy consumed in the comminution process. The answer to this question imposes an additional constraint that should be considered in optimizing the system of biomass materials preprocessing, feeding, and handling. The present work sheds light on the impact of particle size and shape on the granular flow behavior and the cost to produce such particle size in terms of the specific energy consumption. The rest of the paper is organized as follows: In the next section, the comminution process for Douglas fir pine is explained, as well as the evaluation of specific energy consumption data for the comminution process. In addition, the bottomless cylinder test is described, and the computational approach is detailed in the same section. In Section 3, the DEM simulation results of AOR are presented and compared with the experimental results. Moreover, the implications of the particle size and particle shape are discussed, and the computational cost of the DEM simulations is analyzed. Finally, conclusive remarks are outlined in Section 4 along with an outlook for future research directions.
2 Materials and Methods
2.1 Comminution Process for Douglas Fir Pine
Forest Concepts, LLC produced a set of “matched” bulk feedstock samples from wood veneer and chips that were used to compare the effect of feedstock particle characteristics on flowability properties, i.e., AOR. A single, locally harvested, Douglas fir tree was sectioned into logs and delivered to Forest Concepts in March 2021. The veneer was made by Forest Concepts with its centerless lathe from the Douglas fir logs freshly cut in Edgewood, WA. The log sections were alternately assigned to two lots for the wood veneer processing. The log lots were processed at separate lathe settings to produce veneer with 2 and 6 mm nominal thickness required for downstream processing. The softwood wood chips were supplied at the same time by Shearer Brothers in Shelton, WA for a second preprocessing stream. All materials were comminuted using a Crumbler® rotary shear milling and screening system to produce either the 6-mm or 2-mm nominal particle size feedstocks.
A Forest Concepts Model M24S-30e rotary shear milling system was used for preprocessing to produce Crumbles® from the Douglas fir softwood wood chips and wood veneer, see Figure 1 for a depiction of the Crumbler® rotary shear system. Particles from wood veneer are observed to be more cubic, have more surface checking, and have a more defined length than particles produced from wood chips. Wood chips, on the other hand, exhibited a needle-like shape. Figure 2 shows batches from the different samples produced. In the case of veneer, particle thickness is established by the thickness of veneer and particle length is established by the cutter thickness, as the veneer is fed into the rotary shear with the grain parallel to the cutter shaft (i.e., cross-grain). Particle width is less defined as it is created by particle breakage parallel to grain. In contrast, wood chips feed into the rotary shear cutting heads at a random orientation since the chips have nearly equal length and width. Recirculation of the output from one rotary shear unit to another, or recirculation from a screen that has capability to sort by length enables recutting of high-aspect-ratio particles into more cubic shapes. Processing heads with appropriate cutter sets were used during comminution to 6 and 2 mm nominal sizes. The Forest Concepts standard 6-mm nominal size is produced by final screening with a 12.5 mm (1/2-inch) round-hole top screen and a 2.38 mm (3/32-inch) wire mesh bottom screen using the Forest Concepts Model 2448 orbital screen system. The Forest Concepts standard 2-mm nominal size is produced by final screening with a 3.97 mm (5/32-inch) round-hole top screen and a 0.76 mm wire mesh bottom screen. After milling to size, each material was dried on trays in a Forest Concepts custom cabinet-type downdraft dryer set for 40–50°C. Drying generally took 12–16 h. Low temperature drying is used to avoid loss of volatile organic compounds or otherwise thermally modify the bulk materials. Raw Douglas fir wood veneer and chips had an initial moisture content of 37–44 percent wet-weight basis (wb), well above the fiber saturation level and typical of green wood. After milling, and drying, the final feedstocks had a moisture content between 6 and 10% (wb). Bulk density ranged from 124 to 151 kg/m3 at the final as-shipped moisture contents.
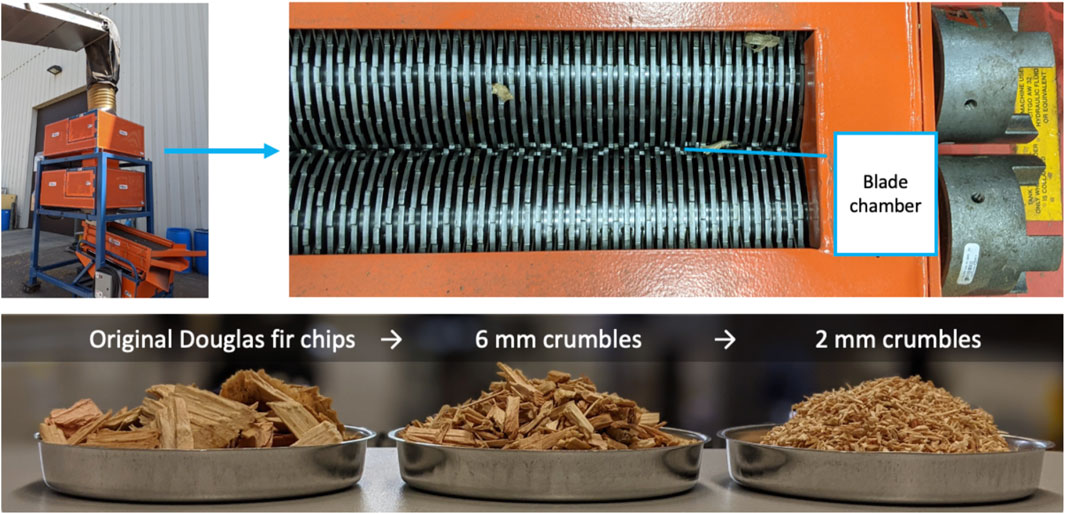
FIGURE 1. The Forest Concepts Crumbler® rotary shear system at Idaho National Laboratory.
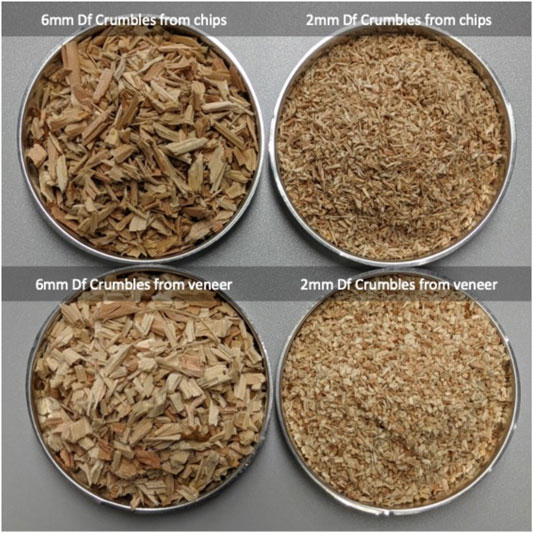
FIGURE 2. The four types of Crumbler comminuted Douglas fir pine particle samples.
2.2 Comminution Energy Evaluation Procedure
Although the main objective of this study is to quantify the effects of particle characteristics on the flowability of Crumblers, the cost of the comminution process is an equally important aspect that should be always considered side by side with the mechanical performance of feedstocks. To emphasize the importance of the technoeconomic aspect in optimizing feedstocks performance, the present section will be dedicated to cover the method of calculating comminution energy as a mean to include the cost factor in making recommendations about different Crumblers (as will be shown later). Engineering design data for operational biomass milling facilities needs to project the expected total connected power needed to supply a comminution system. The projected total connected power (total energy multiplied by mass flow rate), or the total power needed at a machine including inefficiencies, is a critical value for scaled plant design. While we can directly scale the specific comminution energy from one feed rate to another, the no-load power must be estimated using engineering judgment or other heuristics. In the following section, the method used to evaluate different parameters needed to calculate the comminution energy will be explained. In addition, implied assumptions will be outlined.
2.2.1 Mass Measurement and Normalization
To determine the as-processed moisture content, Forest Concepts follows a practice of measuring the actual mass at the outfeed from comminution equipment during energy experiments. A sample of the outfeed material is either oven-dried using 50–500-g samples or tested in a rapid moisture analyzer (Arizona Instruments Computrac® Max 4000XL) using 5–10-g samples following standard protocols to determine the oven dry mass of the material processed. The mass flow rate during processing is then stated in terms of oven dry mass per unit time, e.g., oven dry megagrams per hour equivalent (odMg/hour).
2.2.2 Total Energy (Measured)
Total energy is important because it is the most directly measurable energy value from which specific and total connected design energy are calculated. The as-measured total energy is defined as the measured connected electrical load energy input into an actual machine used to conduct an energy consumption experiment. While measuring the electrical feed to a processing device, it is important to be aware that total energy to get the mechanical power output must be adjusted for the power factor. When processing biomass at partial load, total energy will be overstated if voltage and amperage are the only measurements taken. Power measurement must include volts, amps, and phase angle when the machine is powered by an electric motor to account for motor reactive power (power that does not contribute to mechanical work, an artifact of electric motor design). An extensive discussion of power measurement and calculation is included in an American Society of Agricultural and Biological Engineers (ASABE) paper published in 2011 (David N Lanning et al., 2011). The measured total energy,
Total energy is expressed in terms of energy consumed per unit mass of material processed. A limitation of the total energy method is that the reported energy consumption includes both the specific energy used in actual processing and the drivetrain energy due to friction in the motor, gearboxes, belts, chains, etc. While the actual processing energy is expected to directly relate to biomass feed rates, the drivetrain energy (also called no-load energy) tends to be constant and essentially independent of biomass loading rate. Total energy is thus dependent on machine feed rates and does not scale well from laboratory experiments to commercial-scale well-designed machine systems. The no-load energy rate must be measured and subtracted from the total energy to obtain the actual comminution energy required for milling the material. This value is called Specific Energy.
2.2.3 Specific Energy (Calculated)
Specific energy can be conceptualized as the amount of energy that is consumed per unit mass of the process beyond what is required to operate the machine with no material. It is the energy that goes into the material to convert infeed particles into smaller outfeed particles. This includes all energy expended in reducing the size of the material, raising the temperature of the material, particle friction, or changing the material moisture content but does not include drivetrain losses, bearing friction, or motor inefficiencies. Specific energy is a critical design value as it is scalable. It can be used to determine the energy requirements for both large and small-scale operations. This value can also be compared to other processes regardless of machine type, quantity, or mass flow rate of material processed. Methods for measurement are detailed in (David N Lanning et al., 2011). Specific energy is often calculated from measurements of the connected electrical load energy prior to processing biomass (no-load energy) and during processing of the biomass (total measured energy, as described above). Subtraction of the no-load from the total during processing yields a reasonable estimate of the specific energy, provided changes in power factor and other drivetrain efficiencies are accounted for. The specific energy,
2.2.4 Total Connected Design Energy (Calculated)
Specific-to-total energy or “S/T ratio” can be used to estimate total connected design electrical energy load,
The total connected design power,
The value of the S/T ratio is determined based on experience and is specific to machine configuration and power source (electric, hydraulic, direct-drive, geared, pneumatic, etc.). A specific hammermill may not have the same S/T ratio as a rotary shearing Crumbler machine or a screen. For reference, when fully and continuously loaded, the Crumbler M24 series machines routinely demonstrate an S/T ratio of 70–85%. As such, a reasonable S/T ratio value for the Crumbler machine is 75% for an at-scale production facility with continuous operation. All total connected design energies and powers reported herein assume an S/T ratio of 75%.
Table 1 provides the values of the specific and design comminution energy for the different particles, along with the initial and final moisture content. As expected, comminution energy was inversely proportional to target particle size. Production of 2-mm nominal size particles consumed approximately 6–8 times as much specific energy as for 6-mm nominal size particle production. In these calculations, design energy values assumed a 75% energy efficiency for motors and drives powering the comminution equipment. Thus, the comminution energy to produce 6-mm nominal size particles is approximately 9 kwh/odt and the energy to produce 2-mm nominal size particles is in the range of 60–70 kwh/odt, depending on the processing pathway. The energy consumed to produce the raw wood chips is not known. We use the value of 5.5 kwh/odt (19.9 MJ/odt) as reported in the literature (Papworth and Erickson, 1966). The design energy for producing rotary veneer from the logs was 9 kwh/odt for the 6-mm veneer and 14 kwh/odt for the 2-mm veneer.
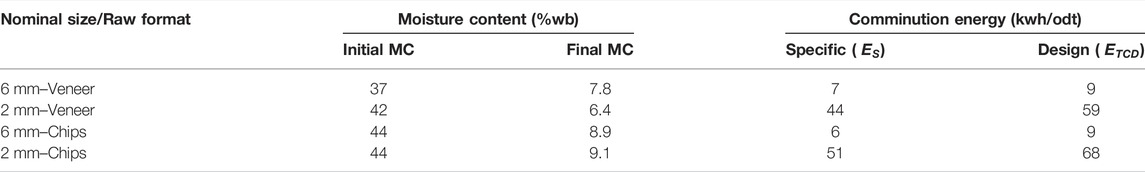
TABLE 1. Moisture content and comminution energy for crumbles from wood veneer and chips feedstocks.
2.3 Bottomless Cylinder Test and AOR Measurements
The static AOR was measured experimentally at Idaho National Laboratory (INL) for the different samples produced by Forest Concepts. For this purpose, a bottomless (lifting) cylinder test was utilized to contain the sample and generate the pile with little disturbance and equal radial distribution. A hollow polycarbonate cylinder, 7.5 cm in internal diameter and 38 cm long, and a smooth stainless-steel surface (serving as a base) were used for this set of experiments. The distance from the center along the four principal directions was graduated to track the onset and dimension of the pile base. During a typical experiment, the cylinder was placed vertically at the center of the stainless-steel surface shown in Figure 3A. The cylinder was filled with a prepared material to a height of 30 cm, see Figure 3B. This allowed about 8 cm of empty space to exist between the top of the sample and the cylinder top base to minimize the end effect. The cylinder was lifted manually with caution (slowly with a pull-out velocity around 1.5 m/min). To minimize the human error in the measurement and have a qualitative comparison, only a single operator conducted the whole set of experiments. The material formed a pile while being released from the cylinder as demonstrated in Figure 3C. The static AOR was measured from the pile by using two methods: i) direct measurement, and ii) indirect measurement. In the direct measurement a digital protractor was used with a readout to 0.1°, see Figure 3D. The device was placed on the hypotenuse of the pile in at least four different locations and the measurements were averaged. For the indirect measurement the height (h) and the radius (r, taken as the average of the four readings along the four principal directions) of the pile were measured and used to calculate the AOR from the relation
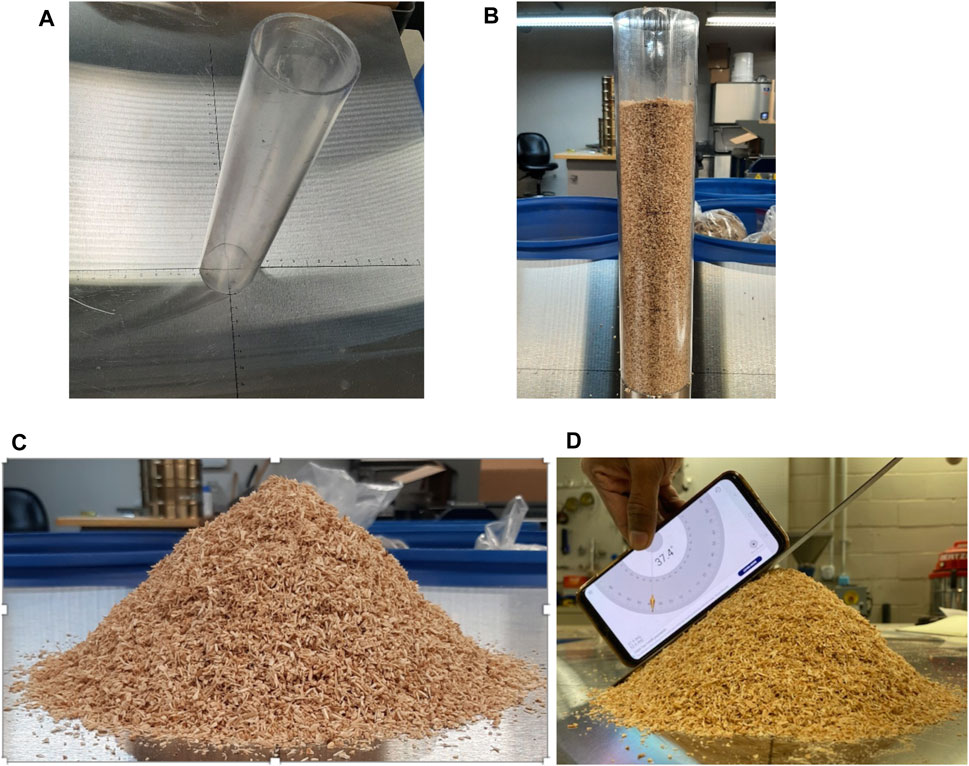
FIGURE 3. Experimental setup and measurement technique of the static AOR (A) empty setup, (B) cylinder loaded with sample, (C) pile formation, and (D) direct AOR measurement using digital protractor.

TABLE 2. Direct and indirect measurement of static Angle of Repose (AOR).
2.4 Computational Approach: DEM Model Description
The discrete element methods (DEM) used in the present study refer to a family of computational models that are widely used to simulate the dynamics of particulate materials and predict their behavior. This method is of particular interest to problems pertinent to granular flow, powder mechanics, and rock mechanics (Cleary and Sawley, 2002; Scherer et al., 2016; Zhong et al., 2016; Rackl et al., 2017). It was originally introduced by Cundall and Strack (Cundall and Strack, 1979). Like molecular dynamics (MD), DEM explores the temporal evolution of its constituents in the phase space by solving the Newton’s equation of motion. However, unlike MD, DEM does not resolve the atomic structure. Instead, a DEM particle is a granular or coarse-grained particle representing an ensemble of material atoms and/or molecules at a length scale that typically spans a range between submicron up to a few centimeters. Due to the finite-size nature of DEM particles, rotational degrees of freedom are considered explicitly and stateful contact is trackable. DEM is relatively computationally intensive, and for this reason many DEM studies employ simple shapes (mainly single sphere) for the model particles. This common practice is attributed to the reduction in the computational cost gained from speeding up the force calculation and contact detection, in addition to achieving efficient scaling performance on parallel computers. To capture the actual particle shape effects on the simulated dynamics, a rolling resistance model is usually invoked with an adjustable parameter called the coefficient of rolling friction (Abbaspour-Fard, 2004; Wensrich and Katterfeld, 2012). However, the accuracy of this practice is not clear and requires the recalibration of the model parameters for different particle shapes. To better approximate particles with complex shapes, clumped-sphere model can be employed (Kruggel-Emden et al., 2008). In this model, each particle consists of several rigid base spheres connected by unbreakable bonds and spatially arranged in a way that mimics the targeted shape. Nevertheless, clumped-sphere models are not well suited to model situations where the loading conditions can lead to particle deformation. Another class of DEM simulations make use of bonded-sphere models to account for the deformability of the particles (Xia et al., 2019; Guo et al., 2020, 2021). The main difference between the clumped-sphere and the bonded-sphere models lies in the nature of the bonds connecting the base-spheres comprising individual DEM particles. Unlike the clumped-sphere models, the bonds in the bonded-sphere models can carry forces and moments and allow relative displacements between the base-spheres by the act of external forces. In addition, the bonds between the base-spheres can be broken according to specific criteria, i.e., when the normal or shear stress exceeds the bond strength. A recent review of the state-of-the-art DEM models for the flow of milled biomass can be found in (Xia et al., 2020). More information can also be found in (Coetzee, 2017). In the present work, bonded-sphere models were not considered, as particle deformation is not important in the simulation of the bottomless cylinder test with the granular material heap being unconfined and the gravitational force is the only acting external force.
2.4.1 DEM Fundamental Model Formulation
The system dynamics in DEM is governed by the conservation of linear and angular momentums. So, the translational and rotational motions of particle i are given by, respectively,
In the above, the subscripts denote the particle index;
In the current work, the Hertz-Mindlin contact model (Hertz, 1882; Mindlin and Deresiewicz, 1953) is used to represent the particle-particle interaction forces. In this model, the contact forces have two components, namely, a normal force and a tangential force. Each component is represented by the sum of two terms accounting for elastic and damping forces. In the case of the normal force, it consists of a spring force and a damping force, while for the tangential force a shear force and a damping force are utilized. It is worth noting that the shear force bears a memory effect, as it depends on the history of the relative tangential displacement between the two interacting particles over the time they are in contact. Overall, the pairwise contact force in Hertz-Mindlin model takes the form
with Coulomb friction limit imposed on the magnitude of the tangential force. This yield
where
The model parameters
where the equivalent Young’s modulus (
In the above relations,
The torque exerted by particle j on particle i can be defined as
The three torque components on the right-hand-side of Eq. 14 refer to the torques generated by the tangential contact forces, the rolling friction, and the normal contact forces, respectively. The normal force contribution to the total torque arises when its line of action does not pass through the particle center. Moreover, asymmetric normal forces produce the rolling friction torque, which always acts in the opposite direction of the relative rotation between the two particles to slow it down. Several physical mechanisms can cause rolling friction to be present at the contact between two particles or at the contact between a surface and particle. Micro-slip and friction, plastic deformation, viscous hysteresis, and surface adhesion are all examples of these mechanisms (Ai et al., 2011). In addition, as discussed earlier, the use of idealized spherical shapes in DEM modelling requires considering rolling friction to account for the shape effects due to the non-spherical nature of real particles. A directional constant torque model is used for the rolling friction description in the current work. As the name suggests, in this model the pairwise torque is assumed to be always acting in the opposite direction of the relative rotation between the two interacting particles. Furthermore, the magnitude of the torque depends linearly on the magnitude of the normal contact force. Accordingly, the rolling friction torque acting at the contact between two particles i and j can be expressed as (Ai et al., 2011)
with
2.4.2 AOR Calculation Algorithm From DEM Data
Due to the discrete nature of the granular material with edgy particles and broad range of grain size distribution, the resulting material heap in the bottomless cylinder test is always nonuniform. This deviation from a perfect conical shape is intensified by the initial random packing of the cylinder at rest. The non-ideal heap shape introduces a challenge in the analysis of the angle of repose from the DEM simulation results, as the irregular outline curves make the determination of the flank angle difficult, see Figure 4. So, for high reproducibility of the analysis and for the evaluated AOR to be reliable, a robust algorithm is needed with numerical errors estimated (Fraczek et al., 2007; Liao et al., 2021; Müller et al., 2021). In this study, an algorithm was developed to achieve this goal. For this purpose, following (Müller et al., 2021), the definition of the angle of repose was modified to be the steepest average slope, measured from the horizontal plane, a distinct volume of the unconfined material heap can maintain without collapsing. The enhanced definition accommodates the local variation of the slope arising from the nonuniform heap and cohesive materials by avoiding the overestimation of the angle of repose that occurs when the steepest slope is used. It also accounts for the fact that some of the granular particles may settle at locations far from the main heap, which introduces error in the calculations of the slope. Our algorithm consists of three main steps. They can be summarized as follows:
1. Cluster analysis is performed using the centroid coordinates of DEM particles after the end of the simulation, see Figure 4B. A cut-off distance is used as the criterion to determine whether a particle belongs to a given cluster. If the distance between the particle and any of the particles belonging to the cluster under consideration is found to be less than a factor of 1.1 multiplied by the sum of the two particles radii, then the particle is assigned to that cluster. This procedure is repeated until each individual DEM particle in the system is assigned to a certain cluster. It is worth noting that every DEM particle belongs to one and only one cluster. Afterwards, the clusters are organized in descending order according to their size, and the largest cluster is considered the distinct heap volume and used for further analysis. In this regard, in all simulations, one very large cluster containing at least 70% of the total number of the particles in the system was always observed, in addition to a much smaller, scattered clusters.
2. To evaluate the average radial extent of the particles within the heap, the volume enclosing the largest cluster is discretized. The discretization scheme employs the cylindrical coordinates. It works by first dividing the total height along the vertical z direction into 20 equally spaced slabs, and then the angular domain within each slab is divided into small bins with an azimuth angle increment of 5°. Within each element of volume, the particle with the farthest radial distance is located, and this radial distance (measured from the heap center) is used as the maximum particle radial extent for that volume element. Next, the average of the collected radial particle extent from different elements of volume at the same height (within the same slab) is calculated and used for further analysis. Figure 5 shows the variation of the radial particle extent versus the azimuth angle at different heap heights obtained from the analysis of a selected simulation case.
3. The heap slope is finally found by carrying out a linear regression using the data points calculated in the previous step comprising pairs of the average radial particle extent and the associated height. Figure 6 depicts the angle of repose calculated from the slope of the fitted line along with the raw data and the error in the estimated angle of repose due to the fitting error. The raw data appearing in Figure 6 was generated from the same simulation case used in Figure 5.
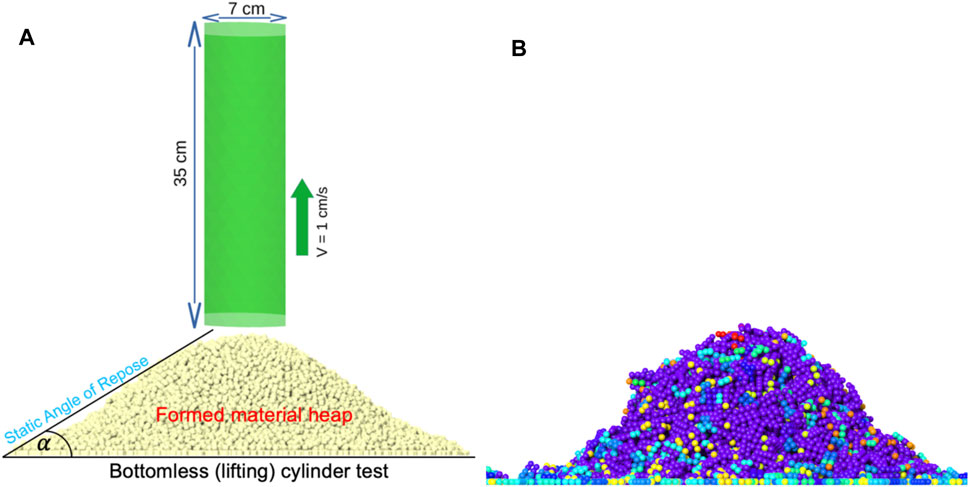
FIGURE 4. Simulation set-up of the bottomless-cylinder test (A) and the clustering analysis of the formed heap based on a cut-off distance (B).
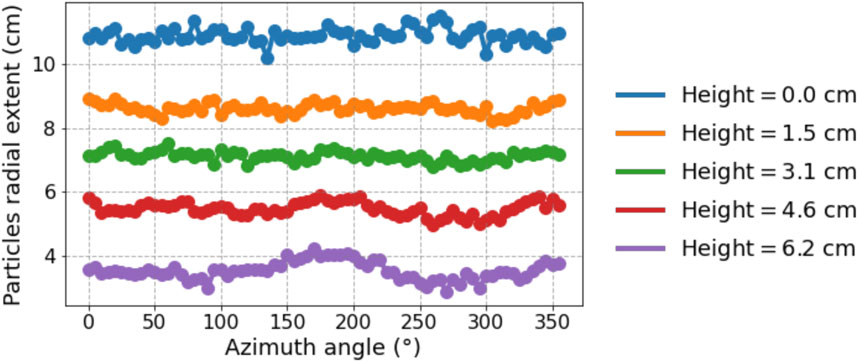
FIGURE 5. The variation of the particles radial extent of the formed heap at different heap heights as a function of the azimuth angle using 2-mm chips particle shape (case index #5 in Table 4) and the rolling friction coefficient of 0.5.
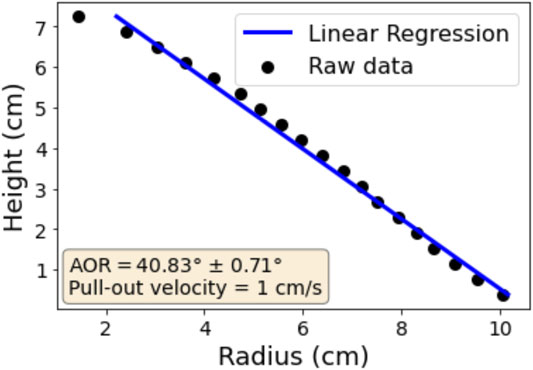
FIGURE 6. Determination of the static AOR by fitting a linear relation between the heap height and the averaged heap radius using the discretized angular domain scheme shown in Figure 5.
3 DEM Simulation Results and Discussion
3.1 Simulation Setup
As was highlighted earlier, several particle shape models were considered in the current DEM simulations. They consist of three clumped-sphere models (i.e., a cube composed of eight overlapping base-spheres; a cube composed of eight non-overlapping base-spheres; a chip composed of eight base-spheres arranged in a two-row by four-column layout), in addition to four individual particle shape models (i.e., briquette, cube, cuboid, and sphere). The overlapping and non-overlapping clumped-sphere cube models share the same shape. However, they differ in the surface roughness. On the other hand, the surface roughness of both the non-overlapping clumped-sphere cube and the clumped-sphere chip models are the same. Table 3 lists all particle shape models along with their dimensions and schematic diagrams. In addition, all DEM model parameters are listed in Table 4. It is worth mentioning that for every case shown in Table 3 two different sets of simulations were conducted: one with a rolling friction coefficient of 0.5 (as listed in Table 4) and the other with no rolling resistance (i.e.,

TABLE 3. List of DEM particle shape models.
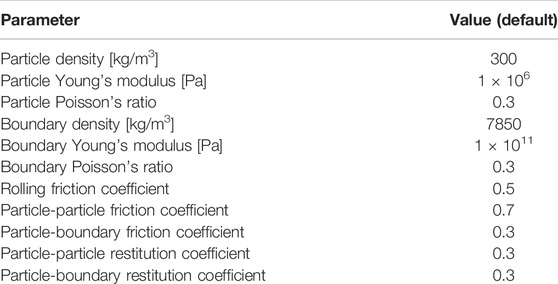
TABLE 4. Material and contact model parameters used in DEM particle simulations.
The DEM simulations of the bottomless cylinder test were performed using two different software. LIGGHTS-INL (Idaho National Laboratory, 2021), which is a capability extension of LIGGGHTS (LAMMPS improved for General Granular and Granular Heat Transfer Simulation) open-source DEM particle simulation software (Kloss et al., 2012), was utilized to simulate the clumped-sphere shape models as well as the single sphere shape model. Rocky DEM (Fonte et al., 2015; Xia et al., 2021) was employed to simulate the rest of the shape models considered in the current work. The main reason for using two different software is because of the difference in the available particle shape features supported by the two software. For example, contrary to Rocky DEM, the briquette shape was not available in LIGGGHTS-INL. Nevertheless, LIGGGHTS-INL efficient parallel computing capabilities make it more suitable for the computationally intensive simulations such as the ones adopting clumped-sphere models, with the total number of elementary particles in the simulation system scaling up by a factor of eight for the same DEM particle size. This remarkable increase in the system size dictates the use of high-performance computer (HPC) for an affordable computational time. To verify that results obtained from the two different software are comparable, the simulation of the particle shape model No. 13 (which adopts a single sphere with a diameter of 6 mm as the DEM particle) was carried out using the two software. In this comparison, the obtained angle of repose (from the set of simulation with the rolling resistance model invoked) was used as the criterion to assess the degree of agreement between the simulation results from the two software. A repose angle of 32.01° ± 0.95° was predicted by LIGGGHTS-INL, while the value obtained from Rocky DEM was 31.75° ± 0.89°. The good agreement indicates results obtained from the two different software packages can be directly compared without affecting our conclusions.
3.2 Particle Shape Impact on AOR and Underlying Mechanisms
One of the main objectives of this study is to understand the effect of particle shape on flow behavior of granular material. Table 5 presents the formed material heap for the three different clumped-sphere models [visualized with OVITO (Stukowski, 2010)], with and without the rolling resistance model invoked. In addition, the angle of repose analysis for each case is also shown in the same table. By examining the angle of repose obtained from the different clumped-sphere shape models, we find the values range from 28° to 45° with a numerical error that is smaller than 1°. It is evident that the values are high enough to reasonably represent milled biomass materials response. The chip model achieved the highest values for angle of repose, while the overlapping clumped-sphere cube model resulted in the lowest values. This trend was persistent regardless of the particle size. Furthermore, the effect of rolling resistance model on the angle of repose was minimal in all the clumped-sphere models. This was a strong indication that at a given particle size a different mechanism other than the rolling resistance controls the slope of the formed heap. Due to the complex-shape nature of the clumped-sphere models associated with high surface roughness, mechanical interlocking mechanism was considered as the culprit in the degradation of the particulate material flowability in the case of these shape models. This is consistent with our observation that for a particle having a cubic shape of a given size the angle of repose was always higher when non-overlapping base spheres are used. This is attributed to the high surface roughness achieved in this case when compared with the case of overlapping base spheres.
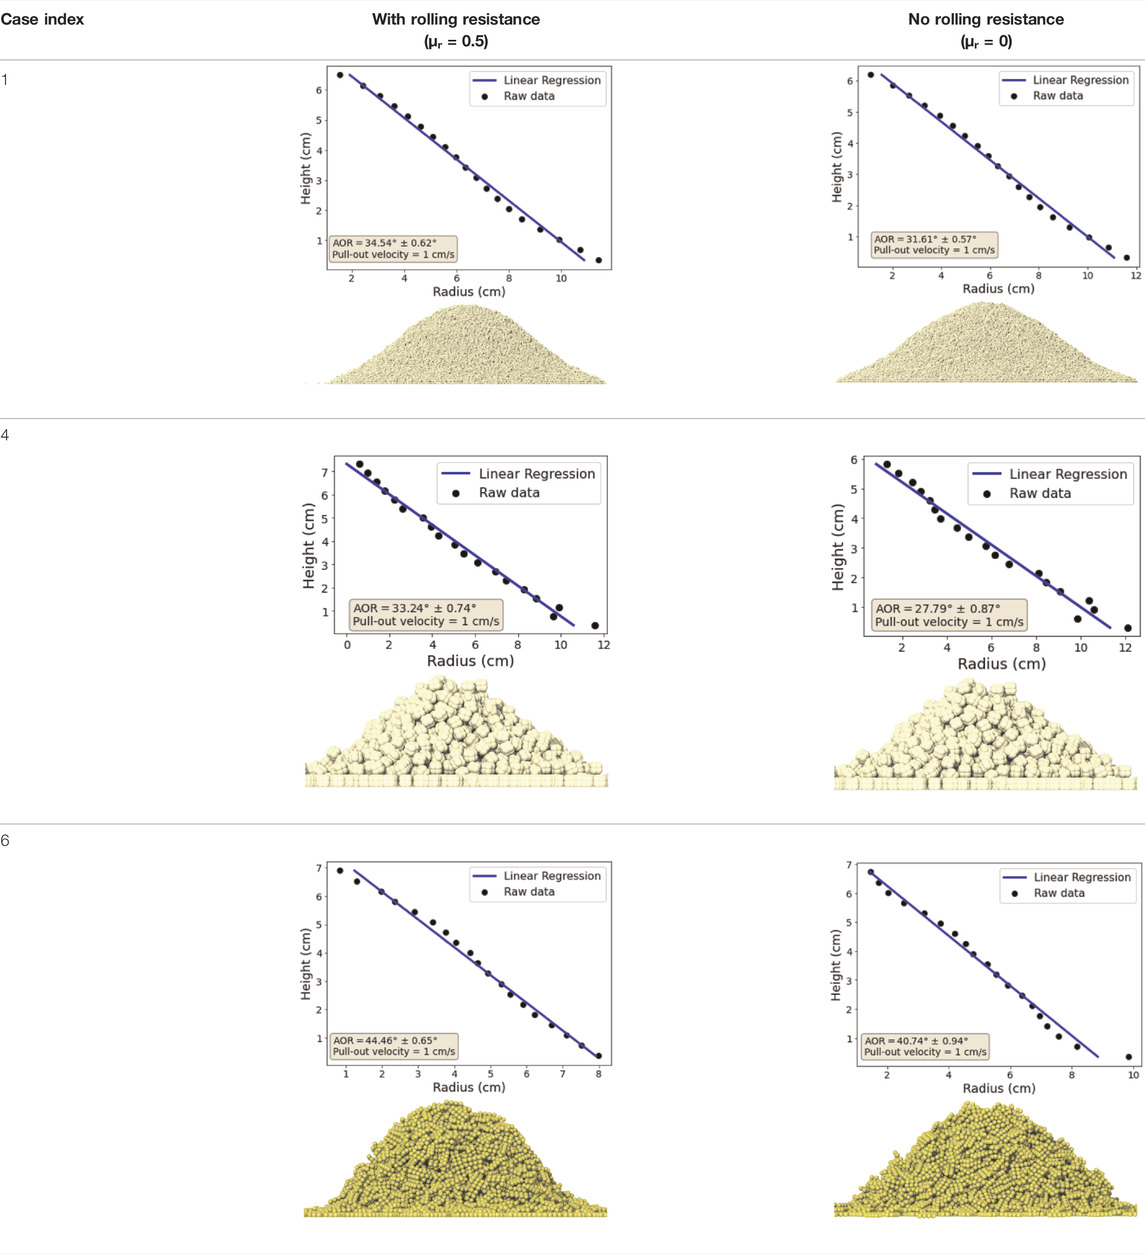
TABLE 5. Comparison of the rolling resistance effect on the simulated AOR for different Clumped-spheres particle shape models.
To confirm the role played by the mechanical interlocking mechanism, Table 6 shows the effect of the rolling resistance model on the bottomless cylinder test results for the case of single elementary particle shape models. By looking at the AOR values for the same particle shape with and without rolling resistance, it can be discerned that rolling resistance plays the key role in determining the slope in the case of these shapes. For example, by activating the rolling resistance mechanism, the AOR elevates from values below 15° to above 30°. The absence of any contribution from the mechanical interlocking mechanism in these cases is ascribed to the smoothness of the surface of their particles, which asserts the importance of accounting for the surface roughness of the real granular materials for a reliable prediction of the repose angle. In addition, this behavior emphasizes the importance of adopting rolling resistance model in conjunction with the simple particle shape models, in agreement with the common practice in DEM simulations. Accordingly, in the rest of this study, the comparison between the prediction of the different shape models will focus on the results obtained from the simulations with the rolling resistance activated.
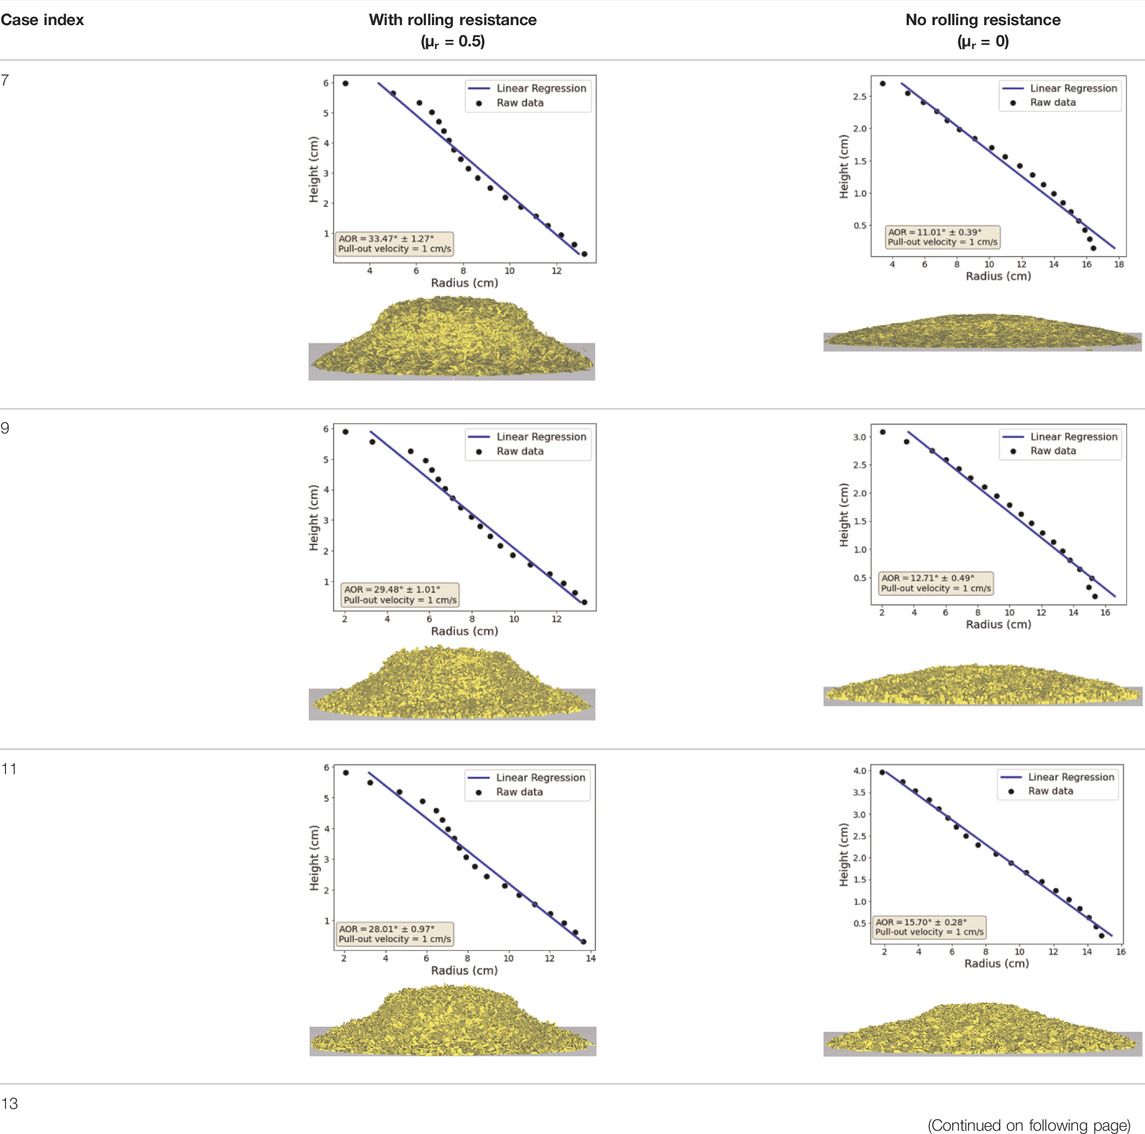
TABLE 6. Effect of rolling resistance on the AOR for different single particle shape models.
By closely examining the impact of the aspect ratio of the particle dimensions on AOR, we realize that needle-like particle shapes have the highest AOR among all the considered particle shape models. For instance, both the non-overlapping clumped-sphere cube and clumped-sphere chip models consist of eight base spheres of the same size with the only difference being about their layout. However, we see clearly that the chip shape results in a larger angle of repose. The angle of repose for the briquette particle shape asserts the same remark. This is consistent with our experimental measurements showing Crumbles from chips exhibiting slopes larger than the Crumbles from veneer (for which the particles resemble a cubic shape). On the other hand, the smallest AOR obtained in the DEM simulations coincides with the single sphere adopted as the DEM particle shape model. This is related to the features of the spherical shape with its highest symmetry and smoothest surface containing no edges. In agreement with our observation, Zhou et al. (Zhou et al., 2014) analyzed the stress distribution for different particle shapes. They found a significant influence of the particle shape on the magnitude of the pairwise normal contact force. The spherical shapes exhibited the smallest magnitude with normal pressure distribution, showing a relatively constant value in the central region. Unlike spherical particles, a more pronounced stress dip was observed in the case of the non-spherical particles.
3.3 Particle Size Effect on AOR.
Another factor that influences AOR is the particle size. In the present study, we investigated the size effect using both numerical and physical experiments. Figure 7 combines all AORs obtained from the simulation of different particle shape models along with the experimental data for veneer and chips particles. In this regard, for the sake of comparison with the simulated AOR, experimental results obtained from the direct measurement method was used, see Section 2.3. The reason behind the choice of this method is its compatibility with the developed algorithm used in the slope analysis of the simulation results. For each DEM particle shape model, two different particle sizes were simulated. The results are plotted versus the effective particle radius. For the clumped-sphere models and particle shapes with aspect ratio different from one, the effective size was taken to be the radius of the sphere with equivalent volume. The effective particle radius lies in the range between 1 and 5 mm, with the overlapping clumped-sphere shape model having the largest effective size. For all the modeled shapes, the static AOR increases with increasing the particle size.
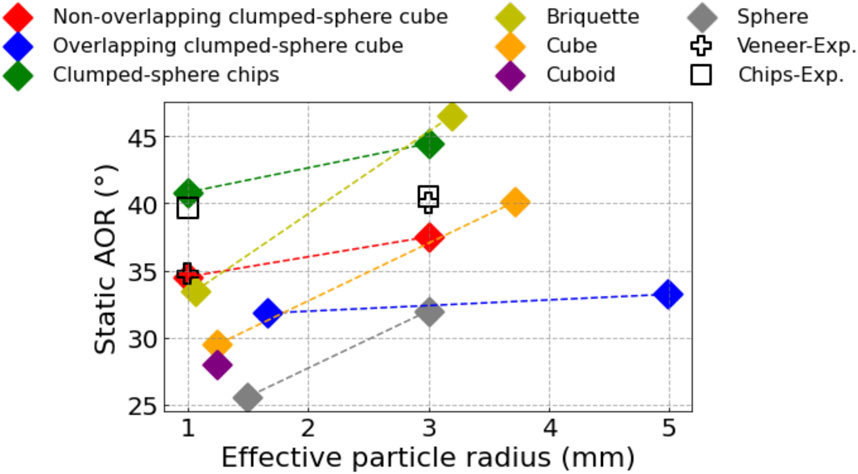
FIGURE 7. Particle size effect on AOR: the static angle of repose for the different particle shapes considered in the present study versus the effective particle radius using rolling friction coefficients of 0.5 along with the experimentally measured values for Veneer and Chips.
It is apparent that the values of simulated AOR obtained using the non-overlapping clumped-sphere cube shape model is in a good agreement with the experimentally measured values for Crumbles from veneer, while the clumped-sphere chip model achieves the best agreement with the Crumbles from chips. However, we would like to emphasize that the assessment of which particle shape models agrees better with experiment based solely on the value of AOR can be sometimes misleading. For example, recalibrating the rolling friction coefficient can render other shape models (i.e., the briquette, cube, and cuboid shapes) good candidates to reproduce the experimental data for a given particle size. Nevertheless, the significant difference between these different shape models belongs to the variation in the sensitivity of the AOR to the change in the particle size. This serves as strong evidence that particle size should not be regarded as a completely independent parameter in the description of AOR. It is correlated with other factors such as particle shape and surface roughness. So, the dependence of AOR on the particle size is implicit but not explicit. Thus, using simpler shape models along with the right particle size and calibrated rolling resistance coefficient does not guaranty reliable prediction of the flow behavior of the granular materials when the particle size is changed. In this regard, our experimental results indicate that Crumbles from chips have minimal sensitivity to the size effects, which is unlike the case of Crumbles from veneer. This suggests that as far as the mechanical characteristic are concerned, accurate estimation of the particle size is more important in the case of Crumbles from veneer. In addition, Crumbles from chips can tolerate a wider range of particle size distribution without affecting its flow properties.
In agreement with our findings, anecdotal results from various labs and researchers suggest a preference for using feedstocks from veneer over feedstocks from chips. The most-stated benefit is that veneer-derived feedstocks flow very easily through hoppers and screw feeders. The uniform particle length of veneer-based particles and high surface checking are believed to enable more precise tuning of reactors, resulting in higher yields and higher quality products. However, the cost of producing veneer-derived feedstocks is perceived to be higher than for particles from chips. Also, chips are widely available and can be made from branches, small diameter stems, and short rotation trees; however, veneer can only be made from bole wood of sufficient diameter to be economical (typically 125 mm or greater for centerless lathes and 250 mm or greater for spindle-type lathes).
Before we conclude this discussion, it should be noted that our DEM contact model assumes cohesionless particles, which should be deemed appropriate given the fact that the Crumbles used in the experiment were dried to small values of moisture content. Nevertheless, in other scenarios where cohesion is not negligible, additional attractive forces should be added to the DEM contact model. For those scenarios, the relation between the angle of repose and the particle size could show the opposite trend using the same simulation setup. For example, Elekes and Parteli (Elekes and Parteli, 2021) constructed a semi-empirical formula for such scenarios, which predicts the static AOR as a function of the particle size over a large span of length scale. They used experimental data as well as DEM simulations for this purpose. Given the varieties of particle shape models considered in the present study and the persistent trend exhibiting larger AOR for bigger particle size, capturing the opposite behavior should be mainly attributed to the incorporation of attractive forces in the contact model itself. This type of force can arise due to particle cohesion induced by moisture content, for example, or because of the Van der Waals forces originating from intermolecular interactions. The contribution of the Van der Waals forces to the particle-particle interactions is mainly important at a much lower length scale with particle sizes less than a few microns (Elekes and Parteli, 2021). This reported opposite trend serves as additional evidence that the dependence of AOR on the particle size is implicit. Furthermore, the relation between the particle size and AOR can alternate trend by changing the values of other influential parameters.
3.4 Analysis of the DEM Simulations Computational Cost on HPC.
As noted earlier in Section 3.1, HPCs were used to perform the clumped-sphere shape models simulations via LIGGGHTS-INL. In this regard, Sawtooth, the latest INL supercomputer, was utilized for these sets of simulations. Sawtooth uses CentOS platform and consists of 2079 compute nodes with each compute node having two Intel Xeon 8268 CPUs (each CPU comprises 24 HPE SGI 8600 cores) and 192 GB of RAM. In this part, HPC computational resources for the different simulated cases is furnished. For the sake of comparison, mono-sphere shape model simulations were also performed on HPC to establish a reference case. Table 7 provides a detailed information about the computational resources used for each simulation, which includes the number of compute nodes, the CPU cores count per node, and the CPU time. In addition, the computational system size in terms of the total number of base spheres is also reported in the same table. Moreover, the computational cost, taken as the total computational time in the unit of Processors-hours, is listed. Total computational time was evaluated by calculating the multiplication product of the total number of CPU cores used and the CPU time.

TABLE 7. Computational cost of DEM simulations for different particle shape models.
Figure 8A depicts the relation between the computational cost and the system size for the different particle shape models, with and without the rolling resistance model invoked. As would be expected, higher computational cost is needed to simulate larger systems. However, invoking the rolling resistance model does not introduce any remarkable computational cost except for the case of the mono-sphere shape model. This indicates the additional cost needed to calculate the extra term in the contact model accounting for the rolling resistance is minimal. Moreover, it suggests the relatively higher cost in the case of mono-sphere model is attributed to the communication time overhead and the populous neighbor lists associated with activating the rolling resistance model. This overhead originates from the denser material heap formed in that case, remember that the AOR for a mono-sphere model with a rolling resistance is higher than the case without a rolling resistance by a factor of two. It is worth noting that the absence of the rolling resistance in the case of mono-base DEM particles with smooth surface causes some of these particles to roll away from the main material pile and form isolated small clusters, which introduces computing load imbalance among the CPU cores. Nevertheless, the load balance feature available in LIGGGHTS-INL adjusts the size of the processor subdomain to balance the number of particles and thus the computational loads continue to be evenly distributed across the computational resources. Apparently, the dynamic load balance successfully minimized the impact of the scattered particles on the computational cost.
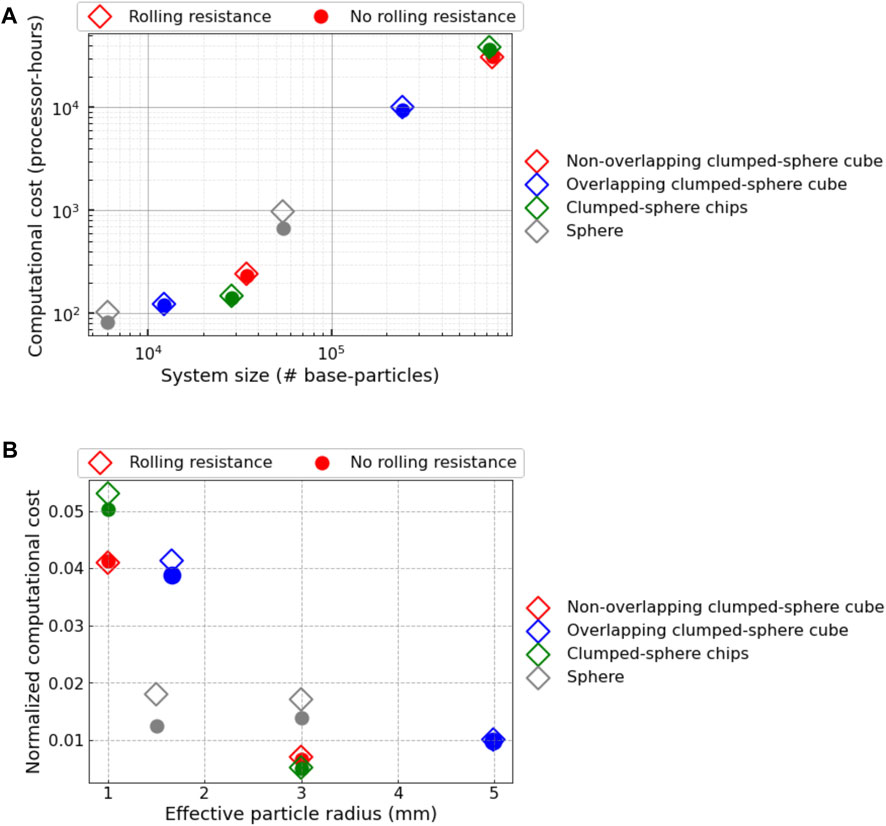
FIGURE 8. Computational cost of the DEM simulations for different particle shape models (A) the total computational cost versus the total number of base-particles (i.e., the total number of particles multiplied by the number of base-sphere for the clumped-sphere shapes), and (B) the computational cost normalized by the system size versus the effective particle radius.
To facilitate the comparison between the computational cost of different particle shape models, a normalized metric was utilized. The normalized computational cost was plotted versus the effective particle radius, as shown in Figure 8B. For the vertical axis, the computational cost was normalized by the system size and has the unit of processor-hours per base-sphere A careful examination reveals all clumped-sphere models exhibit an increase in the normalized computational cost regardless of the state of the rolling resistance model. However, the rate of increase of this computational cost is different. Moreover, the clumped-sphere models outperform the mono-sphere model for the larger effective DEM particle size (smaller system size). Nevertheless, this behavior changes for the smaller particle size with the mono-sphere model having a cost lower by a factor in the range of 2–3. This suggests the major component contributing to the overall computational cost differs for the larger particle sizes from the smaller ones. For the larger particle size, particle shape models that produced higher repose angle incurred lower normalized computational cost. To the contrary, the situation is quite the opposite for the smaller particle size, with the clumped-sphere chip model possessing the highest normalized computational cost. This could be attributed to the nonlinear increase in the coordination number by increasing the system size and the associated increase in the computing time spent in calculating the pairwise interactions between particles in direct contact. This is augmented by the increase in the communication time across compute nodes, since a higher number of compute nodes is needed to simulate a larger system size. This effect is expected to be more prominent in the case of heaps with higher density, i.e., larger AOR. On the other hand, for a smaller system size, the temporal evolution of system dynamics with particles exploring larger region in the spatial domain makes neighbor list updates more frequent, and it turns out this contribution to the overall computational workload becomes more significant. This is accompanied by the decrease in the workload required to compute particle-particle interaction forces. Hence, the computational cost under such circumstances will be higher for systems with smaller AOR.
The analysis of the used computational resources presented herein demonstrates the computational efficiency of clumped-sphere models for force calculations and contact detection. Even for simulation cases of the clumped-sphere models that are more expensive than the corresponding mono-sphere case, the increase in the computational cost is moderate. Furthermore, this comparison does not account for one more aspect that pertains to the minimum feature size resolved by each model. Although different shape models used similar effective particle sizes, clumped-sphere particle shape models possess higher resolution, as the base-sphere size is much smaller. Accordingly, the moderate increase in the computational cost associated with the use of some of these shape models is still affordable for the length scale under consideration and is completely justified by the more accurate physical behaviors captured through these particle shape models.
4 Summary and Future Outlook
Angle of repose (AOR) is an important macroscopic parameter that can be used to characterize the free-flow behavior of granular materials. The AOR is not an intrinsic material property, as it depends on several extrinsic factors including particle characteristics, which can be engineered to control the flowability of these particulate materials. In the case of lignocellulosic biomass, identifying the underlying mechanisms controlling its mechanical behavior and determining influential parameters is crucial for the optimization of preprocessing and handling unit operations without compromising feedstocks performance or conversion efficiency. Promoting fundamental understandings of the impact of the critical material attributes on the biomass feedstocks response can guide the selection of the critical processing parameters. This progress will render bioenergy technologies economically competitive and enable their deployment at the commercial scale. Thus, advances in bioenergy research will allow this energy source to play a vital role in shaping the clean energy portfolio to meet increasing global energy demands while satisfying the proposed measures to mitigate climate changes. Comminution is one of the costliest and energy-intensive operations in the preprocessing of biomass feedstocks. So, the present study employed an integrated experimental and computational approach to investigate the effects of particle shape and size on the AOR using Forest Concepts Crumbler® rotary shear system to produce two reduced particle sizes of conifer veneer and Douglas fir, i.e., 2 and 6 mm. The bottomless cylinder test was conducted in the laboratory and simulated using discrete element method (DEM) to evaluate AOR. Simulated AOR for different particles shapes and sizes were compared and benchmarked against experiment. In addition, the specific energy consumption for the comminution of produced Crumbles and moisture content for different particle sizes were also measured and reported. Moreover, the impact of additional factors on AOR, e.g., surface roughness and rolling resistance were investigated.
Our experimental results showed that while the smaller size (2 mm) of pine particles achieves better followability (i.e., smaller AOR), the energy cost of comminution is significantly higher, and the bulk density is almost the same as the 6-mm pine particles. In addition, 2-mm Crumbles from veneer have better flow properties than 2-mm Crumbles from chips, which was ascribed to the difference in particle shape. To the contrary, no significant difference was observed between the AOR of the two geometries when the 6-mm particle size was utilized. In addition, Crumbles from chips exhibited minimal sensitivity to variation in particles size. Furthermore, the DEM results identified the mechanical interlocking between contacting particles as the dominant factor in determining the AOR in the case of complex-shaped particles such as milled pine, which cannot be accurately captured by using simple particle shapes (e.g., mono-sphere) in conjunction with a rolling resistance model. This is attributed to the correlation between the sensitivity of AOR to the variation in particle size and particle shape. Hence, the use of simple particle shapes along with a rolling friction coefficient calibrated with experimental data for a given particle size will not be adequate to predict the AOR for a different particle size. To the contrary, the clumped-sphere model alleviates this limitation without significant increase in the computational cost and can be used for accurate simulations of biomass granular flow. This was evidenced by the better agreement achieved with the experiment by using clumped-sphere particle model with a layout mimicking the shape of the corresponding Crumble. In addition, the minimal dependency of clumped-sphere models prediction on the contribution of rolling resistance mechanism to the particle-particle interaction asserts the adequacy of these models to predict AOR. This observation indicated the role played by other underlying mechanisms arising from particle morphology and motivated the investigation of surface roughness and aspect ratio effects on AOR. The DEM results confirmed that for the same particle shape, higher surface roughness leads to larger AOR. Similarly, using different configurations having the same composition of base spheres within clumped-sphere shape models indicated that the deviation of the aspect ratio from one gives rise to a larger repose angle. This is found consistent with the observed trend highlighting the increase of repose angle with the particle size. All remarks concluded from the DEM simulation results were found in good agreement with our experimental findings.
In conclusion, the present study investigated quantitatively the impact of particle characteristics of dry milled pine on its flow behavior and illustrated the importance of adopting experimentally validated computational models to explore regions in topological space that could be inaccessible to experimentation. In addition, the coupling of the computational approach to the experimental work elucidated the underlying mechanisms and their individual contributions to the mechanical behavior of this granular material. However, developing reliable predictive models to this multivariate problem dictates accounting for many factors. Several future directions can be considered to achieve this goal, which can be summarized as follows.
• As noted, AOR is not an intrinsic material property, so the influence of other factors such as moisture content, porosity, and temperature need to be examined.
• Regardless of the shape model used in the present study, a persistent trend was observed regarding the relation between particle size and predicted AOR for the same amount of material: the larger the particle size the larger AOR. Capturing scenarios under which this trend is reversed requires incorporation of the attractive forces (for example Van der Waals force) in the description of the contact model in DEM simulations. This is expected to be more important for small particle sizes at or below the microscale and/or for wet particles.
• AOR could be an effective indicator of the flow behavior of granular particles. However, the prediction from this indicator should be limited to stress-free circumstances. For applications where external stresses are expected to be affecting the behavior of the material, a more reliable indicator is needed. This requires extending the scope of the study to probe the viscoplastic response of the materials under consideration to account for inelastic deformation processes. DEM models that account for these effects are available, e.g., (Chen et al., 2022), and will be considered in future studies.
• The selection of the set of optimal process parameters can be performed through a comprehensive technoeconomic analysis. This, in turn, requires a thorough quantification of the impact of critical material properties on different aspects of the feedstock, from the time of harvesting the raw biomass all the way up to its service-time in the conversion reactor. This includes optimizing for material handling, transportation, and preprocessing operations in conjunction with the feedstock performance and thermochemical conversion efficiency in the biorefinery. Accordingly, engineering particle characteristics for favorable flowability is only one criterion in a multi-objective optimization problem that should include other characteristics such as the chemical and thermal behavior.
Data Availability Statement
The original contributions presented in the study are included in the article, further inquiries can be directed to the corresponding author.
Author Contributions
AH conceptualized the article, performed the part of DEM simulations on HPC via LIGGGHTS-INL, and drafted/edited the full manuscript. YX conceptualized the article, supervised the work, performed the part of DEM simulations using Rocky DEM, and edited the full manuscript. NS and JK performed the bottomless cylinder test experiment and measured the AOR, contributed to the drafting of the relevant section (Section 2.3), and edited the manuscript. DL and JD supplied the comminuted wood veneer and chips feedstock, performed the characterization of the supplied particles physical properties and the evaluation of comminution energy, contributed to the drafting of the relevant sections (Sections 2.1, 2.2), and edited the manuscript.
Funding
This research is supported by the United States Department of Energy (DOE), Office of Energy Efficiency and Renewable Energy (EERE), Bioenergy Technologies Office (BETO), the Consortium for Computational Physics and Chemistry (CCPC) and the Feedstock Conversion and Interface Consortium (FCIC), under DOE Idaho Operations Office with Contract No. DE-AC07-05ID14517.
Conflict of Interest
Authors DL and JD were employed by the company Forest Concepts LLC.
The remaining authors declare that the research was conducted in the absence of any commercial or financial relationships that could be construed as a potential conflict of interest.
The handling editor AR declared a shared affiliation with the author(s) AH, YX, NS, JK at the time of review.
Publisher’s Note
All claims expressed in this article are solely those of the authors and do not necessarily represent those of their affiliated organizations, or those of the publisher, the editors and the reviewers. Any product that may be evaluated in this article, or claim that may be made by its manufacturer, is not guaranteed or endorsed by the publisher.
Acknowledgments
Forest Concepts LLC provided in-kind contribution of work described in Sections 2.1 and 2.2 under a short-term Cooperative Research and Development Agreement (CRADA) No. CRD-18-00782 with Idaho National Laboratory and National Renewable Energy Laboratory.
References
Abbaspour-Fard, M. H. (2004). Theoretical Validation of a Multi-Sphere, Discrete Element Model Suitable for Biomaterials Handling Simulation. Biosyst. Eng. 88, 153–161. doi:10.1016/j.biosystemseng.2004.03.010
Adam, S., Suzzi, D., Radeke, C., and Khinast, J. G. (2011). An Integrated Quality by Design (QbD) Approach towards Design Space Definition of a Blending Unit Operation by Discrete Element Method (DEM) Simulation. Eur. J. Pharm. Sci. 42, 106–115. doi:10.1016/j.ejps.2010.10.013
Ai, J., Chen, J.-F., Rotter, J. M., and Ooi, J. Y. (2011). Assessment of Rolling Resistance Models in Discrete Element Simulations. Powder Techn. 206, 269–282. doi:10.1016/j.powtec.2010.09.030
Beakawi Al-Hashemi, H. M., and Baghabra Al-Amoudi, O. S. (2018). A Review on the Angle of Repose of Granular Materials. Powder Techn. 330, 397–417. doi:10.1016/j.powtec.2018.02.003
Chen, F., Xia, Y., Klinger, J. L., and Chen, Q. (2022). A Set of Hysteretic Nonlinear Contact Models for DEM: Theory, Formulation, and Application for Lignocellulosic Biomass. Powder Techn. 399, 117100. doi:10.1016/j.powtec.2021.117100
Chen, H., Zhao, S., and Zhou, X. (2020). DEM Investigation of Angle of Repose for Super-ellipsoidal Particles. Particuology 50, 53–66. doi:10.1016/j.partic.2019.05.005
Chen, J., Gao, R., and Liu, Y. (20192019). Numerical Study of Particle Morphology Effect on the Angle of Repose for Coarse Assemblies Using DEM. Adv. Mater. Sci. Eng. 2019, 1–15. doi:10.1155/2019/8095267
Cheng, N.-S., and Zhao, K. (2017). Difference between Static and Dynamic Angle of Repose of Uniform Sediment Grains. Int. J. Sediment Res. 32, 149–154. doi:10.1016/j.ijsrc.2016.09.001
Ciesielski, P. N., Pecha, M. B., Lattanzi, A. M., Bharadwaj, V. S., Crowley, M. F., Bu, L., et al. (2020). Advances in Multiscale Modeling of Lignocellulosic Biomass. ACS Sust. Chem. Eng. 8, 3512–3531. doi:10.1021/acssuschemeng.9b07415
Cleary, P. W., and Sawley, M. L. (2002). DEM Modelling of Industrial Granular Flows: 3D Case Studies and the Effect of Particle Shape on Hopper Discharge. Appl. Math. Model. 26, 89–111. doi:10.1016/S0307-904X(01)00050-6
Coetzee, C. J. (2017). Review: Calibration of the Discrete Element Method. Powder Techn. 310, 104–142. doi:10.1016/j.powtec.2017.01.015
Cundall, P. A., and Strack, O. D. L. (1979). A Discrete Numerical Model for Granular Assemblies. Géotechnique 29, 47–65. doi:10.1680/geot.1979.29.1.47
Elekes, F., and Parteli, E. J. R. (2021). An Expression for the Angle of Repose of Dry Cohesive Granular Materials on Earth and in Planetary Environments. Proc. Natl. Acad. Sci. USA 118, e2107965118. doi:10.1073/pnas.2107965118
Fonte, C. B., Oliveira, J. A. A., and Almeida, L. C. de. (2015). DEM-CFD COUPLING: MATHEMATICAL MODELLING AND CASE STUDIES USING ROCKY-DEM® AND ANSYS FLUENT®. in Elev. Int. Conf. CFD Miner. Process Ind, CSIRO Organization, Melbourne, Australia, 1–7.
Frączek, J., Złobecki, A., and Zemanek, J. (2007). Assessment of Angle of Repose of Granular Plant Material Using Computer Image Analysis. J. Food Eng. 83, 17–22. doi:10.1016/j.jfoodeng.2006.11.028
Gao, X., Lu, L., Shahnam, M., Rogers, W. A., Smith, K., Gaston, K., et al. (2021). Assessment of a Detailed Biomass Pyrolysis Kinetic Scheme in Multiscale Simulations of a Single-Particle Pyrolyzer and a Pilot-Scale Entrained Flow Pyrolyzer. Chem. Eng. J. 418, 129347. doi:10.1016/j.cej.2021.129347
Guo, Y., Chen, Q., Xia, Y., Klinger, J., and Thompson, V. (2021). A Nonlinear Elasto-Plastic Bond Model for the Discrete Element Modeling of Woody Biomass Particles. Powder Techn. 385, 557–571. doi:10.1016/j.powtec.2021.03.008
Guo, Y., Chen, Q., Xia, Y., Westover, T., Eksioglu, S., and Roni, M. (2020). Discrete Element Modeling of Switchgrass Particles under Compression and Rotational Shear. Biomass and Bioenergy 141, 105649. doi:10.1016/j.biombioe.2020.105649
Hertz, H. (1882). Ueber die Berührung fester elastischer Körper. J. für die reine Angew. Mathematik (Crelles Journal) 1882, 156–171. doi:10.1515/crll.1882.92.15610.1515/9783112342404-004
Idaho National Laboratory. (2021). LIGGGHTS-INL: A Capability-Extended Adaptation of the LIGGGHTS Open Source Discrete Element Method (DEM) Particle Simulation Software based on LIGGGHTS release version 4.0.0. Available at: https://github.com/idaholab/LIGGGHTS-INL.
Jin, W., Stickel, J. J., Xia, Y., and Klinger, J. (2020). A Review of Computational Models for the Flow of Milled Biomass Part II: Continuum-Mechanics Models. ACS Sust. Chem. Eng. 8, 6157–6172. doi:10.1021/acssuschemeng.0c00412
Kloss, C., Goniva, C., Hager, A., Amberger, S., and Pirker, S. (2012). Models, Algorithms and Validation for Opensource DEM and CFD-DEM. Pcfd 12, 140–152. doi:10.1504/PCFD.2012.047457
Kruggel-Emden, H., Rickelt, S., Wirtz, S., and Scherer, V. (2008). A Study on the Validity of the Multi-Sphere Discrete Element Method. Powder Techn. 188, 153–165. doi:10.1016/j.powtec.2008.04.037
Lanning, David. N., DooleyDooley, H., and Lanning, Christopher. J. (2011). Torque-arm Method to Measure Specific Energy in Laboratory Scale Biomass Preprocessing Equipment. St. Joseph, MI: American Society of Agricultural and Biological Engineers. doi:10.13031/2013.38988
Liao, Z., Yang, Y., Sun, C., Wu, R., Duan, Z., Wang, Y., et al. (2021). Image-based Prediction of Granular Flow Behaviors in a Wedge-Shaped Hopper by Combing DEM and Deep Learning Methods. Powder Techn. 383, 159–166. doi:10.1016/j.powtec.2021.01.041
Liu, S. D., Gan, J. Q., Zou, R. P., Yu, A. B., and Zhou, Z. Y. (2020). Wall Stress Analysis in an Unsteady Hopper Flow with Ellipsoidal Particles. Powder Techn. 361, 1–9. doi:10.1016/j.powtec.2019.11.053
Liu, S. D., Zhou, Z. Y., Zou, R. P., Pinson, D., and Yu, A. B. (2014). Flow Characteristics and Discharge Rate of Ellipsoidal Particles in a Flat Bottom Hopper. Powder Techn. 253, 70–79. doi:10.1016/j.powtec.2013.11.001
Lu, Y., Jin, W., Klinger, J., and Dai, S. (2021). Flow and Arching of Biomass Particles in Wedge-Shaped Hoppers. ACS Sust. Chem. Eng. 9, 15303–15314. doi:10.1021/acssuschemeng.1c05628
Mindlin, R. D., and Deresiewicz, H. (1953). Elastic Spheres in Contact under Varying Oblique Forces. J. Appl. Mech. 20, 327–344. doi:10.1115/1.4010702
Müller, D., Fimbinger, E., and Brand, C. (2021). Algorithm for the Determination of the Angle of Repose in Bulk Material Analysis. Powder Techn. 383, 598–605. doi:10.1016/j.powtec.2021.01.010
Nakashima, H., Shioji, Y., Kobayashi, T., Aoki, S., Shimizu, H., Miyasaka, J., et al. (2011). Determining the Angle of Repose of Sand under Low-Gravity Conditions Using Discrete Element Method. J. Terramechanics 48, 17–26. doi:10.1016/j.jterra.2010.09.002
Oyedeji, O., Gitman, P., Qu, J., and Webb, E. (2020). Understanding the Impact of Lignocellulosic Biomass Variability on the Size Reduction Process: A Review. ACS Sust. Chem. Eng. 8, 2327–2343. doi:10.1021/acssuschemeng.9b06698
Papworth, R. L., and Erickson, J. R. (1966). Power Requirements for Producing Wood Chips. For. Prod. J. 16, 31–36.
Rackl, M., Top, F., Molhoek, C. P., and Schott, D. L. (2017). Feeding System for wood Chips: A DEM Study to Improve Equipment Performance. Biomass and Bioenergy 98, 43–52. doi:10.1016/j.biombioe.2017.01.003
Renewable Energy Agency (2018). Global Energy Transformation: A Roadmap to 2050. Available at: www.irena.org.
Scherer, V., Mönnigmann, M., Berner, M. O., and Sudbrock, F. (2016). Coupled DEM-CFD Simulation of Drying wood Chips in a Rotary Drum - Baffle Design and Model Reduction. Fuel 184, 896–904. doi:10.1016/j.fuel.2016.05.054
Stelte, W., Sanadi, A. R., Shang, L., Holm, J. K., Ahrenfeldt, J., and Henriksen, U. B. (2012). Recent Developments in Biomass Pelletization - A Review. BioRes 7, 4451–4490. doi:10.15376/biores.7.3.4451-4490
Stukowski, A. (2010). Visualization and Analysis of Atomistic Simulation Data with OVITO-The Open Visualization Tool. Model. Simul. Mater. Sci. Eng. 18, 015012. doi:10.1088/0965-0393/18/1/015012
U.S. Department of Energy Bioenergy Technologies Office (2016). Biorefinery Optimization Workshop Summary Report, (Chicago, IL: U.S. Department of Energy).
Wensrich, C. M., and Katterfeld, A. (2012). Rolling Friction as a Technique for Modelling Particle Shape in DEM. Powder Techn. 217, 409–417. doi:10.1016/j.powtec.2011.10.057
Xia, Y., Chen, F., Klinger, J. L., Kane, J. J., Bhattacharjee, T., Seifert, R., et al. (2021). Assessment of a Tomography-Informed Polyhedral Discrete Element Modelling Approach for Complex-Shaped Granular Woody Biomass in Stress Consolidation. Biosyst. Eng. 205, 187–211. doi:10.1016/j.biosystemseng.2021.03.007
Xia, Y., Lai, Z., Westover, T., Klinger, J., Huang, H., and Chen, Q. (2019). Discrete Element Modeling of Deformable Pinewood Chips in Cyclic Loading Test. Powder Techn. 345, 1–14. doi:10.1016/j.powtec.2018.12.072
Xia, Y., Stickel, J. J., Jin, W., and Klinger, J. (2020). A Review of Computational Models for the Flow of Milled Biomass Part I: Discrete-Particle Models. ACS Sust. Chem. Eng. 8, 6142–6156. doi:10.1021/acssuschemeng.0c00402
Zhong, W., Yu, A., Liu, X., Tong, Z., and Zhang, H. (2016). DEM/CFD-DEM Modelling of Non-spherical Particulate Systems: Theoretical Developments and Applications. Powder Techn. 302, 108–152. doi:10.1016/j.powtec.2016.07.010
Keywords: angle of repose, discrete element method, mechanical size reduction, biomass feedstocks, Douglas fir
Citation: Hamed A, Xia Y, Saha N, Klinger J, Lanning DN and Dooley J (2022) Flowability of Crumbler Rotary Shear Size-Reduced Granular Biomass: An Experiment-Informed Modeling Study on the Angle of Repose. Front. Energy Res. 10:859248. doi: 10.3389/fenrg.2022.859248
Received: 21 January 2022; Accepted: 04 March 2022;
Published: 05 May 2022.
Edited by:
Allison E. Ray, Idaho National Laboratory (DOE), United StatesReviewed by:
Zhengshou Lai, Sun Yat-sen University, ChinaOladiran Fasina, Auburn University, United States
Copyright © 2022 Hamed, Xia, Saha, Klinger, Lanning and Dooley. This is an open-access article distributed under the terms of the Creative Commons Attribution License (CC BY). The use, distribution or reproduction in other forums is permitted, provided the original author(s) and the copyright owner(s) are credited and that the original publication in this journal is cited, in accordance with accepted academic practice. No use, distribution or reproduction is permitted which does not comply with these terms.
*Correspondence: Yidong Xia, eWlkb25nLnhpYUBpbmwuZ292