 Kenneth E. Okedu
 Ahmed Sultan Salim Al Ghaithi
- 1Department of Electrical and Communication Engineering, National University of Science and Technology, Muscat, Oman
- 2Department of Electrical and Electronic Engineering Nisantasi University, Istanbul, Turkey
Solar Photovoltaic (PV) offers hope toward environmental sustainability in terms of carbon and global heat reduction. The harvested energy from solar PV depends on the solar radiation, temperature of the cells, and the voltage generated in the PV modules. With the recent proliferation of solar PV projects in Oman, it is imperative to carry out new studies on the causes and effects of failures of these grid connected PVs, for effective and reliable performance. This study serves as a prototype to evaluate the performance of solar PV installations in Oman, considering the possible failures that may occur. These failures could lead to poor performance of the solar PV systems during operation. The performance analysis of a 6.2 MW grid-connected solar photovoltaic system in Muscat car parking, Oman is presented in this paper. The electrical parameters, and data analysis of the PV system were evaluated by monitoring the voltage, frequency, power factor, and total output power variables. The analysis of the PV performance was based on three internal dynamic failures; dust accumulation, inverter malfunction, and faulty protection schemes. When the solar PV cells were exposed to high percentage of contamination and dust, the plant performance dropped sharply to lower power generation by 43.5%. Furthermore, Inverters failure data analysis show that the average power generation degraded by 34%, and the average power generation degradation of 1% in the same period due to protection schemes failure. The results demonstrated that dust accumulation and inverter malfunction are the two major shortcomings that could lead to low power efficiency of solar PVs during operation.
Introduction
Nowadays, the focus on renewable energy has increased due to the global reduction in the use of fossil fuel-based energy resources. Solar and wind energy are the most economical and widely employed renewable energy systems in the Gulf Cooperation Council (GCC) region. There are quite a good number of completed and ongoing solar and wind projects in the GCC countries. United Arab Emirates (UAE), Qatar, Kingdom of Saudi Arabia (KSA), and Bahrain took the initiative to launch several renewable energy projects in the GCC region. In 2018, Qatar launched a Photovoltaic (PV) 800 MW solar power project. Similarly, in the same year, the KSA launched large projects of wind and solar power projects with capacities of approximately 400 and 300 MW. On the other hand, UAE has installed renewable energy projects to produce around 100 MW in Abu Dhabi and another project in Dubai solar park which is expected to generate 5,000 MW. UAE has a strategy to produce half of its power requirements from renewables and nuclear energy by the end of 2050 (Salim and Alsyouf, 2020).
Internationally, power generation from solar energy using solar PV has increased sharply in the last decades as a result of many advantages like; clean energy, low maintenance costs and easy installation, among others. However, there exist some shortcomings in the effective operation of PV systems and its components considering the required standards (Kontges et al., 2017). In Reference (Das et al., 2021), the design and analysis of an AC coupled solar PV scheme was carried out for an off-grid remote community in Chittagong Hill Tracts of Bangladesh. The proposed AC-coupled stand-alone solar system was able to meet load demands during the day and at night. The Sultanate of Oman’s production of electricity increased by 7.9% by the end of September 2021 to reach 32,411.8 GWh, compared to the end of September 2020, when the total production was 31, 405.6 GWh (Oman News Agency, 2021). References (Munawwar and Ghedira, 2014; Ismail et al., 2015; International Renewable Energy Agency, 2016; Abdullahi, 2018) reported that the highest renewable energy penetration in Oman could be achieved with the help of solar energy. The structure of electricity demand in Oman is bound to change as the rate of growth in supply to industrial and commercial customers exceed those of other customers’ categories. Consequently, sustainable electricity supply is part of Oman’s vision 2040, as a way of improving electricity generation by using renewable sources like solar PV, wind, hydropower, and biomass to reach 15% of total power generation in Oman’s power grid (Jha, 2013). As Oman has good solar irradiation like other countries in the GCC, there are a lot of solar PV projects been launched to support the power grid demand. Recently, more than 2 GW of solar PVs were installed in different locations in Oman. With this recent proliferation of solar PV systems in the Omani power grid, it is imperative to carry out new studies on the causes and effects of the internal dynamic failures of these grid connected solar PVs.
The changes in the climate zones have influence on solar PV system performance, which usually cause degradation and reduction in performance. The climate zone in most GCC countries are similar. There are a number of publications in the literature on PV system performance due to climate zone and PV system failures regarding UAE, Qatar, Kuwait, and Saudi Arabia. Kuwait has installed several PV projects across Kuwait region like Shagaya photovoltaic Park, Al-Wafra, and Mutla PV. Shagaya Photovoltaic Park has been constructed as a trial system to evaluate the performance of PV modules connected to the grid under conditions of a hot desert environment. The study finalized that, the main challenges in Kuwait region is an unstable meteorological condition which drives energy resources performance like solar PV. Kuwait is a tropically desert area, which has a high percentage of dusty storms across the year especially in the peaks of solar irradiation. Therefore, the dust accumulation on top of solar PV array modules reduces the PV efficiency sharply, hence system stability will be low and can be conceded as PV failure. This PV shortcoming can create a malfunction to the other units of the PV system. In addition, high temperatures will reduce the operating age of solar PV modules (Alshawaf et al., 2020; Majed et al., 2020).
Qatar is focusing on renewable energy as a way of reducing the cost of generating electricity compared to the gas turbine system. Since Qatar is located in a high solar irradiation zone, there are solar system installations in the capital city of Doha and most parts of the country, especially with the oncoming FIFA world cup (International Renewable Energy Agency, 2019). In 2015, a study was published about the performance and failure of the PV system in Qatar. The study measured the ambient temperature, dust, and weather conditions in order to evaluate how these factors affect solar facilities in Doha, Qatar, from June to December in 2014. The outcomes of this study indicate that surface dust deposition causes significant losses in solar PV power output and solar PV system life degradation due to high ambient temperature. More so, the variation in the temperature of the solar PVs corresponds with its module performance ratio (Guo et al., 2015).
UAE has very hot weather conditions in the entire year, and there was a study that illustrated that dust accumulation on the surface of the cells of the solar PV, could cause a sharp reduction in their performance when installed outdoors. Therefore, it is paramount to consider this in the design and execution of solar PV systems, especially in the desert areas. Al-Sabounchi, et al., observed that the most horrible performance degradation in the solar PV system was in July due to the impact of dust which was deposited on the PV panels in combination with a high rise in ambient temperature and humidity (Al-Sabounchi et al., 2013). The authors of the paper found out that the rate of dust accumulation on the solar PV surface, reduced the system’s output power from 100 to 73%. So the accumulation of dust on the surface of the solar PV will have a high impact on electricity produced by the system.
In the present context, studies on PV failures analysis are significant because they have a direct impact on solar PV efficiencies and lifetimes. For example, weather and materials used in PV will play a role in the peak output power. Reference (Sulaiman et al., 2012) established an approach to design new PV systems using different types of PV technologies. European standards and specifications were practiced in designing the new types of solar PV, and the proposal was to improve the solar PV output power efficiency. Beser, et al., did a single-phase multi-level reflector in the PV system in Reference (Beser et al., 2010). This research aim was to confirm experimentally how different types of PV modules will have different output voltage and current as well as verify the health of a new PV design. The results obtained by the authors show variations in the current and output voltage variables from one module to another. In another research, carried out in the literature by (Kim et al., 2009), the authors studied two PV systems installed in Daegu Metropolitan City, Korea, and both systems were connected to the grid. This research aimed to identify the economic and performance analysis of grid-connected solar PVs by taking into consideration their operational status and performance. The authors monitored and measured the ambient temperature, solar radiation strength, and PV tilt angle. These two PV systems were compared by measuring power efficiency and energy generated every month in that year. The average annual energy generated from the first system was 25,848 kWh, whereas that of the second system was 40,094 kWh. The average monthly energy generation of both systems were 2,154 and 3,341 kWh. The major finding of this study shows that the output power of the solar PV depends on the tilt irradiance, irradiance with the horizontal plane, ambient temperature, and PV module temperature. The outcome from this study reflected that the power generation efficiency of the first solar PV system was 10.8 and 13.8% for the second system for that year. Therefore, by comparing these solar PV systems based on the power generation and capital cost, the second system gives a better economy, with a cost of $0.531 per kW, while the first system cost around $0.824 per kW. The costs incurred in both systems are mainly from the solar battery modules and the inverters, which constituted around 80% of the materials purchased.
Sultanate of Oman has managed to maintain electricity demand growth by developing power infrastructures 50 years ago. Subsequently, it is imperative for the electricity sector to develop techniques to meet new technologies. This will depend on the size of the electricity network as well as the new technological challenges that are been introduced in the different levels of the power system. Renewable energy and smart metering are considered as salient benefits of the power generation and integration of smart grid technologies in the Oman power grid. In view of the above, this paper presents;
• The photovoltaic module system fault analysis in Oman national power grid, due to the increased demand for power resources using renewable energy, especially solar power to meet electricity demand at a lower cost with high reliability.
• In the course of operation of these grid-connected solar PVs, different failures are bound to occur, that would lead to reduction in the performance of the solar PVs, thus, affecting their reliability to sustain output power.
• Consequently, this paper carried out a comparative study of three major internal dynamic failures of grid-connected solar PVs; investigation of the effects of dust, inverters, and protection schemes, in order to address the key issues of solar PV modules and failures in Oman.
The Oman Power Grid
The Main Interconnected Power System (MIPS) in Oman covers the regions between the northern and southern power networks, except Dhofar governorate which has its power system. The MIPS feeds more than 1.5 million end-users who are divided into different groups such as residential, commercial, government, industrial, and other loads. The MIPS monitors and controls the power system that is divided into three main operating sections: generation, transmission, and distribution. However, each one of these sections is owned and monitored by a separate company. There are eleven generation companies responsible for the generation of power. The transmission line has different voltage levels (400/220/132 kV) that are owned and fully supervised by Oman Electricity and Transmission Company (OETC). Distribution companies are responsible to deliver electricity to the customers and ensure the availability and reliability of the distribution system. Oman governorates are divided into three groups, with each group having one distribution company. Muscat Electricity Distribution Company (MEDC) feeds Muscat governorate only. The second distribution company is Mazoon Electricity Company (MZEC) which is responsible to feed three governorates: Al Dakiliya, Al Sharqiya, and South AL Batinah. The third distribution company is Majan Electricity Company (MJEC) which undertakes power supply to North Batinah, Al Dhahirah, and Al Buraimi governorates. Dhofar governorate has four generation companies, 132 kV grid owned and operated by OETC and Dhofar Power Company (DPC). DPC and Rural Areas Electricity Power Company (RAEC) are undertaking supply for Dhofar governorate. Figure 1 shows the Oman’s power sector (Oman Eletcricity Transmission Company, 2020).
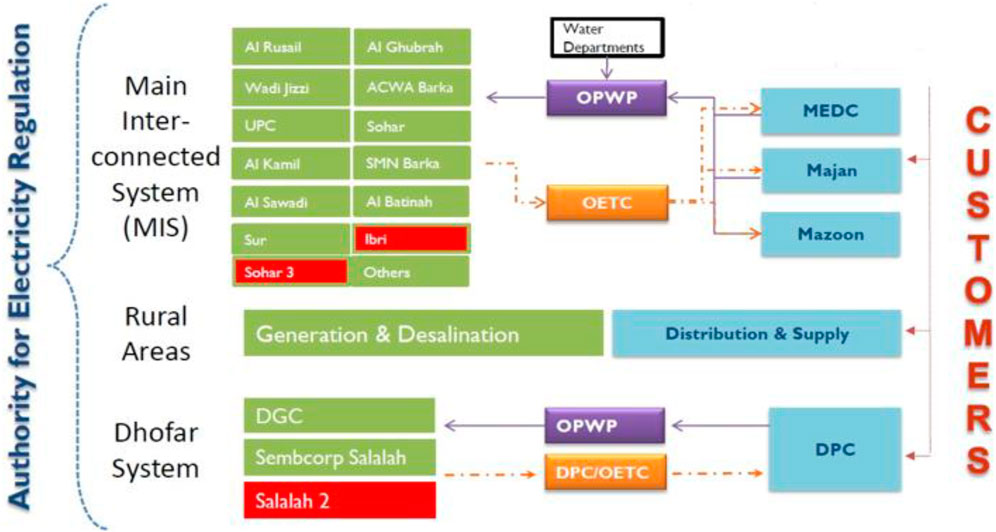
FIGURE 1. Power sector of Oman (Oman Eletcricity Transmission Company (OETC), 2020).
The Petroleum Development Company of Oman (PDO) power system network has interconnection with the government system in two locations. One connection is between Nizwa and Nahada and the second interconnection between Thumrait and Harweel. In addition to that, a critical interconnection was established in 2015 among GCC countries to support each other in case of any power outage or emergency that occurs in the region. Figure 2 shows the interconnection system of GCC countries, where a double circuit and a single circuit of 200 kV, 50 Hz line connect Al Ouhah (UAE) and Al Wasset (Oman) with a distance of 52 km (Authority for Electricity Regulation (AER) of Oman, 2020; Oman Eletcricity Transmission Company (OETC), 2020).
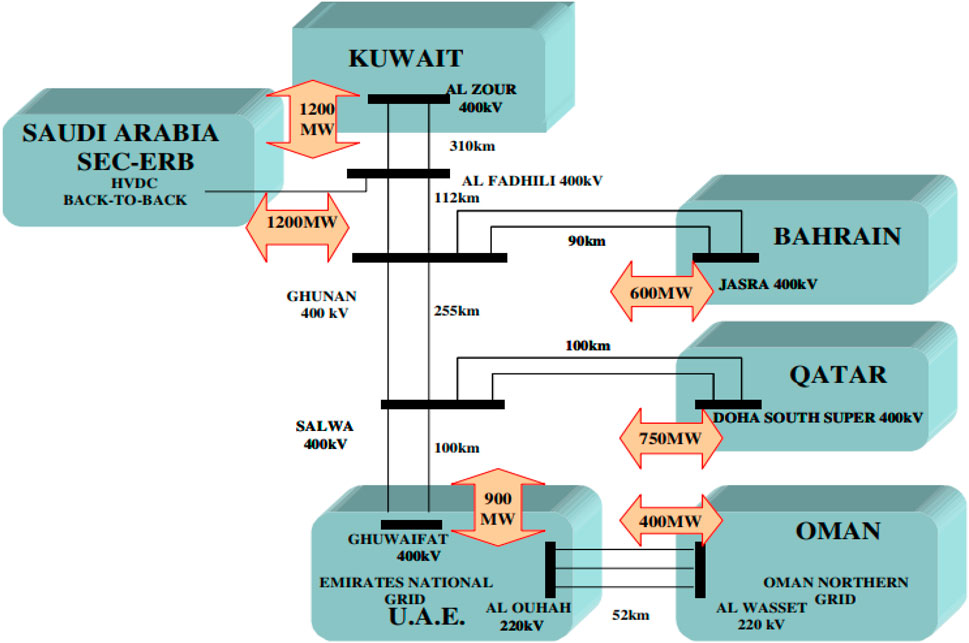
FIGURE 2. GCC interconnection power system (Authority for Electricity Regulation (AER) of Oman, 2020; Oman Eletcricity Transmission Company (OETC), 2020).
Dynamics of the Solar PV System
In general, the mathematical model of a solar PV array has been found utilizing only the datasheet specifications which are shared by the manufacturer. The projected modelling technique determines all the solar PV array parameters without performing any repetitive iteration. Dynamic and mathematical model formulation of solar PV modules are clarified based on the physical model of silicon solar cell for giving academic support to study PV systems stability (Qin et al., 2013). The steady-state and dynamic performance of the solar PV is necessary to understand the PV characteristics for the stability of the overall PV system. There are two main types of models in solar PV cells; the single-diode and double-diode models. These models take solar PV irradiance and temperature as input factors and create the I-V and P-V output characteristics (Dey et al., 2016).
Single and Double Diode PV Cell Model
The equivalent circuit in Figure 3 represents the single diode model for PV cells. The output current generator in the circuit is reliant on the characteristics of the semiconductor material used in the cell. Moreover, it is dependent on other factors such as cell area, solar irradiation, and temperature. The performance of the single diode model depends on diode reverse saturation current (Ir), photocurrent (Iph) which produced current due to sunlight, series resistance (Rs), and shunt resistance (Rp). Rs represents the internal loss due to current flow and gives correct shape between P-V open-circuit voltage and maximum power. The Rp is connected in parallel with the diode which shows leakage current to the ground. Normally Rs and Rp are assumed equal to zero. So the output current (I) can be found in the mathematical equation for characterizing the I-V performance of a single diode as (Shannan et al., 2013):
Where q is the electron charge constant value (1.6 × 10⁻¹⁹C) and k (1.38 × 10⁻²³J/K) is Boltzmann’s constant current, V and I are the cell terminal voltage and current. Tcell is the temperature of the cell in Kelvin. The current produced by the photo mainly depends on solar radiation and cell temperature, which is given by the equation:
Where Isc (Tref) is short circuit current at 25°C reference temperature and H is the solar insolation in kW/m2. Moreover, the reverse saturation current can be written as:
The output current equation for the single diode model could be expressed as (Shannan et al., 2013):
Where
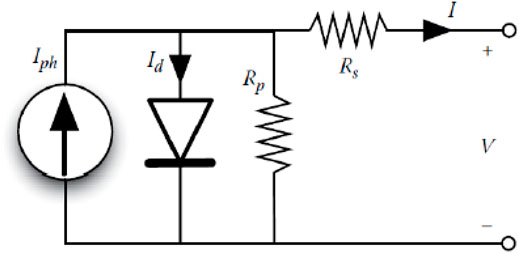
FIGURE 3. Single diode PV cell model.
The single diode model is considered to be a constant value and close to unity at higher voltage, while the recombination in the device is subject to the surfaces and the bulk areas. The connection recombination is modelled by adding the second diode in parallel with the first diode as shown in Figure 4 and setting the ideal factor characteristically to the value of two. The output current equation of the two diode model is given as (Shannan et al., 2013):
Where,
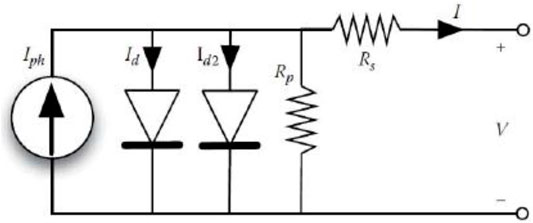
FIGURE 4. Double diode model PV cell.
Solar Photovoltaic System Fault Analysis
Unexpected failures can occur in the power generation units, or transmission and distribution lines. Fault analysis studies the transient process when fault occurs, and reduces the mean time between the failures in order to stabilize the power system very fast (Yuehai et al., 2004). Fault analysis is used to design power system equipment such as circuit breakers (CBs) in switchgears to ensure the CB is capable of effective operation in a short time, for any short circuit current fault. Moreover, substation infrastructures of other power system plants like transformers, cables, and outdoor busbar, use the short circuit current rating to design equipment to ensure they safely withstand the passage of this short current for a specified duration. Normally two types of failures can happen in a power system. The first is an insulation failure due to a short circuit and overstressing that lead to degradation of the insulation over time or unexpected overvoltage conditions in the system. The second is failure by interruption of current flow or open circuit fault (Tleis et al., 2011).
Solar PV module faults impacts the total output power performance which leads to critical hazardous situations. Most faults that can occur in a solar PV array is the current fault, therefore protection and detection of fault current in a PV array are conventional by adding fuses or circuit breakers in series with solar PV components. These types of protection devices are capable of isolating and tripping the faulty circuit when they sense any overcurrent e.g., line-line faults and earth-fault. According to the United States National Electrical Codes, the currents of serial fuses connected to solar PV modules are rated not less than 1.56 times of short circuit current. For example, a line to line fault under low irradiance conditions will create unbalanced power between faulted solar PV strings and healthy strings, which would lead to back-fed current into the most faulted solar PV string and fault current along the fault path, but the short current will be lower than 1.56, while the line to line fault under high irradiance can create 2.53. Therefore, if the fault lasts for a long time, it will melt the fuse (Csavina et al., 2014).
Reverse connection in the solar PV is considered as another unique fault that can occur in the solar PV arrays, when one of the PV strings is connected in reverse. This kind of fault usually happens if the PV module is in an open-circuit condition, as a result of installation being carried out. For example, if this kind of fault occurs, then the reverse connected string will be moved into the other healthy strings, as it shares the same voltage with the other strings. Therefore, the bypass diodes in the reverse connected arrays will become forward-biased, and the healthy string will be short-circuited by these diodes.
Present Solar PV Installation Capacity in Oman
The Sultanate of Oman is one of the Middle East countries located in southwest Asia and on the other hand in the south eastern quadrant of the Arabian Peninsula. It shares borders with three countries; the United Arab Emirates to the northwest, the Republic of Yemen to the southwest, and the Kingdom of Saudi Arabia to the northwest. The coastline of Oman is approximately 3,165 km from the channel of Hormuz in the north of Oman, to Ras Darbat Ali at the borders of the Republic of Yemen in the south (Al-Badi et al., 2011). Oman has a tropical desert climate with some summer rains in both the southern and northern mountainous areas, and this rains are brought by the summer rainy season along the eastern coast. The rainy season, from mid-June to mid-September, occur due to wet currents blowing towards the Asian continent, which has limited effects in terms of rain, but it is nonetheless able to influence the climate of the country (Overview Oman Climates, 2013). Each governorate in the Sultanate of Oman has different weather parameters like ambient temperature, wind speed, wind direction, and global solar irradiation. Hence, the different climates would result in various solar PV performance from one governorate to another mainly due to the solar irradiance pattern. In addition, solar PV modules are strongly impacted by environmental conditions such as temperature, wind, and the amount of dust accumulated in the air. Recent studies reflect higher degradation rates in hotter climates zone compared to mild weather. Though degradation rates of solar PV system are influenced by other factors like; age, product type, methodologies, technology, and mounting or tilt angle (Jordan et al., 2012).
Sultanate of Oman has an initial plan that by 2030 at least 15% of the total energy must be generated through renewable energy, mainly from solar PVs, and wind turbines. Oman looks at the PV module system as a good choice because of its performance and reliability under local climatic conditions with consideration of the investments made in the future. PDO took initiative and started the installation of solar PV modules in different locations after studying the climatic zones, types of solar PVs and failure rates. Figure 5 shows the present capacity and location of solar PVs installed in Oman. PDO has three big projects of solar PV systems (Amin, Mina Al Fahal (MAF) solar car parks, and Miraah) (Okedu and Al-Hashmi, 2018; The Petroleum Development Company of Oman, 2018; Okedu and WaleedAL Salmani, 2019; Okedu et al., 2020). Recently, Oman Power and Water Procurement Company (OPWP) and other local companies have started installing solar PV modules in different locations in Oman to meet their energy demands (Oman Power and Water Procurement, 2020; Abdallah et al., 2021).
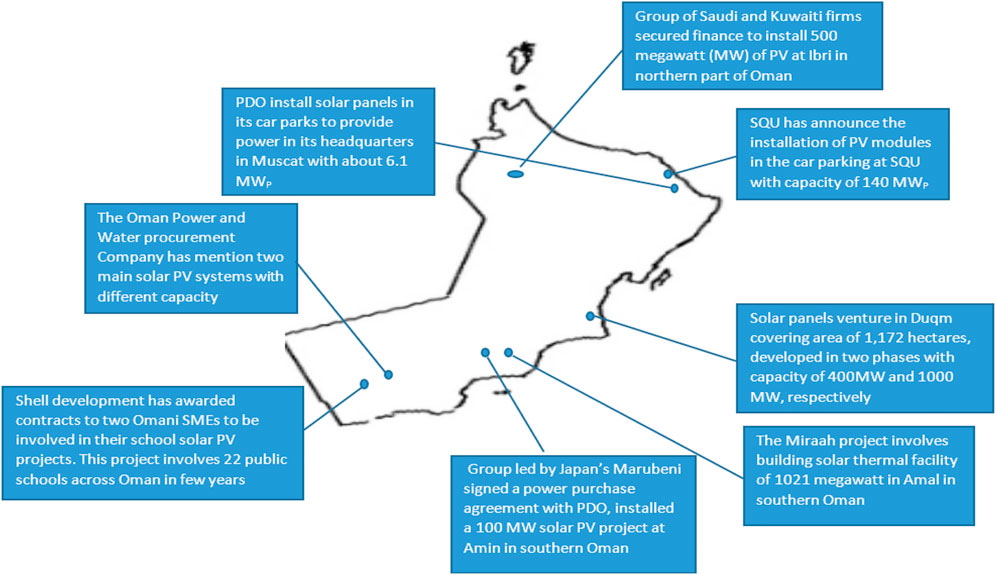
FIGURE 5. The current installed PV capacity and location in Oman.
The Case Study
The case study of this paper is based on solar PV modules installed in Muscat climatic zones, with the aim of inspecting and analysing the common types of failures in the solar PV system. This system is located in Muscat at PDO head office; it was installed on top of the car park shade and design to produce around 6.2 MW. The PV system plant was designed to deliver electricity to the grid in an operational environment. Although the PDO head office PV system size for the PV plant (6.2 MW) makes it similar to medium-sized plants that inject a reasonable amount of electricity to the 11 kV grid. The goal of the PV project was actually to reduce the bill cost, study, and understand the detailed performance of different types of PV modules.
Photovoltaic systems involve other components in addition to the PV modules. This unit generally contain system wiring, inverters, batteries, support structures, charge controller, disconnect switches, and overcurrent protection. To connect PV system in a grid, the protection devices and inverter are the main interfaces between the utility grid and the solar PV system. However, the inverter in the PV system is conceded as a critical component, which directly influences the system performance. Furthermore, the aim of the inverter is for direct current (DC) to alternative current (AC) conversion. To ensure the output power quality and quick disconnection of the PV system from the power grid in case of any emergency or failure event, the utility-interactive inverters incorporate circuit is designed to act accordingly. Disconnect switches are required for personnel safety and to isolate units during system servicing. The disconnect switch normally contains overcurrent protection that is either fuse or circuit breaker.
The solar PV model system used in this work does not have battery storage, so the power supply generated by the solar PV will be feeding to the grid during sunrise times only, and during no sunrise times, the solar PV system will be off. Hence the system is not required to have battery storage because the grid power can be utilized to supply electrical load when the load exceeds the available PV power generation. This type of configuration makes it more efficient as the power transmission losses are much lower than the poor battery efficiencies. The system has a maximum power point tracker, which is an electronic device that monitors and controls the solar PV outputs, to ensure the PV operates near its maximum power point along with the IV curve. A step-up transform and 415 V switchboard were introduced in the system to allow interconnection between the solar PV system and the main grid. The whole inverter station output is connected to a low voltage panel then to a 0.415/11kV step-up transformer. The height of the car park shade is around 3 m. Figure 6A shows the average PV kWh generation in April 2020 when the research was done, while Figures 6B,C show the circuit design and the PDO solar PV car park (The Petroleum, 2020). The details of the parameters of the PV system used for this study are given in Table 1.
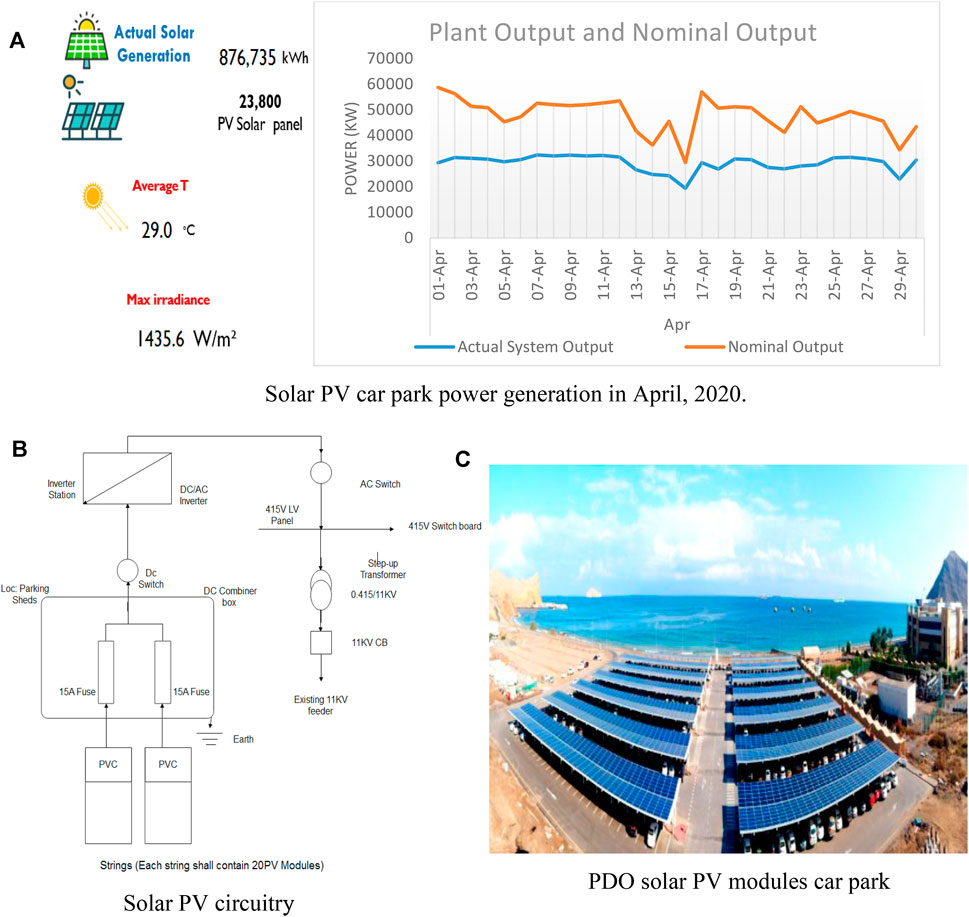
FIGURE 6. The model system of study. (A) Solar PV car park power generation in April, 2020. (B) Solar PV circuitry (The Petroleum Development Company of Oman, 2020). (C) PDO solar PV modules car park (The Petroleum Development Company of Oman, 2020).
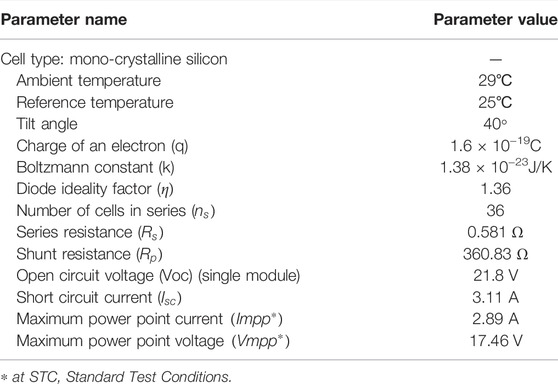
TABLE 1. Model parameters for the solar PV module.
Evaluation of the System Performance
The solar system is evaluated by first carrying out a visual inspection to check the healthiness of the solar PV system. A proper check for any losses in the output due to various reasons like DC cables losses, temperature losses, shadow losses, AC cables losses, inverter losses, and losses due to dust, were also done. Furthermore, function and insulation resistance tests were performed in daylight. Figure 7 represents the maximum output power of the solar PV during day time, where it could be observed that the maximum from the solar PV plant could be obtained at 12 p.m. with a value of about 2,480 kW. Before 6AM and after 4PM there was no solar PV output power generation as seen in Figure 7. Figure 8 compares the actual system output-and nominal output referred to as grid power of the solar PV performance in 2020 from January to July.
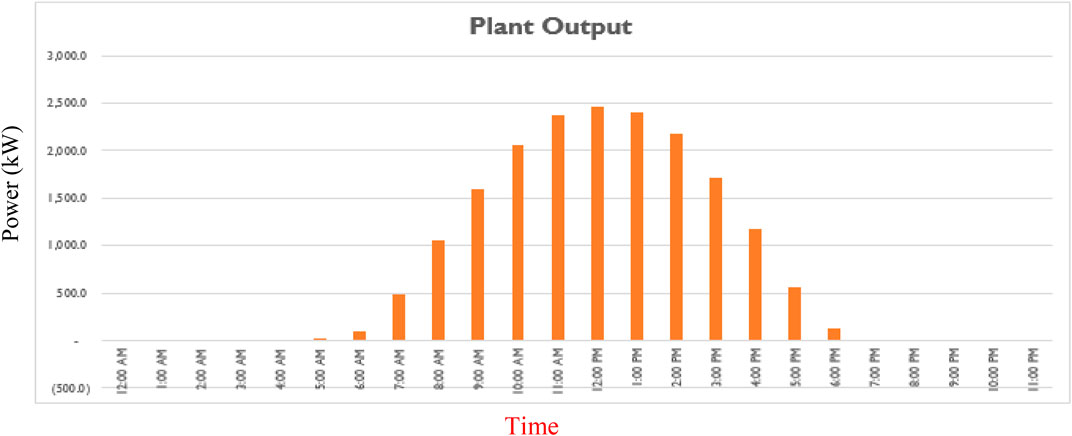
FIGURE 7. Maximum output power of the solar PV during the day time.

FIGURE 8. Actual system output and nominal output with PV power contribution.
The inverter must work effectively to control the grid frequency, while maintaining the output power and voltage. The phase shift is one of the other main problems, which can lead to system collapse by causing voltage imbalance at the grid, however, this concern can be avoided by the inverter. Another phenomenon is the output power fluctuations of the photovoltaic power plant. The slow power fluctuations are also reflected in the power grid and must not exceed ±10% Vrms value for grid safety. If the grid is interrupted due to any reason than the inverter, it should cut-off feeding the grid with the generated power or islanding effect would take place. Therefore, the factors accounted for above are part of the power management and must be maintained by the inverter. For effective power management, a better inverter performance selection can increase the solar power plant efficiency significantly. As shown in Figure 9, the voltage and frequency output was maintained to be within the allowed limit in the course of operation of the solar PV.
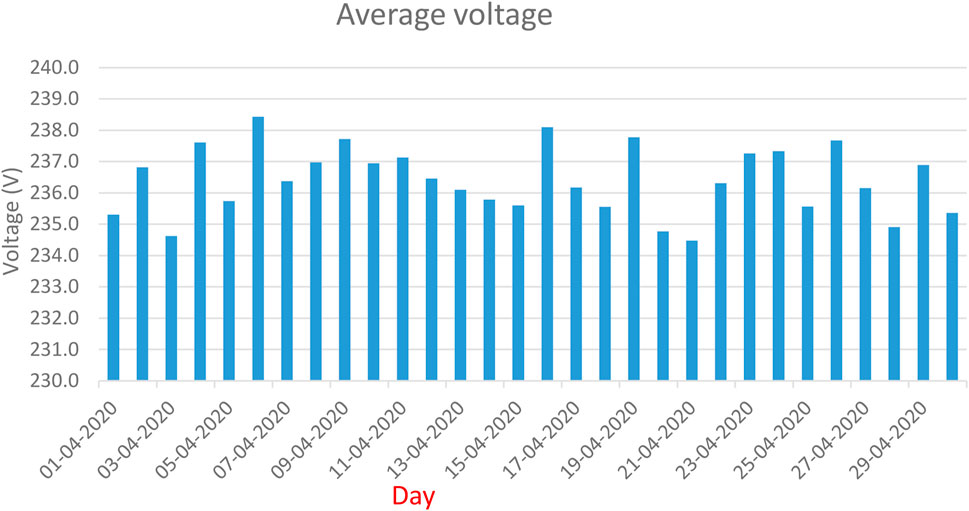
FIGURE 9. Output voltage of solar PV system.
During normal operation conditions, the transmission and distribution system frequency must be 50 Hz as per authority for electricity regulation in the Sultan of Oman. However, there are frequency deviations allowed which should be controlled normally between 49.95 and 50.05 Hz. Therefore, frequency deviation allowed in the Oman power grid is 1% as shown in Figure 10. However, especially in steady-state conditions, the frequency deviation shall not exceed 49.90–50.1 Hz. Figure 11 represents the total output power of PV modules of one phase project during the month of April 2020, where there was a gradual increase in the output of the average power throughout the month.
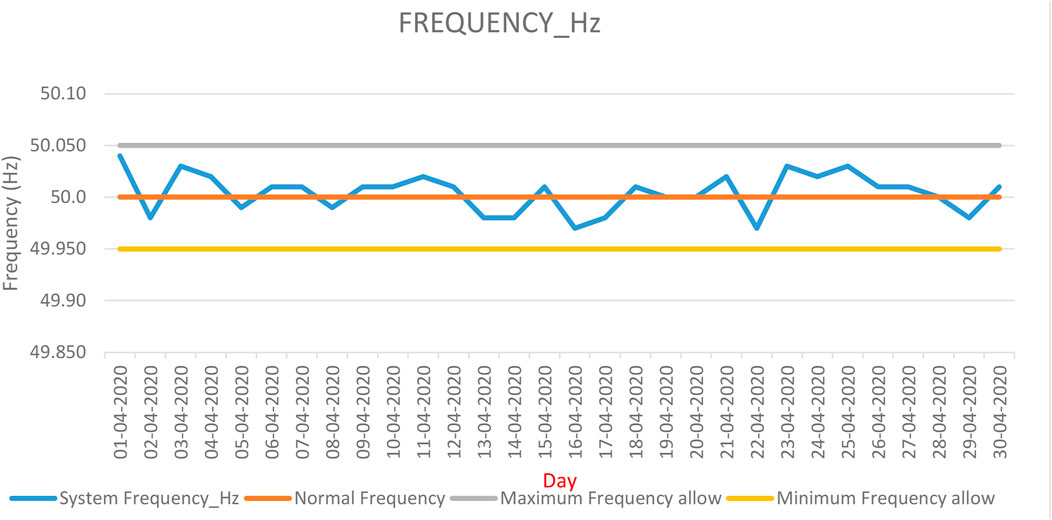
FIGURE 10. Solar PV output frequency.
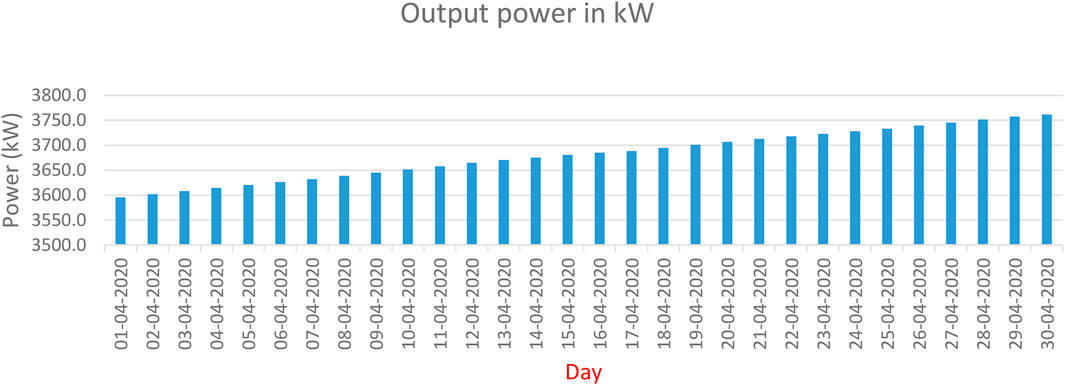
FIGURE 11. Average output power.
Power factor is one of the most critical parameters to be maintained in a power system. Consequently, any power supply connected to the grid should control power factor because low power factor introduce harmonic currents in the utilities. The currents harmonic can create several problems, for example voltage distortion, heating, noises and reduce power line capability. So the recommendations and standards have forced power system operators to maintain the power factor as per regulation of electricity authority. The power factor of the solar PV plant was well maintained between 1 and 0.92 in this study as shown in Figure 12 for the month of April 2020. The effects of dust accumulation, inverter and protection schemes malfunctioning on the solar PV model system of study will be discussed in the subsequent section.
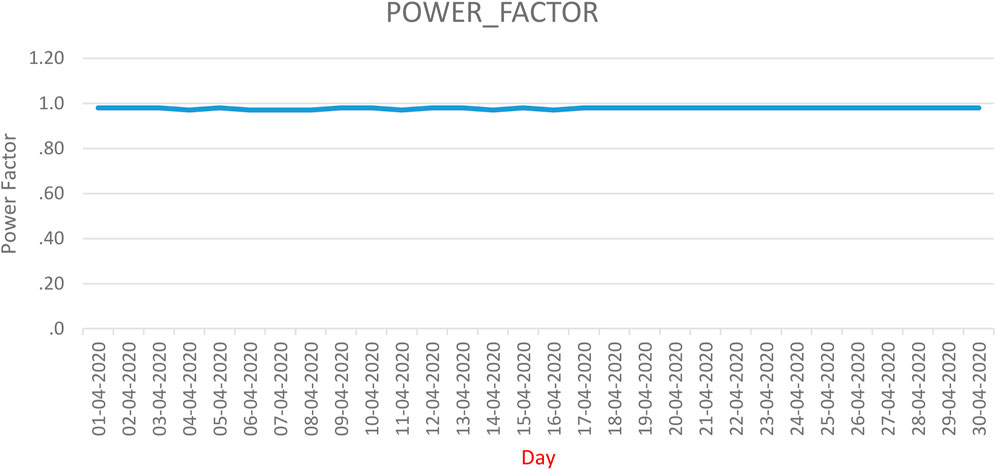
FIGURE 12. The power factor of the solar PV plant
Dust Accumulation
Power generation from solar PV panels can be reduced gradually over time due to dust accumulation on them. There are many factors for dust deposition on PV panels such as airborne dust particles, wind speed, and relative humidity. To maintain the maximum power produced by solar PV panels, they have to be cleaned frequently. Figures 13A,B show a comparison between output production of the solar PVs before cleaning and after cleaning. The data gathering took place for 15 days, when the solar PV modules were dusty, then another 15 days after cleaning the solar PV modules. The most challenging weather in GCC is dusty weather, which will impact the performance of the PV modules and can create a layer on the top of the PV cells, consequently, isolating the PV cells from sun irradiation (Kazem and Chaichan, 2019). Figures 13A,B show that when the solar PV modules were cleaned, better output power was achieved.
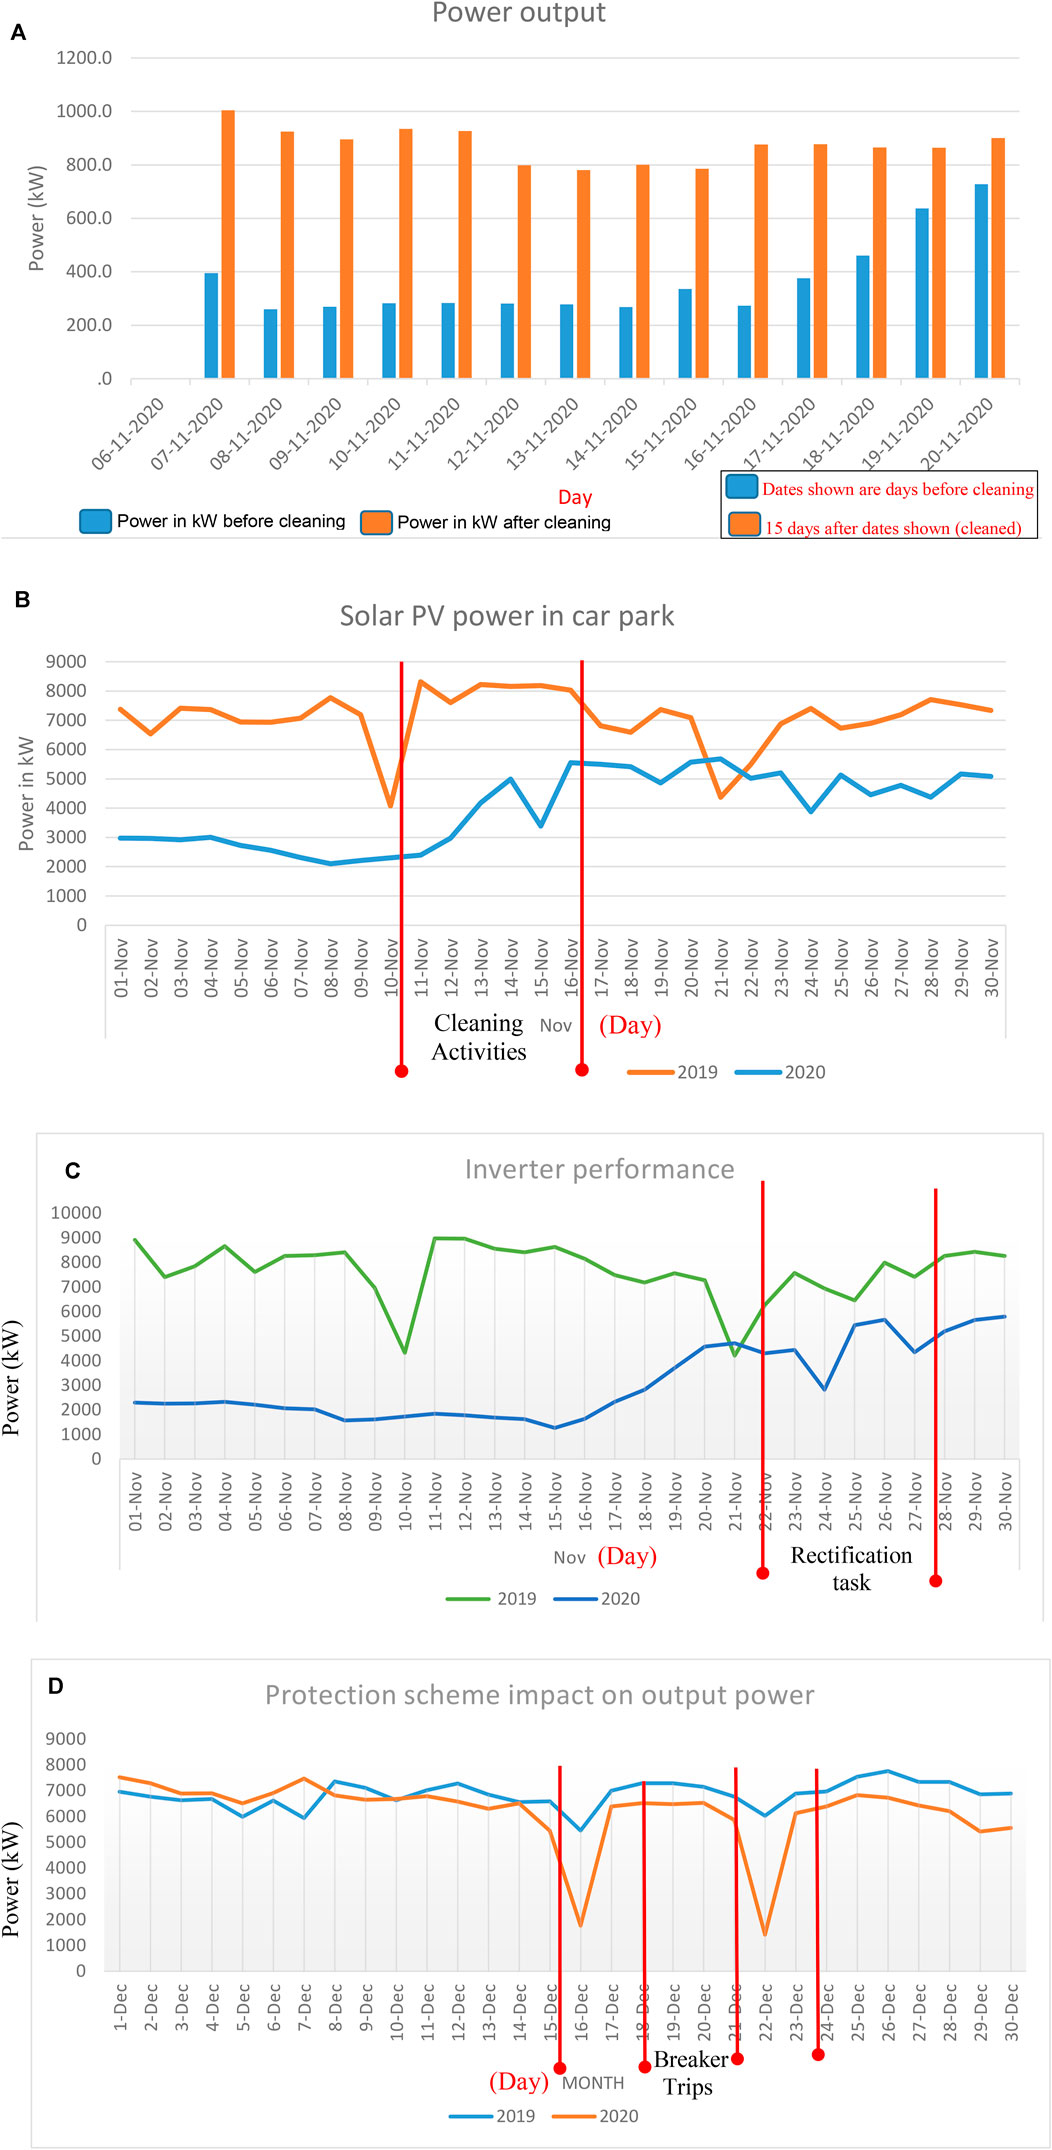
FIGURE 13. (A) Solar PV power production before and after cleaning of the modules. (B) Comparison of solar PV power production before and after cleaning of the modules. (C) Comparison of inverter performance due to malfunction. (D) Solar PV output power due to circuit breaker trip.
Inverter Malfunction
During normal routine check, in November of the same year of the study, it was observed that many inverters are not generating power due to an error (PV resistance fault). Moreover, carbon dust was found inside the inverters. Figure 13C shows a comparison of the power dip during inverter malfunction for 2019 and 2020, in the same month. Figure 13C shows that the malfunction of the inverter scheme resulted in the drop of the output power obtained. However, after rectification of the inverter malfunction, the output power increased to the expected values. The rectification process for the inverter malfunction took place between 22 and 27 November, where it can be observed from Figure 13C that the output power of the inverter improved considerable after 28 November.
Protection System Malfunction
Figure 13D shows the output power of the solar PV system generated in December 2019 and 2020, where the system power had decreased sharply due to frequent protection system trip. The breaker was tripped off by unknown reason. As a result, there was dip in the output power of the solar PV, from its nominal output power. However, there was restoration of the output power after the circuit breaker trip. The trip resulted in voltage dip from about 8,000 kW to about 2,000 kW.
A summary of the solar PV power degradation for the 2 years of investigation carried out in this study is shown in Table 2. From Table 2, more power degradation was observed due to dust accumulation and inverter malfunction, compared to faulty protection scheme.
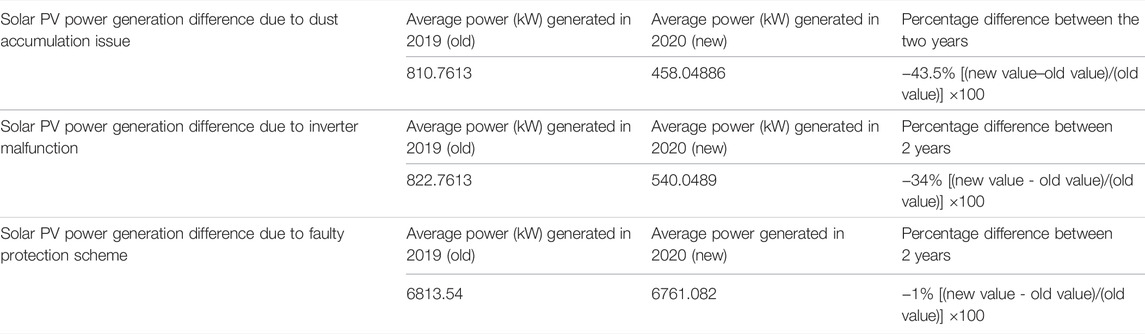
TABLE 2. Percentage degradation of solar PV output power due to internal dynamic failures.
Installation Issues
There are a few installation concerns recorded in the course of this study, which led to safety issues and low power generation in the solar PV system. Table 3 summarizes most problems discovered in this system during the last 3 years of operation. An inadequate solar PV resistance fault, water and dust ingress, faulty protection, and PV modules under shade due to building or trees are some of the major problems identified as failures in the studied system. Moreover, some safety problems were reported such as missing earth or border connections to the module frames, and inverters.
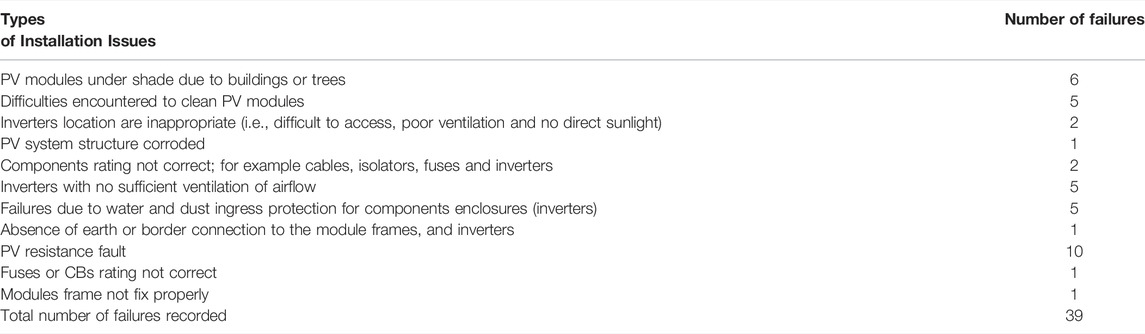
TABLE 3. Number of failures in the solar PV system.
Conclusion
The need for solar PV reliability and performance is imperative nowadays for smooth and effective operation. In this paper, some of the critical failures in solar PV systems which could lead to low power generation were investigated. It is important to investigate and study the photovoltaic modules performances in order to understand the challenges and failures in the course of their operation. The installation of solar PV modules under local climatic conditions, can have negative or positive impact to solar system. This paper investigated the main failures observed in solar PVs; dust accumulation, inverter and protection system malfunction. It was observed from the presented results that the solar PV power dropped sharply due to solid dust accumulation on the top of the solar PV cells, resulting in a degradation of -43.5% of the solar PV power. Since this case study system in this article took place in Oman which is located in a tropical desert climate, it is difficult to maintain a clean surface of the solar PV cells all the time. The use of automatic system like robots for cleaning the solar PV cells is very costly and requires special maintenance. An alternative way to maintain the solar PV cell is by planting trees in ground surface and surroundings to avoid sand storm and mitigate dust accumulation. Inverter and protection system malfunction are the other failures that could be observed in solar PV systems, which may lead to power outage. Inverter malfunction resulted in a degradation of 34% of the solar PV power, while protection system failure resulted in 1% of the solar PV power degradation. A solution to these solar PV failures could be testing the inverters and circuit breakers properly before installation and also carrying out a frequent functional test from time to time to avoid power outage. The results from this investigation would help for reliable performance and effective future deployment of solar PV systems in Oman. Also, the knowledge gained from this research would be useful in fault detection and diagnosis of solar photovoltaic systems, in industries and communities, for reliable operation and optimal performance, with less downtime.
Data Availability Statement
The original contributions presented in the study are included in the article/Supplementary Material, further inquiries can be directed to the corresponding author.
Author Contributions
AA did the literature review and sourcing of the data for the paper. KO did the conceptualization, analysis and writing of the paper.
Conflict of Interest
The authors declare that the research was conducted in the absence of any commercial or financial relationships that could be construed as a potential conflict of interest.
Publisher’s Note
All claims expressed in this article are solely those of the authors and do not necessarily represent those of their affiliated organizations, or those of the publisher, the editors and the reviewers. Any product that may be evaluated in this article, or claim that may be made by its manufacturer, is not guaranteed or endorsed by the publisher.
References
Abdallah, M., Al-Balushi, S., Alomairi, A., and Okedu, K. E. (2021). Power Situation in Oman and Prospects of Integrating Smart Grid Technologies. Int. J. Smart Grid. 5 (1), 45–62.
Abdullahi, A. M. (2018). Solar Energy Potentials and Benefits in the Gulf Cooperation Council Countries: A Review of Substantial Issues. Energies. 11, 372–392. doi:10.3390/en11020372
Al-Badi, A. H., Albadi, M. H., Al-Lawati, A. M., and Malik, A. S. (2011). Economic Perspective of PV Electricity in Oman. Energy. 36, 226–232. doi:10.1016/j.energy.2010.10.047
Al-Sabounchi, A. M., Yalyali, S. A., and Al-Thani, H. A. (2013). Design and Performance Evaluation of a Photovoltaic Grid-Connected System in Hot Weather Conditions. Renew. Energ. 53, 71–78. doi:10.1016/j.renene.2012.10.039
Alshawaf, M., Poudineh, R., and Alhajeri, N. S. (2020). Solar PV in Kuwait: The Effect of Ambient Temperature and Sandstorms on Output Variability and Uncertainty. Renew. Sustainable Energ. Rev. 134, 110346. doi:10.1016/j.rser.2020.110346
Authority for Electricity Regulation (AER) of Oman (2020). Report on Gulf Cooperation Council Interconnection Power System.
Beser, E., Arifoglu, B., Camur, S., and Beser, E. K. (2010). A Grid-Connected Photovoltaic Power Conversion System with Single-phase Multilevel Inverter. Solar Energy. 84, 2056–2067. doi:10.1016/j.solener.2010.09.011
Csavina, J., Field, J., Félix, O., Corral-Avitia, A. Y., Sáez, A. E., and Betterton, E. A. (2014). Effect of Wind Speed and Relative Humidity on Atmospheric Dust Concentrations in Semi-arid Climates. Sci. Total Environ. 487, 82–90. doi:10.1016/j.scitotenv.2014.03.138
Das, S., Tang, Y. K., Marma, S., Hasan, K., Ahmed, K., Nessa, A., et al. (2021). “Design and Analysis of an AC Coupled Photovoltaic System for an Off-Grid Community in Chittagong Hill Tracts,” in 6th International Conference on Renewable Energy Generation and Applications (ICREGA), Al Ain, United Arab Emirates, 02-04 Feb 2021, 39–43.
Dey, B. K., Khan, I., Mandal, N., and Bhattacharjee, A. (2016). “October. Mathematical Modelling and Characteristic Analysis of Solar PV Cell,” in 2016 IEEE 7th Annual Information Technology, Electronics and Mobile Communication Conference (IEMCON) (IEEE), 1–5.
Guo, B., Javed, W., Figgis, B. W., and Mirza, T. (2015). Effect of Dust and Weather Conditions on Photovoltaic Performance in Doha, Qatar, Conference. NJ: IEEE, 1–6.
International Renewable Energy Agency (IRENA) (2016). Renewable Energy Market Analysis: The GCC Region. Abu Dhabi: IRENAUAE.
Ismail, A. M., Ramirez-Iniguez, R., Asif, M., Munir, A. B., and Muhammad-Sukki, F. (2015). Progress of Solar Photovoltaic in ASEAN Countries: A Review. Renew. Sustainable Energ. Rev. 48, 399–412. doi:10.1016/j.rser.2015.04.010
Jha, S. K. (2013). Application of Solar Photovoltaic System in Oman Overview of Technology, Opportunities and Challenges. Int. J. Renew. Energ. Res. 3 (2), 331–340.
Jordan, D. C., Wohlgemuth, J. H., and Kurtz, S. R. (2012). “Technology and Climate Trends in PV Module Degradation,” in Proceedings of the 27th European Photovoltaic Solar Energy Conference Frankfurt, Germany, 3118–3124.
Kazem, H. A., and Chaichan, M. T. (2019). The Effect of Dust Accumulation and Cleaning Methods on PV Panels' Outcomes Based on an Experimental Study of Six Locations in Northern Oman. Solar Energy. 187, 30–38. doi:10.1016/j.solener.2019.05.036
Kim, J.-Y., JeonHong, G.-Y. W. H., and Hong, W.-H. (2009). The Performance and Economical Analysis of Grid-Connected Photovoltaic Systems in Daegu, Korea. Appl. Energ. 86 (2), 265–272. doi:10.1016/j.apenergy.2008.04.006
Kontges, M., Paggi, M., Herz, M., Weiss, K. A., Jahn, U., Parlevliet, D., et al. (2017). Assessment of Photovoltaic Module Failures in the Field" IEA PVPS Task 13. Paris, France: International Energy Agency IEA, 1–120.
Majed, A. R., Gueymard, C. A., Al-Khayat, M., Ismail, A., Lee, J. A., and Al-Duaj, H. (2020). Performance Evaluation of a Utility-Scale Dual-Technology Photovoltaic Power Plant at the Shagaya Renewable Energy Park in Kuwait. Renew. Sustainable Energ. Rev. 133, 1101. doi:10.1016/j.rser.2020.110139
Munawwar, S., and Ghedira, H. (2014). A Review of Renewable Energy and Solar Industry Growth in the GCC Region. Energ. Proced. 57, 3191–3202. doi:10.1016/j.egypro.2015.06.069
Okedu, K. E., Al Senaidi, A., Al Senaidi, A., Al Senaidi, A., and Al Salmani, W. (2020). Real Time Dynamic Analysis of Solar PV Integration for Energy Optimization. Int. J. Smart Grid. 4, 68–79.
Okedu, K. E., and Al-Hashmi, M. (2018). Assessment of the Cost of Various Renewable Energy Systems to Provide Power for a Small Community: Case of Bukha, Oman. Int. J. Smart Grid. 2 (3), 172–182.
Okedu, K. E., and WaleedAL Salmani, Z. (2019). Smart Grid Technologies in Gulf Cooperation Council Countries: Challenges and Opportunities. Int. J. Smart Grid. 3, 92–102.
Oman Eletcricity Transmission Company (OETC) (2020). Report on the Status of the Power Sector of Oman.
Oman News Agency (2021). Electricity Production in Oman Increases. 9pc by September 2021Available at: https://omannews.gov.om/NewsDescription/ArtMID/392/ArticleID/43313/Electricity-Production-in-Oman-Increases-79pc-by-September-2021.
Overview Oman Climates (2013). Overview Oman Climates. [online] Available at https://www.climatestotravel.com/climate/oman.
Qin, L., Xie, S., Yang, C., and Cao, J. (2013). “June. Dynamic Model and Dynamic Characteristics of Solar Cell,” in 2013 IEEE ECCE Asia Downunder (IEEE), 659–663.
Salim, A. M., and Alsyouf, I. (2020). Development of Renewable Energy in the GCC Region: Status and Challenges. Int. J. Energ. Sector Management. 14 (6), 1049–1071. doi:10.1108/ijesm-07-2019-0012
Shannan, N. M., Yahaya, N. Z., and Singh, B. (2013). “Single-Diode Model and Two-Diode Model of PV Modules: A Comparison,” in IEEE International Conference on Control System, Computing and Engineering, 29 Nov.-1 Dec., 2013 (Malaysia: Penang). doi:10.1109/iccsce.2013.6719960
Sulaiman, S. I., Rahman, T. K. A., Musirin, I., Shaari, S., and Sopian, K. (2012). An Intelligent Method for Sizing Optimization in Grid-Connected Photovoltaic System. Solar Energy. 86, 2067–2082. doi:10.1016/j.solener.2012.04.009
The Petroleum Development Company of Oman (2018). The Petroleum Development Company of Oman (PDO). Muscat: Solar PV Car Park
The Petroleum Development Company of Oman (2020). The Petroleum Development Company of Oman (PDO). Muscat: Solar PV Car Park
Tleis, N. D., Zhao, Y., Lehman, B., de Palma, J. F., Mosesian, J., and Lyons, R. (2011). “Fault Analysis in Solar PV Arrays under: Low Irradiance Conditions and Reverse Connections,” in 2011 37th IEEE Photovoltaic Specialists Conference (IEEE), 002000–002005.
Keywords: solar PV, dust accumulation, failure, oman power grid, fault analysis
Citation: Okedu KE and Al Ghaithi ASS (2022) Comparative Study of the Internal Dynamic Failures of Grid-Connected Solar PVs: The Case of the Oman Power Network. Front. Energy Res. 10:858803. doi: 10.3389/fenrg.2022.858803
Received: 20 January 2022; Accepted: 29 March 2022;
Published: 09 May 2022.
Edited by:
Zhirong Liao, North China Electric Power University, ChinaReviewed by:
Narottam Das, Central Queensland University, AustraliaDaniel Tudor Cotfas, Transilvania University of Brașov, Romania
Copyright © 2022 Okedu and Al Ghaithi. This is an open-access article distributed under the terms of the Creative Commons Attribution License (CC BY). The use, distribution or reproduction in other forums is permitted, provided the original author(s) and the copyright owner(s) are credited and that the original publication in this journal is cited, in accordance with accepted academic practice. No use, distribution or reproduction is permitted which does not comply with these terms.
*Correspondence: Kenneth E. Okedu, a2Vub2tlZHVAeWFob28uY29t, b2tlZHVrZW5uZXRoQG51LmVkdS5vbQ==