 Bhogula Navothna
 Sandhya Thotakura
- Department of Electrical, Electronics and Communication Engineering, Gandhi Institute of Technology and Management (Deemed to be University), Visakhapatnam, India
This article presents a detailed analysis of the performance, rate of degradation, and power and energy loss of a 1 MWp scale solar photovoltaic (PV) plant in the academic institution GITAM (Deemed to be University), located in the coastal region of Andhra Pradesh, India. The PV plant consists of 3,078 polycrystalline PV modules of 325 Wp rating, installed on the rooftop of the institute buildings. The annual energy generated is 1684.881 MWh. In this study, performance analysis involves the calculation of efficiency, capacity factor, and performance ratio with data simulated using the PVsyst tool. Degradation analysis involves energy light-induced degradation (LID) and degradation rate (DR). The predicted result provides an estimate for optimal functioning of PV plant with an annual capacity factor, performance ratio, and energy loss of 11.3%, 87.9%, and −26%, respectively. Energy loss by light-induced degradation is predicted as −2.7%/year, and the degradation rate of module per year is −0.6% to −5%.
Introduction
The focus on increasing renewable resources has become one of the crucial methods to overcome the scarcity of electricity after the depletion of traditional energy sources and reduce atmospheric issues by utilizing fossil fuels. Decommissioning and dismantling conventional energy plants such as nuclear and thermal are implemented worldwide. Solar power, biomass, and hydropower are all excellent sources of renewable energy. The total installed capacity is 378.43 GW as of 31.10.2020 in India. Among this electricity mix, renewable energy sources contribute 36.2% (according to a report on load generation 2019–2020 by the Ministry of Power, Government of India, listed on its website: https://powermin.gov.in/en/content/power-sector-glance-all-india). The power generating capacity has to be increased to reach peak energy demand. Owing to the several advantages of solar energy resources over the other non-conventional sources, solar energy can increase the electricity generation capacity. The benefits of employing solar energy resources are abundant: eco-friendliness, decreased tariff, less maintenance, and reliability (Thapar et al., 2018). Research presented the initiative policies made by the government of India on encouraging grid-connected roof-top photovoltaic (PV) systems and off-grid systems.
The research by Subramaniyan et al. (2018) discussed the contribution of non-conventional resources such as solar and wind power and the estimation of these resources with a peak period technique in Rajasthan. In the study presented by Rodrigues et al. (2019), feasibility analysis to install a grid-connected PV plant to the state university of Campinas is estimated using two simulation tools, one of which is PVsystV6 and the other is Helioscope. The performance rate of the proposed plant is about 81.2 and 80.83% in PVsyst and Helioscope, respectively. In a performance study of a 100 kWp grid-connected solar PV system, the performance ratio (PR) is observed to be 80% using PVsyst V6.52 software (Kumar et al., 2017a). In the research conducted by Kumar and Sudhakar (2015) on a 10 MWp solar photovoltaic plant, the largest PV plant located at Ramagundem, the PR is observed to be 86.12% and capacity utilization factor (CUF). A performance study of PV systems situated in Eastern India exhibited a PR of 0.78, PV efficiency of 13.42%, and system efficiency of 12.05% (Sharma and Goel, 2017). In a performance analysis carried out by Yadav et al. (2015) on a 1 kWp PV system located in Hamirpur, the PR and average solar radiation are recorded as 0.724 and 4.4 kWh/m2, respectively, on a specific day. In a degradation study conducted in the semi-arid climate on a c-si photovoltaic system for four years, the highest PR of 76.46% is spotted in the presentation (Kumar and Malvoni, 2019). In a performance analysis carried out by Kumar et al. (2016) on a 10 KW roof-top photovoltaic system, the capacity factor is noticed as 17.8%, 18.5%, and 19.3% with two crystalline silicon-type and one thin-film-type technology, respectively. In an article by Thotakura et al. (2020), research was carried out on the performance of 1 MW scale grid-tied roof-top solar PV plants in a coastal region in India having tropical wet and dry conditions. Real-time data are monitored and compared with PVGIS, PV Watts, and PVsyst software simulation tools. The megawatt plant’s capacity factor is 21.77%, with an annual energy generation of 168.488 MWh.
The operational performance was analyzed by Sudhakar et al. (2021) on a 2 MWp solar plant in Kerala, India, and an average performance ratio and capacity utilization factor of 73.39 and 15.41% were stated. Because of the monsoon season, there is a reduction of 35% in energy generation, mainly due to cloudy and rainy weather conditions. Dahmoun et al. (2021), in their research, published the literature on the operational performance analysis of a grid-tied 23.92 MWp solar PV plant located in Algeria for a period of 36 months. They reported a 5.46 kWh/kWp/day of an annual average daily array, 4.95 kWh/kWp/day of final yield, 82.02% of PR, and 20.64% of CUF. The real-time data are compared with the PVsyst and solar GIS tools and found a strong coincidence. The article by Bansal et al. (2021) presented a study on a 5 MW grid-integrated solar PV plant installed with crystalline silicon modules investigated for seven years. The authors checked the degradation analysis and performance assessment in Gujarat, India, which has hot and dry climate. It is mentioned that, from 2013 to 2016, the yearly average PR, CUF, inverter efficiency, and PV system efficiency of 73%, 17–18%, 96%, and 10.29–10.415% are attained and during 2017–2019, the values are in the range of 70% of PR, CUF of 14–16%, respectively.
The study by Ameur et al. (2022) covered six-year working data of a 5.94 kWp PV system comprising 2.04 kWp polycrystalline, 2.04 kWp monocrystalline (m-Si), and 1.86 kWp amorphous (a-Si) technologies to estimate the long-term performance and degradation rate for different climatic conditions of Ifrane, Morocco. Correlating with the present study technology, the polycrystalline system has a degradation rate of 0.36 ± 0.01%/year and 0.28 ± 0.004%/year with linear regression and classical seasonal decomposition statistical techniques and a performance ratio of 84.32%. In the literature (Makrides et al., 2010; Sharma et al., 2014; Sinha and Chandel, 2014; Gökmen et al., 2016; Kichou et al., 2016; Khandelwal and Shrivastava, 2017; Kumar et al., 2016; Kumar et al., 2017a; Kumar et al., 2017b; Jiang et al., 2016; Dubey et al., 2017; Sharma and Goel, 2017; Vasita et al., 2017; Atluri et al., 2018; Bhullar and Lalwani, 2018; Kichou et al., 2018; Prakhya and Reddy, 2018; Sudhakar and Samykano, 2018; Kumar N. et al., 2019; Kumar and Subathra, 2019; Navothna et al., 2020; Aoun, 2020; Thapar and Sharma, 2020), the researchers addressed about the performance factors, losses, and efficiency of solar PV plants located in various climatic regions. Few authors adopted simulation tools PVGIS, PV Watts, and PVsyst to compare with the monitored data. However, this kind of exploration is site specific, as various factors influence the technical activity of the solar PV plant of the region in which it is located. This analysis has not been carried out in the present study location (coastal region, Visakhapatnam, India) to the best of the authors’ knowledge.
In the present study, the analysis of grid-connected PV systems near coastal areas is evaluated using the PVsyst simulation tool. Analyzing performance parameters is also essential to improve the solar photovoltaic system installations. Hence, the following are the present study’s goals:
• To model and comprehend the operation of a roof-top grid-connected PV system installed on the rooftops of an educational institution Gandhi Institute of Technology and Management, Visakhapatnam, Andhra Pradesh, India
• To comprehend the energy conversion process and explore the various energy losses of roof-top polycrystalline solar PV systems built in the coastal region
• Degradation estimation of the photovoltaic plant
In the present study, performance specifications are identified, which are helpful for the feasibility analysis of the solar PV system in coastal areas. The results obtained from this study will create awareness of the potential of such a system being used to control the problem of energy scarcity and increase the use of non-conventional energy sources in various parts of the world. The developing countries can be global leaders in utilizing these sources.
System Description
In the present study, a 1 MWp roof-top solar photovoltaic power plant connected to the grid was assembled on an educational Institute, Gandhi Institute of Technology and Management, Vishakhapatnam, located in the coastal region of Andhra Pradesh, India, is discussed. The plant consists of 23 PV arrays installed at 15 building terraces and 23 inverters with a capacity of 20 kWp/50 kWp. The plant is located in latitude 17° 48′ 8.208″ N and longitude 83˚23′ 6.54″ E. The detailed electrical specifications of the PV plant and the geometrical site map are provided in Supplementary Data.
Framework and Methodology
The performance study of the grid-connected PV system installed on the rooftops of academic buildings includes the normalized parameters that characterize the operating performance of the PV system. The parameters considered for the assessment in the present study location are array energy, net array energy output, array efficiency, grid energy, net energy output of PV system, system efficiency, capacity factor, performance ratio, loss, and degradation rate. The performance of this system can be compared to that of other PV systems under various working situations once these parameters have been determined. To predict and analyze the working of the PV system, the data related to the plant and selective simulation tools are required. The current study indicates the performance parameters of the solar plant located in a coastal area. The critical parameters and their equations for analysis are also furnished (Malvoni et al., 2017a). The methodology for the analysis is illustrated as follows:
• The critical data for the analysis of PV plants such as the geographical specification of the study location (coordinates, weather conditions, temperature, solar irradiation, and wind speed), PV module, and inverter specifications are accumulated.
• One of the most widely used PV system simulation tools is identified. In this study, PVsyst is preferred for the performance and irradiation analysis of the PV system.
• Performance parameters of the solar PV plant are studied in detail and presented with their equations. The energy and efficiency parameters are estimated.
• Degradation analysis of the solar PV plant is analyzed by mainly focusing on the light-induced degradation (LID) and degradation rate (DR).
PVsyst Software Tool
PVsyst software is one of the most widely used simulation tools in the design and calculation of basic considerations of photovoltaic systems PVSyst (2021). Modeling in PVsyst starts with system sizing, which comprises desired power rating or available area, PV module, and inverter sizing. Based on the given input specifications, the PVsyst will propose module configurations for further simulation study. This software updates weather details of the selected location, which helps in evaluating output parameters. PVsyst tool gives monthly global irradiance, diffuse irradiance, temperature, and wind speed of the selected location. Based on these data, the trajectory of the Sun, which provides information on losses that occur during period of a year, is also given. The results of the simulation tool include total energy produced, performance ratio, and specific energy. By utilizing these results, energy yield, capacity factor, and efficiency of PV array and PV system can be calculated. The existing PV system behavior and further expansion of the system can be carried out Photovoltaic Software (2021).
Array Energy
It is the energy generated by a photovoltaic array. Array energy mainly depends on the area of the total array of the PV system [AA], solar radiation [Is] incident on PV modules, and the efficiency of the PV module
Net Array Energy Output
A solar array is a group of solar modules joined in series and parallel. Hence the net array energy output mainly depends on the area of the total arrays of the PV system, the efficiency of the PV module for the incident solar irradiation, and the full capacity of the solar PV plant. It is also expressed as the ratio of energy array to the entire plant capacity (PC), as shown in the following equation:
Array Efficiency
Any system’s efficiency is determined by the input it receives and the output it produces. The efficiency of an array is determined by the input, which is the solar irradiation dispersed across the entire array, and the generated output energy as expressed in the following equation:
Grid Energy
The existing plant is an integrated grid system, the energy generated by the PV arrays is converted to AC and pumped into the grid via inverters. Solar energy generation depends on solar irradiation, and energy conversion depends on the inverter’s performance and losses. Hence the grid energy is expressed in Eq. 4 as a product of array energy
Net Energy Output of the PV System
It is the solar PV system’s net energy output, expressed as a ratio of energy injected into the grid to the capacity of the solar PV plant, as shown in the following equation:
System Efficiency
A solar System’s efficiency is commonly defined as the ratio of solar energy input to electrical energy output. The system efficiency depends on many parameters, whereas here, it is declared as the ratio of grid energy [EGE] to the solar irradiation [Is] and the area of total PV arrays [AA].
Capacity Factor [Fc]
The capacity factor can be defined as the actual electricity production divided by a power plant’s maximum feasible electrical output over some time, as shown in the following equation:
Performance Ratio
The performance ratio (PR) is a frequently used term for assessing the relative performance of solar panels with different designs, technologies, capacities, and locations. PR is calculated using Eq. 8, where it is expressed as a percentage ratio of net grid energy output [ DEG] to the reference energy yield [YR].
Loss and Degradation Rate [DR]
Loss and degradation rate are the two essential parameters for analyzing the performance of PV systems. In a survey conducted by the National Centre for PV Research and Education at the Indian Institute of Technology, Bombay, and National Institute of Solar Energy, Haryana, it is assumed that the deterioration in crystalline silicon modules would vary from −0.6 to −5%/year (Dubey et al., 2016; Dubey et al., 2017). The mathematical equation for degradation rate can be expressed as (Kumar et al., 2019)
where m: slope and c: intercept. These values are considered for the present study directly from the literature (Kumar N. M. et al., 2019).
Results and Discussion
Analysis of Solar Radiation and Ambient Temperature
The solar irradiation and ambient air temperature of the study location from January 2020 to December 2020 are shown in Figure 1. Monthly solar irradiation and ambient temperature are obtained for analysis from the PVsyst simulation software tool. The annual average horizontal global solar irradiation is observed as 153.91 kWh/m2. The maximum Sun irradiation of 190 kWh/m2 is recorded in April, and the lowest in December, with 137 kWh/m2. The maximum ambient temperature is in May at 30.7°C and the minimum in December at 24.6°C.
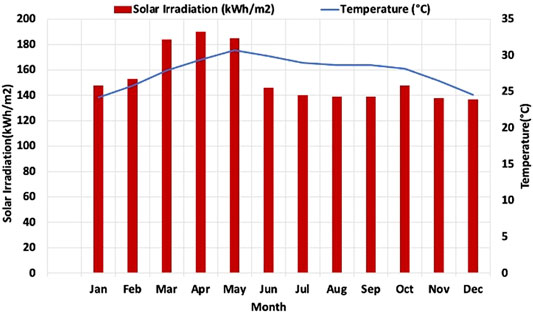
FIGURE 1. Monthly solar irradiation and ambient temperature.
Energy Analysis
Figure 2A presents the estimated energy yields and energy given to the grid of the PV system. The total amount of energy generated from the PV system is 1780.878 MWh. The PV system yield ranges between 118.537 MWh in July and 178.499 MWh in March. Each year, the total quantity of AC energy put into the grid is about 1684.881 MWh. In July, the AC energy output was 118.537 MWh, while in March, it was 169.306 MWh. It is observed that the difference between DC and AC energy yields is caused by energy loss. This energy loss is due to module temperatures and various system constituents (Sharma and Goel, 2017). The PV system’s average efficiency in each month is estimated and shown in Figure 2A for extensive examination of PV system performance. The average annual efficiency of the total system is 16.3%, whereas the array efficiency varies between 16.24% (July) to 16.48% (May). In Figure 2B, the variation of specific energy over 1 year is presented. The total yearly electricity yielded from the PV system was 1774 kWh/kWp. The least and maximum possible monthly definite energy predicted are 125 kWh/kWp in July and 178 kWh/kWp in March, respectively. The total yearly energy at grid end is 1679 kWh/kWp, with a minimum monthly specific energy of 118 kWh/kWp predicted in July and a maximum of 169 kWh/kWp in March. The total annual energy delivered into the grid is estimated to be around 1684.881 MWh, with a minimum of 3,823 kWh anticipated in July and a maximum of 5,617 kWh during April. The average amount of energy injected every hour into the grid is forecasted to be 159 kWh in July and 234 kWh in April, which are presented in Figure 2C.
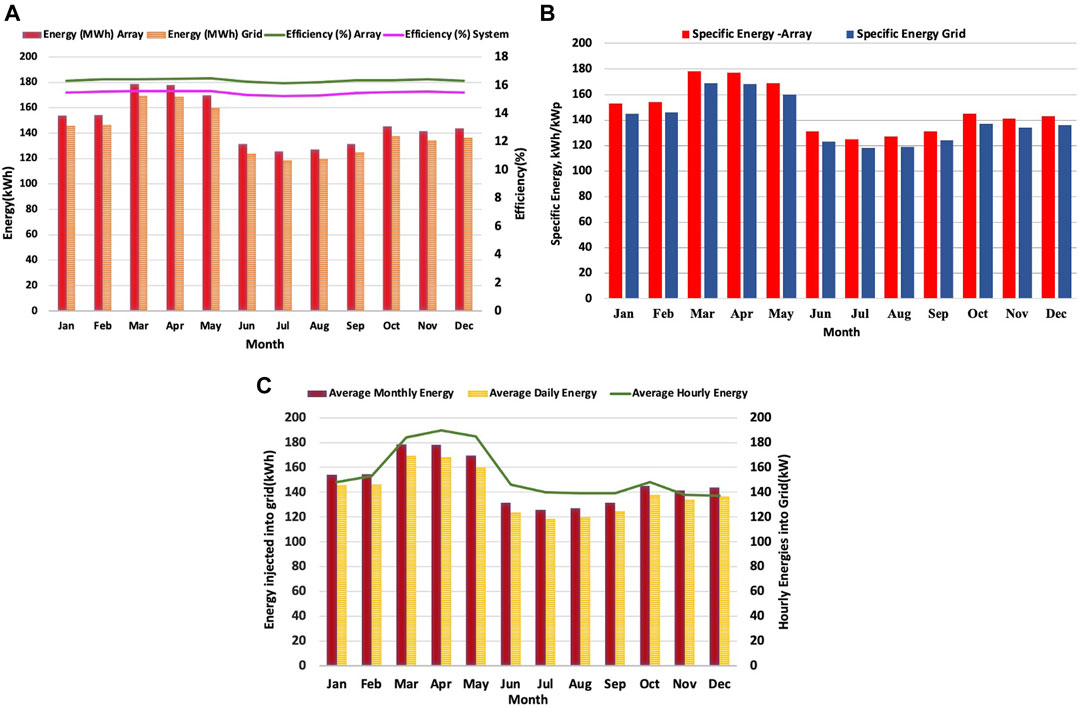
FIGURE 2. (A) Estimated energy generated and efficiency of the PV plant (B) Monthly specific energy output of the plant (C) Average monthly and hourly energy injected into grid by the PV plant.
Capacity Factor (Fc) and Performance Ratio (PR)
The two key performance indicators of the PV system are capacity factor and performance ratio. The yearly average capacity factor was 11.3%, with the least forecasted value of 9% in August and a peak forecasted value of 14% in March. The average annual performance ratio was 87.96%, with the least indicated with a value of 86.51% in July and peak forecasted with 88.79% in May. Figure 3 displays the Fc and PR of the PV plant. Even though the capacity utilization factor and performance ratio both depends on the energy yield of the solar PV system, there are other individual parameters that each of them depends on. Capacity factor also depends on the operating time of the PV plant, whereas performance ratio is proportional to reference energy yield, which makes the difference in their final values.
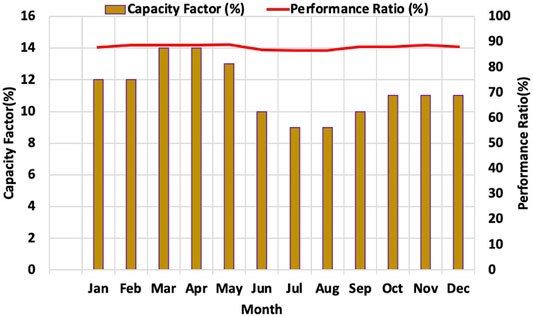
FIGURE 3. Monthy average capacity factor and performance ratio.
Loss Analysis
In this section, the energy losses are evaluated in a 1 MW roof-top connected PV system over 12 months using a PV system modeling technique and are presented in Figure 4. The energy loss varies from -0.7% (−12900.311 kWh) to −9.7% (−204877.98 kWh). The minimum foreseen worth is because of auxiliaries (−0.6%), system inaccessibility (−0.7%), and from the side of the electrical converter, there are losses in the AC resistance unit (0.7%). The temperature was the source of the greatest anticipated energy loss (9.7%). Nonetheless, the loss in energy due to solar irradiance levels on the PV module (3.9%), module quality loss (−3.1%), and light-induced deterioration are all significant (2.6%), and also the electrical converter operational loss (−2.3%) is additionally limiting the effectiveness of the PV system. The total energy losses are estimated as 715.76 MWh, with a total energy loss of 34.9%.
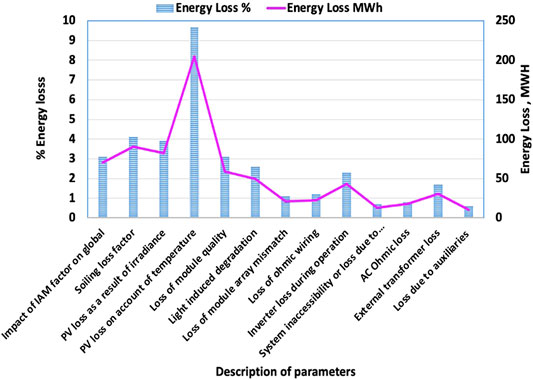
FIGURE 4. Energy loss estimation of PV plant.
Degradation Analysis
The loss in the performance of the solar modules due to exposure to sunlight is named light-induced degradation (LID). Accurate measurement of power loss over time is marked as degradation rate (DR), where these two parameters play as vital performance indicators of a PV system. The observations show a LID of -2.7%, which accounts for the energy loss value of −49,588.921 kWh/year for the PV system. Estimated energy loss because of the degradation rate within 1 MW crystalline PV plant ranges from −10,689.3 to −89,099.5 kWh/year, respectively.
Correlation With the Present-Day Literature
The forecasted parameter in this study is equated with different PV systems based on the given performance information in their literature. The findings of this investigation appear to be consistent with those of previous studies, as shown in Table 1. This study helps the investors and researchers function of PV plants in the coastal areas.
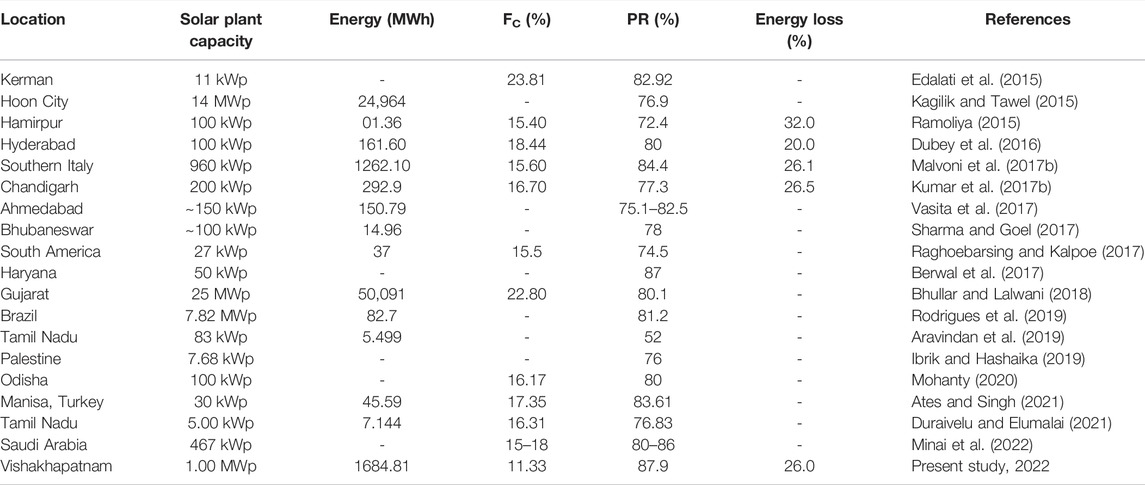
TABLE 1. Performance correlation with existing roof-top PV plants.
Conclusion
The present case study involves a detailed analysis of the performance of a 1 MW power solar PV plant for coastal weather conditions in Visakhapatnam, India, mainly using the energy outputs, losses, and degradation rate. As per the weather conditions of the location, the following observations are made:
• The annual average horizontal global solar irradiation at the present study location is recorded as 153.91 kWh/m2, with maximum sun irradiation of 190 kWh/m2 in April and the lowest value of 137 kWh/m2 during December
• The total energy generation from the 1 MW power plant is estimated as 1780.878 MWh
• Each year, the AC energy injected into the grid is 1684.881 MWh
• The average annual efficiency of the entire plant is approximated as 16.3%, whereas the PV array efficiency may vary between 16.24 and 16.48%
• The yearly average capacity factor of the solar PV plant is around 11.3%
• With the polycrystalline panels, the 1 MW power PV plant operates with the PR% of 87.9%, with the highest PR value of 88.79% in May due to the highest solar irradiation during the summer season
• The energy losses are −26%
• Under these climatic circumstances, the degradation rate of a photovoltaic array is between −0.6 and −5% every year
Data Availability Statement
The original contributions presented in the study are included in the article/Supplementary Material, further inquiries can be directed to the corresponding author.
Author Contributions
Conceptualization, writing—review and editing, and supervision: ST; data curation, formal analysis, investigation, and writing: BN,.
Conflict of Interest
The authors declare that the research was conducted in the absence of any commercial or financial relationships that could be construed as a potential conflict of interest.
Publisher’s Note
All claims expressed in this article are solely those of the authors and do not necessarily represent those of their affiliated organizations, or those of the publisher, the editors, and the reviewers. Any product that may be evaluated in this article, or claim that may be made by its manufacturer, is not guaranteed or endorsed by the publisher.
Acknowledgments
The authors thank GITAM (Deemed to be University) for providing the data for conducting this study.
Supplementary Material
The Supplementary Material for this article can be found online at: https://www.frontiersin.org/articles/10.3389/fenrg.2022.857948/full#supplementary-material
References
Ameur, A., Berrada, A., Bouaichi, A., and Loudiyi, K. (2022). Long-term Performance and Degradation Analysis of Different PV Modules under Temperate Climate. Renew. Energ. 188, 37–51. doi:10.1016/j.renene.2022.02.025
Aoun, N. (2020). Performance Analysis of a 20 MW Grid-Connected Photovoltaic Installation in Adrar, South of Algeria. Adv. Stat. Model. Forecast. Fault Detect. Renew. Energ. Syst. 85, 1–12. doi:10.5772/intechopen.89511
Aravindan, M., Balaji, V., Saravanan, V., and Arumugam, M. (2019). Performance Evaluation of Roof Top Solar Photovoltaic Systems in Tamilnadu. Ijape 8 (3), 265–276. doi:10.11591/ijape.v8.i3.pp265-276
Ates, A. M., and Singh, H. (2021). Rooftop Solar Photovoltaic (PV) Plant - One Year Measured Performance and Simulations. J. King Saud Univ. - Sci. 33 (3), 101361. doi:10.1016/j.jksus.2021.101361
Atluri, K., Hananya, S. M., and Navothna, B. (2018). “Performance of Roof-Top Solar PV System with Crystalline Solar Cells,” in Proceedings of the 2018 National Power Engineering Conference (NPEC), Madurai, IndiaMarch 2018 (Piscataway, New Jersey, United States: IEEE). doi:10.1109/npec.2018.8476721
Bansal, N., Pany, P., and Singh, G. (2021). Visual Degradation and Performance Evaluation of Utility Scale Solar Photovoltaic Power Plant in Hot and Dry Climate in Western India. Case Stud. Therm. Eng. 26, 101010. doi:10.1016/j.csite.2021.101010
Berwal, A. K., Kumar, S., Kumari, N., Kumar, V., and Haleem, A. (2017). Design and Analysis of Rooftop Grid Tied 50 kW Capacity Solar Photovoltaic (SPV) Power Plant. Renew. Sustain. Energ. Rev. 77, 1288–1299. doi:10.1016/j.rser.2017.03.017
Bhullar, S. S., and Lalwani, M. (2018). “Performance Analysis of 25 MW Grid-Connected Solar Photovoltaic Plant in Gujarat, India,” in Proceedings of the 2018 3rd International Innovative Applications of Computational Intelligence on Power, Energy and Controls with their Impact on Humanity (CIPECH), Ghaziabad, India, November 2018 (Piscataway, New Jersey, United States: IEEE). doi:10.1109/cipech.2018.8724370
Dahmoun, M. E.-H., Bekkouche, B., Sudhakar, K., Guezgouz, M., Chenafi, A., and Chaouch, A. (2021). Performance Evaluation and Analysis of Grid-Tied Large Scale PV Plant in Algeria. Energ. Sustain. Develop. 61, 181–195. doi:10.1016/j.esd.2021.02.004
Dubey, R., Chattopadhyay, S., Kuthanazhi, V., John, J., Ansari, F., Rambabu, S., et al. (2016). All-India Survey of PV Module Reliability: 2016. Gurugram: NCPRE, IITB and NISE.
Dubey, R., Chattopadhyay, S., Kuthanazhi, V., Kottantharayil, A., Singh Solanki, C., Arora, B. M., et al. (2017). Comprehensive Study of Performance Degradation of Field‐mounted Photovoltaic Modules in India. Energy Sci Eng 5 (1), 51–64. doi:10.1002/ese3.150
Duraivelu, R., and Elumalai, N. (2021). Performance Evaluation of a Decentralized Rooftop Solar Photovoltaic System with a Heat Recovery Cooling Unit. Environ. Sci. Pollut. Res. 28 (15), 19351–19366. doi:10.1007/s11356-020-12104-0
Edalati, S., Ameri, M., and Iranmanesh, M. (2015). Comparative Performance Investigation of Mono- and Poly-Crystalline Silicon Photovoltaic Modules for Use in Grid-Connected Photovoltaic Systems in Dry Climates. Appl. Energ. 160, 255–265. doi:10.1016/j.apenergy.2015.09.064
Gökmen, N., Hu, W., Hou, P., Chen, Z., Sera, D., and Spataru, S. (2016). Investigation of Wind Speed Cooling Effect on PV Panels in Windy Locations. Renew. Energ. 90, 283–290. doi:10.1016/j.renene.2016.01.017
Ibrik, I., and Hashaika, F. (2019). Techno-economic Impact of Grid-Connected Rooftop Solar PV System for Schools in Palestine: a Case Study of Three Schools. Ijeep 9 (3), 291–300. doi:10.32479/ijeep.7593
Jiang, F., Zou, X., and Liu, H. (2016). “Performance Test and Analysis of a PV Power Plant in Hami,” in Proceedings of the 2016 Chinese Control and Decision Conference (CCDC), Yinchuan, China, May 2016 (Piscataway, New Jersey, United States: IEEE). doi:10.1109/ccdc.2016.7532103
Kagilik, A., and Tawel, A. (2015). Performance Analysis of 14 MW Grid-Connected Photovoltaic System. jsesd 4 (1), 11–21. doi:10.51646/jsesd.v4i1.78
Khandelwal, A., and Shrivastava, V. (2017). “Viability of Grid-Connected Solar PV System for a Village of Rajasthan,” in Proceedings of the 2017 International Conference on Information, Communication, Instrumentation and Control (ICICIC), Indore, India, August 2017 (Piscataway, New Jersey, United States: IEEE). doi:10.1109/icomicon.2017.8279175
Kichou, S., Abaslioglu, E., Silvestre, S., Nofuentes, G., Torres-Ramírez, M., and Chouder, A. (2016). Study of Degradation and Evaluation of Model Parameters of Micromorph Silicon Photovoltaic Modules under Outdoor Long Term Exposure in Jaén, Spain. Energ. Convers. Manag. 120, 109–119. doi:10.1016/j.enconman.2016.04.093
Kichou, S., Wolf, P., Silvestre, S., and Chouder, A. (2018). Analysis of the Behaviour of Cadmium telluride and Crystalline Silicon Photovoltaic Modules Deployed Outdoor under Humid continental Climate Conditions. Solar Energy 171, 681–691. doi:10.1016/j.solener.2018.07.028
Kumar, N. M., and Malvoni, M. (2019). A Preliminary Study of the Degradation of Large-Scale C-Si Photovoltaic System under Four Years of Operation in Semi-arid Climates. Results Phys. 12, 1395–1397. doi:10.1016/j.rinp.2019.01.032
Manoj Kumar, N., and Subathra, M. S. P. (2019). Three Years Ahead Solar Irradiance Forecasting to Quantify Degradation Influenced Energy Potentials from Thin Film (A-Si) Photovoltaic System. Results Phys. 12, 701–703. doi:10.1016/j.rinp.2018.12.027
Shiva Kumar, B., and Sudhakar, K. (2015). Performance Evaluation of 10 MW Grid Connected Solar Photovoltaic Power Plant in India. Energ. Rep. 1, 184–192. doi:10.1016/j.egyr.2015.10.001
Kumar, N. M., Reddy, P. R. K., Sunny, K. A., and Navothana, B. (2016). “Annual Energy Prediction of Roof Mount PV System with Crystalline Silicon and Thin Film Modules,” in Proceedings of the Special Section on: Current Research Topics in Power, Nuclear and Fuel Energy, SP-CRTPNFE 2016, from the International Conference on Recent Trends in Engineering, Science and Technology 2016, Hyderabad, India, October 2016, 24–31.
Kumar, N. M., Das, P., and Krishna, P. R. (2017a). “Estimating Grid Feed in Electricity from Roof Integrated Si-Amorph PV System Based on Orientation, Tilt and Available Roof Surface Area,” in Proceedings of the 2017 International Conference on Intelligent Computing, Instrumentation and Control Technologies (ICICICT), Kerala, India, July 2017 (Piscataway, New Jersey, United States: IEEE).
Kumar, N. M., Kumar, M. R., Rejoice, P. R., and Mathew, M. (2017b). Performance Analysis of 100 kWp Grid Connected Si-Poly Photovoltaic System Using PVsyst Simulation Tool. Energ. Proced. 117, 180–189. doi:10.1016/j.egypro.2017.05.121
Kumar, N. M., Gupta, R. P., Mathew, M., Jayakumar, A., and Singh, N. K. (2019a). Performance, Energy Loss, and Degradation Prediction of Roof-Integrated Crystalline Solar PV System Installed in Northern India. Case Stud. Therm. Eng. 13, 100409. doi:10.1016/j.csite.2019.100409
Kumar, N., Sudhakar, K., and Samykano, M. (2019b). Techno-economic Analysis of 1 MWp Grid Connected Solar PV Plant in Malaysia. Int. J. Ambient Energ. 40 (4), 434–443. doi:10.1080/01430750.2017.1410226
Kumar, A. P. (2016). “Analysis of Hybrid Systems: Software Tools,” in Proceedings of the 2016 2nd International Conference on Advances in Electrical, Electronics, Information, Communication and Bio-Informatics (AEEICB), Chennai, India, February 2016 (Piscataway, New Jersey, United States: IEEE). doi:10.1109/aeeicb.2016.7538302
Kumar, N. M. (2017). “Simulation Tools for Technical Sizing and Analysis of Solar PV Systems,” in Proceedings of the 6th World Conference on Applied Sciences, Engineering and Technology (WCSET-2017), Ponorogo, Indonesia, August 2017.
Makrides, G., Zinsser, B., Georghiou, G. E., Schubert, M., and Werner, J. H. (2010). “Evaluation of Grid-Connected Photovoltaic System Performance Losses in Cyprus,” in Proceedings of the 7th Mediterranean Conference and Exhibition on Power Generation, Transmission, Distribution and Energy Conversion (MedPower 2010), Agia Napa, November 2010. doi:10.1049/cp.2010.0883
Malvoni, M., De Giorgi, M. G., and Congedo, P. M. (2017a). Study of Degradation of a Grid Connected Photovoltaic System. Energ. Proced. 126, 644–650. doi:10.1016/j.egypro.2017.08.263
Malvoni, M., Leggieri, A., Maggiotto, G., Congedo, P. M., and De Giorgi, M. G. (2017b). Long Term Performance, Losses and Efficiency Analysis of a 960 kW P Photovoltaic System in the Mediterranean Climate. Energ. Convers. Manag. 145, 169–181. doi:10.1016/j.enconman.2017.04.075
Minai, A. F., Usmani, T., Alotaibi, M. A., Malik, H., and Nassar, M. E. (2022). Performance Analysis and Comparative Study of a 467.2 kWp Grid-Interactive SPV System: A Case Study. Energies 15 (3), 1107. doi:10.3390/en15031107
Mohanty, R. C. (2020). Performance Evaluation of One MW On-Grid SPV Power Generation Plant in Odisha, India. Indian J. Nat. Sci. 10 (58), 18084–18091.
Navothna, B., Kondamudi, S. C., and Thotakura, S. (2020). Review of Photovoltaic Systems Performance Influencing Factors. J. Green Eng. 10, 9052–9067.
Photovoltaic Software (2021). General Description of PV GIS Software. Available at: https://photovoltaic-software.com/pv-softwares-calculators/online-free-photovoltaic-software/pvgis (Accessed February 20th, 2021).
Prakhya, R. K., and Reddy, C. L. (2018). Estimating the Performance Ratio and Degradation Factor of Roof-Toproof-Top Solar PV Plant. CVR J. Sci. Technol. 14, 32–37. doi:10.32377/cvrjst1407
PVSyst (2021). General Description of the PVsyst Software. Available at: http://files.pvsyst.com/help/general_descr.htm (Accessed January 30th, 2021).
Raghoebarsing, A., and Kalpoe, A. (2017). Performance and Economic Analysis of a 27-kW Grid-Connected Photovoltaic System in Suriname. IET Renew. Power Generation 11 (12), 1545–1554. doi:10.1049/iet-rpg.2017.0204
Ramoliya, J. V. (2015). Performance Evaluation of Grid-Connected Solar Photovoltaic Plant Using PVSYST Software. J. Emerging Tech. Innovative Res. (Jetir) 2 (2), 7.
Rodrigues, A., Silva, E., and Seixas, S. (2019). “Performance Analysis of PV System Grid Connected Using Simulation Tools,” in Proceedings of the the 13th Latin-American Congress On Electricity Generation and Transmission, Santiago de Chile, Chile, October 2019.
Sharma, R., and Goel, S. (2017). Performance Analysis of a 11.2 kWp Roof Top Grid-Connected PV System in Eastern India. Energ. Rep. 3, 76–84. doi:10.1016/j.egyr.2017.05.001
Sharma, D. K., Verma, V., and Singh, A. P. (2014). Review and Analysis of Solar Photovoltaic Softwares. Int. J. Curr. Eng. Technol. 4 (2), 725–731.
Sinha, S., and Chandel, S. (2014). Review of Software Tools for Hybrid Renewable Energy Systems. Renew. Sustain. Energ. Rev. 32, 192–205. doi:10.1016/j.rser.2014.01.035
Subramaniyan, S., Mathew, M., and Hossain, J. (2018). “Renewable Energy Capacity Value Estimation Using Peak Period Method in Rajasthan,” in Proceedings of the 2018 3rd International Conference for Convergence in Technology (I2CT), Pune, India, April 2018 (Piscataway, New Jersey, United States: IEEE). doi:10.1109/i2ct.2018.8529338
Sudhakar, K., and Samykano, M. (2018). “Performance of Utility Scale PV Plant in Malaysia and India: a Comparative Study,” in Proceedings of the 2018 4th International Conference on Electrical Energy Systems (ICEES), Chennai, India, February 2018 (Piscataway, New Jersey, United States: IEEE).
Sudhakar, K., Ngui, W., and Kirpichnikova, I. (2021). Energy Analysis of Utility-Scale PV Plant in the Rain-Dominated Tropical Monsoon Climates. Case Stud. Therm. Eng. 26, 101123. doi:10.1016/j.csite.2021.101123
Thapar, S., and Sharma, S. (2020). Factors Impacting Wind and Solar Power Sectors in India: A Survey-Based Analysis. Sustainable Prod. Consumption 21, 204–215. doi:10.1016/j.spc.2020.01.001
Thapar, S., Sharma, S., and Verma, A. (2018). Analyzing Solar Auctions in India: Identifying Key Determinants. Energ. Sustain. Develop. 45, 66–78. doi:10.1016/j.esd.2018.05.003
Thotakura, S., Kondamudi, S. C., Xavier, J. F., Quanjin, M., Reddy, G. R., Gangwar, P., et al. (2020). Operational Performance of Megawatt-Scale Grid Integrated Roof-Toproof-Top Solar PV System in Tropical Wet and Dry Climates of India. Case Stud. Therm. Eng. 18, 100602. doi:10.1016/j.csite.2020.100602
Vasita, J., Shakhiya, Q., and Modi, J. (2017). “Feasibility Study and Performance Evaluation of a Grid-Connected Roof-Toproof-Top Solar PV System,” in Proceedings of the 2017 International Conference on Information, Communication, Instrumentation and Control (ICICIC), Indore, India, August 2017 (Piscataway, New Jersey, United States: IEEE).
Yadav, P., Kumar, N., and Chandel, S. (2015). “Simulation and Performance Analysis of a 1 kWp Photovoltaic System Using PVsyst,” in 2015 International Conference on Computation of Power, Energy, Information and Communication (ICCPEIC), Melmaruvathur, India, April 2015 (Piscataway, New Jersey, United States: IEEE). doi:10.1109/iccpeic.2015.7259481
Nomenclature
PV Photovoltaic
LID Light-induced degradation
DR Degradation rate
PC Plant capacity (kWh)
ηA Array efficiency (%)
Keywords: photovoltaic, performance parameters, energy loss, degradation rate, PV SYST
Citation: Navothna B and Thotakura S (2022) Analysis on Large-Scale Solar PV Plant Energy Performance–Loss–Degradation in Coastal Climates of India. Front. Energy Res. 10:857948. doi: 10.3389/fenrg.2022.857948
Received: 19 January 2022; Accepted: 02 March 2022;
Published: 06 April 2022.
Edited by:
Sofiane Kichou, Czech Technical University in Prague, CzechiaReviewed by:
Sunanda Sinha, Malaviya National Institute of Technology, IndiaSatish Kumar Yadav, University of Lucknow, India
Copyright © 2022 Navothna and Thotakura. This is an open-access article distributed under the terms of the Creative Commons Attribution License (CC BY). The use, distribution or reproduction in other forums is permitted, provided the original author(s) and the copyright owner(s) are credited and that the original publication in this journal is cited, in accordance with accepted academic practice. No use, distribution or reproduction is permitted which does not comply with these terms.
*Correspondence: Sandhya Thotakura, c2FuZGh5YXRob3Rha3VyYUBnbWFpbC5jb20=