- Forest Products Laboratory, USDA FS, Madison, WI, United States
In the bio-based economy, conversion of biomass to biofuels and other products is essential for developing a sustainable alternative to fossil fuels. For this to become a reality, understanding of the biomass ultrastructure is critically important. For instance, to enhance the yield of fermentable sugars from enzymatic hydrolysis of cellulose, the understanding of the latter’s supramolecular structure and the ability to modify it appropriately is essential. Although cellulose crystallinity is one way to define the aggregated structure, previous research has shown that merely studying how cellulose crystallinity influences the hydrolysis is not good enough. This deduction is based on the fact that not only most crystallinity estimation methods have limitations but also crystallinity measurement inadequately defines the aggregated state of cellulose. Therefore, better approaches to describe the ultrastructure are needed. Raman spectroscopy is particularly well suited to this task because, in addition to crystallinity, several pieces of structure-related information can be generated, which when combined provide a more comprehensive description of the aggregated state. Additionally, the information derived using Raman spectroscopy is more resolved because it comes from spectral features that represent both the aggregated and the molecular states of cellulose. Few examples will be presented to illustrate this capability.
Introduction
Wood and other lignocellulosic biomass contain a significant amount of carbohydrate polymers that can be enzymatically converted to ethanol and other useful products (Huber et al., 2006; Zhu et al., 2009; Chundawat et al., 2011; Zhou et al., 2018). However, prior to their conversion, the native polymers need to be hydrolyzed to lower molecular weight sugars. A review of the literature on this subject shows that the recalcitrancy of biomass to enzyme hydrolysis is due to two factors—inaccessibility of cellulose and crystallinity of cellulose (Fan et al., 1980; Himmel and Picataggio, 2008; Johnson and Elander, 2008; Agarwal et al., 2013a; Leu and Zhu, 2013). To make cellulose accessible to enzymes, typically a pretreatment is required where one or more of the non-cellulosic polymers are either partly removed or modified (Himmel and Picataggio, 2008; Zhu et al., 2009; Yu et al., 2022). Such pretreated biomass then becomes more amenable to conversion to sugars. On the other hand, the negative effect of cellulose crystallinity (CrI) on the conversion is controversial. There are studies that support its negative impact (Fan et al., 1980; Ohmine et al., 1983; Mosier et al., 2005; Ibbett, et al., 2013) and reports that show that the CrI by itself is not a problem (Jeoh et al., 2007; Gierlinger et al., 2008; Rollin et al., 2010; Foston et al., 2011; Agarwal et al., 2013a; Aldaeus et al., 2015; Gao et al., 2021). It may be that the size of the cellulose crystals plays a role, highly crystalline and thicker crystals may pose a problem, but nano-sized crystalline cellulose may not (as in the G-layer in tension wood). If true, the latter is likely to be due to the increased surface area that the smaller size crystals provide. In any case, this aspect needs to be further investigated.
Although cellulose CrI is often measured and reported using one of the many available methods (e.g., XRD, IR, NMR, and Raman spectroscopy), considering that there are significant limitations associated with most of the methods, it seems that its estimation is not very accurate (Park et al, 2009; Park et al., 2010; Agarwal et al., 2010; Agarwal et al., 2018; Agarwal et al., 2021a). For instance, XRD methods are often used but because the obtained diffractogram is a convolution of contributions from many sources (e.g., crystalline and non-crystalline cellulose, amorphous cellulose, hemicellulose, and lignin), the obtained data need to be deconvoluted. However, there is no unique way to accomplish this (Madams, 1980; Park et al, 2009; Park et al., 2010). Similarly, some other methods (e.g., Rietveld analysis) (De Figueiredo and Ferreira, 2014; Ling et al., 2019) need prior crystalline knowledge of the sample components in order to model a fit to the obtained diffractogram. This also introduces subjectivity in the analysis, and hence, the obtained result is influenced. Furthermore, it has been reported that the XRD-estimated CrI is impacted by the water content of the sample (Agarwal et al., 2017). The reason for this is the ability of non-crystalline and amorphous cellulose to reorganize in the presence of water (Agarwal et al., 2017; Agarwal et al., 2021a; Agarwal et al., 2021b). Similarly, as was recently reported using IR and Raman spectroscopies, non-crystalline cellulose is capable of contributing in the same wavenumber and X-ray diffraction regions as the crystalline form (Agarwal et al., 2021a). Therefore, when present, such non-crystalline cellulose would contribute toward the estimated CrI of a material. Likewise, in solid-state MAS–NMR, it is well recognized that the CrI depends on the amount of water in the sample (Park et al, 2009; Agarwal et al., 2021b). To obtain well-resolved peaks in NMR, as a standard sampling protocol, certain amount of water is regularly added to the sample (Wickholm et al., 1998). This neglects the fact that the water addition causes reorganization of the less-than-fully-crystalline cellulose. And consequently, higher CrI values are obtained. Similarly, in 380-Raman, involved band intensities are slightly impacted by the sample’s water content (Agarwal et al., 2021b). Given this situation, it is clear that to estimate cellulose CrI more accurately, better methods are needed. It appears that two recently developed methods, 93-Raman (Agarwal et al., 2018) and 3-THz (terahertz spectroscopy) (Vieira and Pasquini, 2014; Wang et al., 2020; Wang et al., 2021) are promising. Both these methods, although based on different spectroscopy techniques, estimate CrI using the same cellulose-crystal mode. Nevertheless, these methods need to be applied to a wide variety of cellulose materials before either one or both can be considered precise.
Many forms of aggregated cellulose are far from fully crystalline or amorphous, and it is vitally important to fully characterize them. Considering that not only cellulose CrI measurement has limited accuracy but also it is only one of the many characteristics of cellulose supramolecular structure, use of methods that give additional structural information is desirable. One such technique is MAS–NMR, where in addition to CrI, other structural parameters, such as lateral fibril dimension and tg/gt ratio, can be estimated (Wickholm et al., 1998; Peciulyte et al., 2015; Agarwal et al., 2021b). Nevertheless, additional methods are needed to further define the ultrastructure. For this purpose, applications of Raman spectroscopy have been developed in the laboratory of the author. Over the years, many of these methods have provided detailed structural information on cellulose. Here, such methods are briefly reviewed, and a case is made for their broader applicability so that the changes in the cellulose supramolecular structure can be more precisely evaluated. It is projected that improved understanding of the structure would yield to improved valorization of biomass largely due to better appraisal of the ways in which process conditions impact the supramolecular structure of cellulose.
Raman Spectroscopy of Cellulose
In the studies of cellulose, although Raman spectroscopy was first applied a long time ago (Atalla and Dimick, 1975), the technological evolution of the instrumentation has led to countless advances in the area (Baldwin et al., 2002; Adar et al., 2007). Consequently, by means of modern instrumentation, the applications to the fields of cellulose and lignocellulose have greatly advanced (Agarwal, 2019). In particular, two classes of the applications stand out—applications based on Raman imaging and analysis using the 1,064-nm excitation-based FT–Raman technique. In the imaging, capability exists to chemically map the distribution of the material components at submicron level. On the other hand, the use of FT–Raman permits acquisition of high-quality fluorescence-free spectra. Raman spectroscopy is being increasingly applied to many areas of cellulose research, and the obtained information has proven to be highly valuable. Recently, a review focusing on such advances was published (Agarwal, 2019). In this study, the focus is on those features in the Raman spectra of celluloses that have generated useful information in the context of aggregated structure of cellulose. A significant amount of the reported work was carried out in the laboratory of the author. However, where appropriate, the information from the literature is also included.
In the Raman spectra of celluloses, the assignments of most of the bands are available in the literature (Wiley and Atalla, 1987; Edwards et al., 1997). In Table 1, only those bands and their assignments are listed that are used in the information presented here.

TABLE 1. Selected Raman frequencies and their assignments (70–1,550 cm−1) of cellulose I (Avicel I), cellulose II (Avicel II), and amorphous cellulose (Avicel amorphous).
Cellulose Crystallinity
To estimate cellulose CrI, three Raman spectroscopy-based methods are used. They are based on the spectral contributions of crystalline cellulose at 1,481, 380, and 93 cm−1 (Figure 1), and these are, respectively, referred to as 1481-Raman, 380-Raman, and 93-Raman (Schenzel et al., 2005; Agarwal et al., 2010; Agarwal et al., 2018, respectively). Of the three methods, the 1481-Raman method, which was developed first and is based on the ratio of the 1,481 to 1,460 cm−1 band intensities, is most limited. Even for pure celluloses, not only the bands at 1,481 and 1,460 cm−1 have medium intensities but they also overlap significantly. Therefore, one needs to deconvolute them prior to intensity calculation. Added complexity arises for samples that contain other components such as hemicelluloses and lignin because Raman contributions of these are also present in the same spectral region (Agarwal and Ralph, 1997).
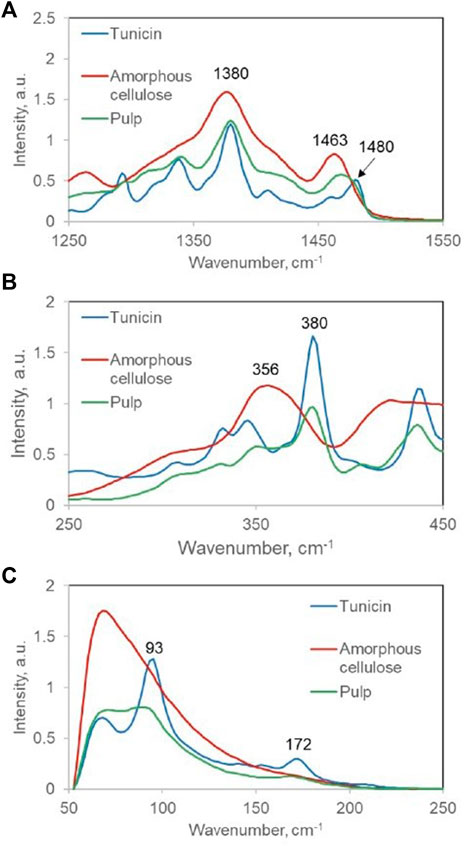
FIGURE 1. Raman spectra of tunicin (very high CrI), bleached hardwood kraft pulp (medium CrI), and completely amorphous cellulose (zero CrI) in the regions on which the three Raman methods are based; (A) 1,481 cm−1, (B) 380 cm−1, and (C) 93 cm−1.
The second method, 380-Raman, developed in 2010, seems to suffer the characteristic that it fails to differentiate between organized and crystalline cellulose. As was reported earlier by Agarwal et al. (2018), the method estimated CrI values of 49.9 and 57.4% for aspen and red pine woods, respectively (Agarwal et al., 2013b), but in fact, later, the native cellulose in the wood cell wall was found to be non-crystalline (Agarwal et al., 2016). This further supported the argument that cellulose that is simply spatially organized/ordered and not crystalline is capable of making contributions in the spectral/diffraction regions that are typically associated with crystalline cellulose. The supporting evidence for this argument was recently obtained from the research that was based on ball-milled celluloses (Agarwal et al., 2021a), which clearly established that non-crystalline cellulose is indeed capable of making contributions where the contributions of crystalline cellulose are usually detected.
Contrary to the aforementioned two Raman methods, the third method, the 93-Raman, seems to accurately estimate the crystallinity. This method is synonymous with the 3 THz method in terahertz spectroscopy (Parrott and Zeitler, 2015; Agarwal et al., 2018; Wang et al., 2020; Wang et al., 2021) since both the methods detect the same lattice mode of crystalline cellulose. Moreover, as would be expected, the two spectroscopic energies are approximately equivalent (99 cm−1 = 3 THz). Nevertheless, because these methods were recently developed, they have yet not been applied widely.
Conformation of Exocyclic CH2OH
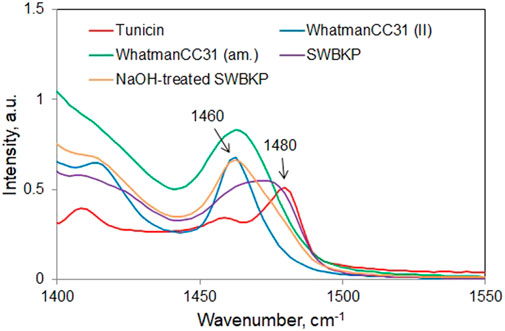
In the Raman spectra of celluloses, the contributions of CH2 bending modes that are sensitive to tg and gt conformation appear at 1,480 and 1,460 cm−1, respectively (Figure 2). Whereas tg conformation containing cellulose I allomorph gives rise to a peak at 1,480 cm−1, the gt conformation-rich cellulose II, cellulose III, and amorphous phase all appear at 1,460 cm−1. Therefore, from the Raman spectrum of a sample, exocyclic CH2OH conformational information can be derived from the relative intensities at these two wavenumber positions. Based on Eqn. 1, the data in Table 2 summarize such information for a number of cellulose materials including those that are highly crystalline (e.g., #1 and #9). Whatman CC31 (II), a highly crystalline cellulose II sample, was produced from the previously obtained Whatman CC31 (II) sample (Agarwal et al., 2017) by additionally treating it with 2.5 N HCl at 100°C for 60 min. Further details on the other listed materials in Table 2 can be obtained from the following references: Whatman CC31 amorphous (Agarwal et al., 2010), softwood bleached kraft pulp (SWBKP), never-dried NaOH-treated aspen wood holocellulose, HCl- and NaOH-treated aspen wood holocellulose, Avicel PH-101, Avicel PH-101 + 10% xylan, Whatman CC31 (cotton microcrystalline cellulose or MCC), tunicin, 95.6% crystalline (Agarwal et al., 2016), and 10% NaOH (at 170°C)-treated SWBKP (Agarwal et al., 2021c). In materials that are composed of only cellulose I allomorph, meaning that in addition to crystalline domains, only the amorphous phase is present, the gt/tg ratio is a measure of the disordered form of cellulose (Schenzel et al., 2005). As pointed out earlier, for cellulose I materials, one of the Raman CrI methods is based on the tg/gt ratio (1481-Raman). From the gt/tg ratio data given in Table 2, tunicin, a highly crystalline cellulose Iβ material, showed the lowest gt/tg ratio (0.36).
In Table 2, considering the ratio data of the cellulose I and non-crystalline materials (see classification column) and excluding those that have cellulose II (#1 and #4, Table 2) or are completely amorphous (#2), the highest ratio is for #5 (never-dried NaOH-treated aspen wood holocellulose), implying that it is the most disordered. However, it is important to note that this sample was classified as non-crystalline and not as cellulose I (Agarwal et al., 2017; Agarwal et al., 2018). Compared to its ratio value (0.82, Table 2), the cellulose I samples (#3, #6, #7 - #10) all showed lower values implying reduced degree of the CH2OH gt conformational disorder.
Accessibility to Water
Accessibility to water (A) of a cellulose sample is based on the ratio of two numbers. The numbers, for the sample and for the completely amorphous cellulose (which is taken as 100% accessible to water), are increases in the relative intensity of the 1,380-cm−1 band (I1380/I1096 ratio), when all the D2O-accessible C6 OHs are converted to C6 OD groups. As reported previously (Agarwal et al., 2016; Agarwal et al., 2021a), Eq. 2 was used to calculate A. The A data are listed in Table 2.
In Figure 3, two sets of spectra are shown, one for tunicin—a highly crystalline Iβ cellulose, which showed no increase (Figure 3A), and the other set for completely amorphous cellulose, which showed a 154% increase (Figure 3B). Moreover, considering that there are two types of accessible C6 OHs located either on the surface or in the interior of cellulose that can contribute to such an intensity increase, the “A” value represents the sum of both such contributions. However, depending on the characteristics of a sample, one or the other contribution type may dominate. For instance, in mostly crystalline nano-size celluloses, the surface contribution would be dominant.
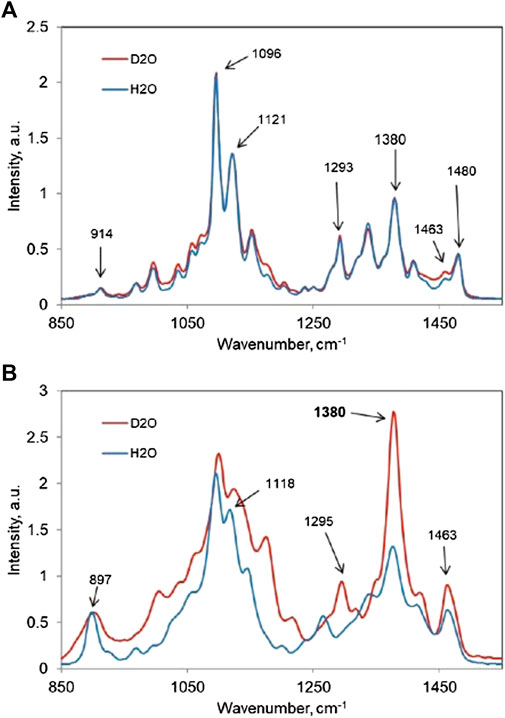
FIGURE 3. In H2O and D2O Raman spectra, in 850- to 1,550-cm−1 region, of (A) tunicin and (B) completely amorphous cellulose.
In the case of tunicin (Figure 3A), hardly any intensity increase at 1,380 cm−1 is seen because nearly all cellulose is present in the crystalline state and the size of the crystal is substantial (10 nm) (Agarwal et al., 2017). This implies that the contribution from the surfaces is minimal due to fewer surface CH2OH groups being available for the OH-to-OD exchange. Moreover, because the measurement of A does not discriminate between the accessible surface and interior CH2OH groups, a thin crystal, although fully crystalline, might produce a higher A value than a thick crystal that, in the interior, is not completely crystalline.
Chain Conformational Disorder
Recently, using Raman spectroscopy, we have introduced a new cellulose parameter “chain conformational disorder” (CCONDIS), which is yet another feature of the aggregated cellulose structure (Agarwal et al., 2021b). For a material, CCONDIS is defined as the intensity ratio I900/I1096, where 120-min ball-milled cotton MCC is taken as being 100% disordered (CCONDIS = 100). It has been observed that with the increased chain conformational disorder, the intensities of Raman bands at 900 and 1,096 cm−1 are impacted the most, whereas the intensity of the former band increases, and it declines in the case of the 1,096 cm−1 band (Agarwal et al., 2010; Agarwal et al., 2021b). Therefore, the ratio of these two intensities (Eq. 3) is a good measure of this disorder.
In the publication (Agarwal et al., 2021b), CCONDIS data were generated for a set of cellulose nanocrystals (CNCs) that were obtained from a variety of sources, and it was found that in all the cases, compared to the wet state, the disorder was higher in the freeze-dried state (Agarwal et al., 2021b). Moreover, among the CNCs, wet Cladophora CNCs showed the least amount of the conformational disorder, whereas the freeze-dried pulp CNCs had the most disorder. Nevertheless, the observed trend in the wet state was not necessarily maintained on freeze-drying. In Table 3, CCONDIS data are reported for a number of samples.
Additional details on the samples can be obtained from the author’s earlier publications: amorphous cellulose and Whatman CC31 MCC (Agarwal et al., 2010); never-dried and freeze-dried SWBKPs (Agarwal et al., 2021b); 5% NaOH-treated (at 170°C) SWBKP (Agarwal et al., 2021c); and never-dried and oven-dried 4% NaOH-treated aspen wood holocellulose, 4% NaOH- and 4 N HCl (100°C, 6 h)-treated aspen wood holocellulose, wet Avicel PH-101, wet (Avicel PH-101 + 10% xylan), tunicin, and 95.6% crystalline (Agarwal et al., 2016).
Moreover, in Table 3, the sample compositions have been classified in terms of presence of cellulose and hemicellulose. This gives some information about the components that are responsible for the spectral contributions. Most of the samples contain crystalline cellulose I together with some amorphous cellulose. However, several samples that are obtained from wood (#2 - #4; #5 - #7) also contain some hemicellulose.
Of the samples listed in Table 3, normalized Raman spectra of five samples (#1, #2, #5, #8, #11, respectively, amorphous cellulose, never-dried SWBKP, never-dried 4% NaOH-treated aspen wood holocellulose, wet Avicel PH-101, and tunicin), are compared in Figure 4. Based on the band intensities at 900 cm−1, the rank of the samples with the least to most chain disorder is as follows: tunicin < wet Avicel PH-101 < never-dried 4% NaOH-treated aspen wood holocellulose < never-dried SWBKP < amorphous cellulose.
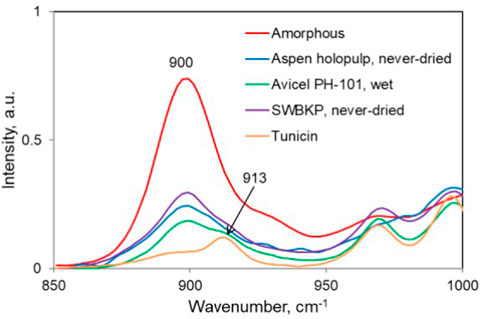
FIGURE 4. 900-cm−1 region of the normalized Raman spectra of selected samples listed in Table 3. The crystalline contribution present at 913 cm−1 can also be seen for some samples.
Considering the CCONDIS data, tunicin, highly crystalline cellulose, gave the lowest value (16.1%, Table 3), and it is likely that the non-zero value might be due to the contributions of the surface chains of the crystals. In the rest of the samples, the values were higher than tunicin. For instance, considering sample #5 (never-dried 4% NaOH-treated aspen wood holocellulose), it had a value of 33.1% (Table 3). However, on oven-drying, the chain disorder in the sample increased to 52.4%, an increase of 58%, suggesting that water removal played an important role in significantly increasing the CCONDIS. When the never-dried sample was treated with HCl to remove the remaining hemicellulose and amorphous cellulose from the sample, the CCONDIS value of the treated sample in the dry state (dried at 25°C) was still higher than the value in the wet state (45 vs. 33.1%, Table 3). This, once again, underscored the importance of water in reducing the CCONDIS because the removal of the less-ordered components from the sample should have resulted in the reduction of CCONDIS, which did not happen. One major difference between these two samples is the state in which they were analyzed—one sampled in the dry state whereas the other in the never-dried state. This order-inducing role of water is further seen when one considers the CCONDIS data for the SWBKP samples (#2–#4, Table 3). Of the three CCONDIS values reported for the pulp samples, the lowest was for the never-dried state (40.6%, Table 3). Once the pulp was freeze-dried, the value increased to 51.2% (#3, Table 3). However, on 5% NaOH treatment (at 170°C), the chain disorder of the dried pulp only slightly declined to 50.2% (#4, Table 3).
Next, wet Avicel PH-101 was compared with the sample where 10% xylan was added to it (#8 and #9, Table 3). The mixture sample was produced to mimic wood pulps, where in addition to cellulose, hemicelluloses are also present. It is found that presence of xylan increased the CCONDIS value only marginally (25.3–28.2%, Table 3), and 90% of the mixed-sample disorder originated from cellulose. This information is important for estimating CCONDIS in samples that additionally contain hemicelluloses. This is particularly relevant because wood hemicelluloses, xylan and glucomannan, both have Raman contributions at 900 cm−1 (Agarwal and Ralph, 1997).
Last, comparing the three pure crystalline celluloses (#8, #10, and #11, Table 3), the obtained data suggested that the chain disorder, from least to most, is in the order tunicin < Whatman CC31 < Avicel PH-101.
Glycosidic Linkage Orientation Disorder
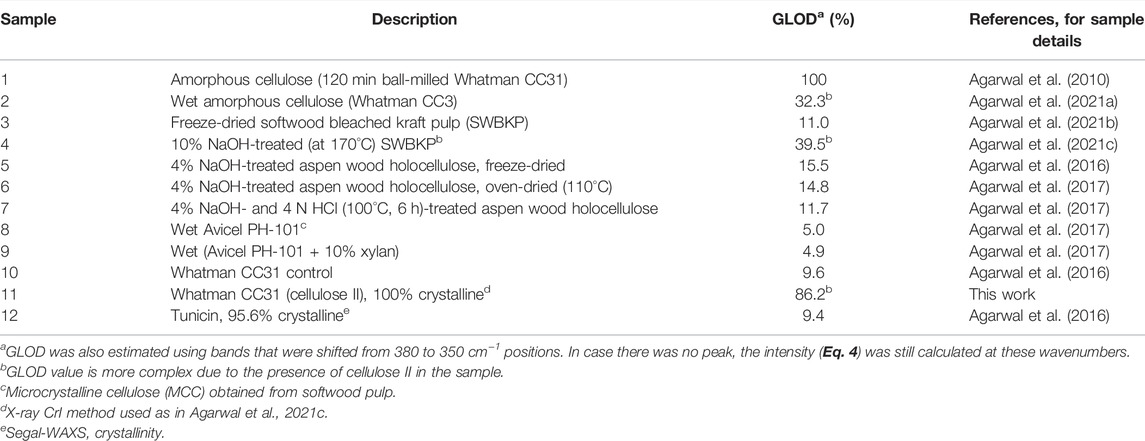
In describing the aggregated state of cellulose, the last Raman parameter that has been found useful is the intensity ratio of two low-frequency bands located approximately at 350 and 380 cm−1 (Eq. 4, Table 4). Although, previously, based on the latter peak, a Raman CrI method (380-Raman) was developed (Agarwal et al., 2010), the ratio I350/I380 in cellulose I materials provides a measure of the overall glycosidic linkage orientation disorder (GLOD) in a sample. In cellulose, this is brought about by the changes in the dihedral angles about the two bonds involved in the glycosidic linkage (Atalla and Dimick, 1975). It is important to note that between the two bands, whereas cellulose I contributes mostly at 380 cm−1, cellulose II, cellulose III, and amorphous cellulose have principal contributions at ∼ 350 cm−1 (Agarwal, 2014; Agarwal et al., 2021c). Therefore, in the presence of allomorphs cellulose II and cellulose III, the ratio’s value is increased by these ordered crystalline forms and the GLOD information becomes difficult to interpret. In Table 4, GLOD data are listed for a variety of samples that also included high crystalline cellulose I and cellulose II materials. The Raman spectra in the selected region are shown in Figure 5. The GLOD data are reported for the first time here.
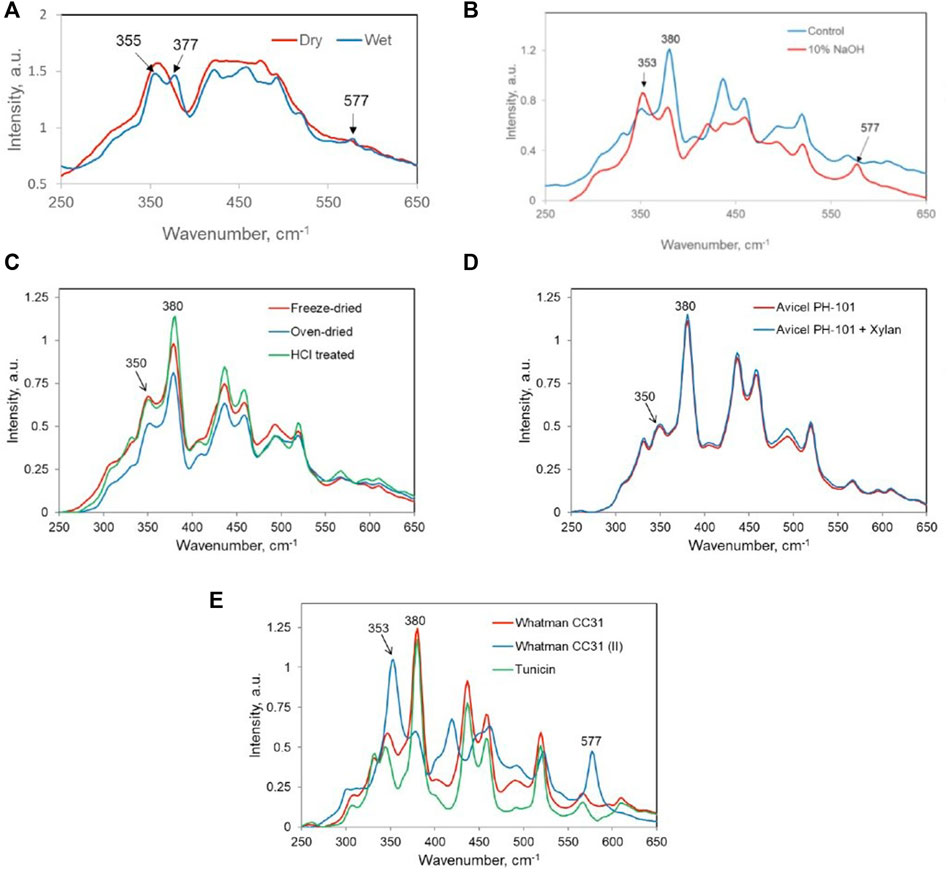
FIGURE 5. Raman spectra of (A) dry amorphous and wet amorphous celluloses; (B) control and 10% NaOH-treated softwood bleached kraft pulp; (C) NaOH-treated aspen holopulp—freeze-dried, oven-dried, and HCl-treated (#5, #6, and #7, Table 4); (D) Avicel PH-101 and 10% xylan containing Avicel PH-101 (samples #8 and #9, Table 4); (E) Whatman CC31, Whatman CC31 (Cellulose II), and tunicin (#10–#12, respectively; Table 4).
Comparing the GLOD data for totally amorphous cellulose in dry and wet states (Figure 5A), although in the wet state, there is some cellulose II present, the one treated with water at 25°C showed more than 3 times reduction in the disorder (#1 and #2, Table 4). As was reported earlier (Agarwal et al., 2021a), this was due to significant reorganization of the amorphous cellulose into cellulose I and cellulose II type structures. Consequently, the Raman intensity at 353 cm−1 declined and increased at 377 cm−1(Figure 5A). The next set of samples, #3 and #4, are SWBKP materials, one of which was treated with 10% NaOH at 170°C for 90 min (Agarwal et al., 2021c). As was reported in the cited reference, the alkali treatment partially converted pulp cellulose to cellulose II, which was revealed by its Raman spectrum due to the presence of a new cellulose band at 577 cm−1 (Figure 5B) (Agarwal et al., 2021c). This caused the estimated value of GLOD to increase since the 353 cm−1 intensity was higher, while the cellulose I contribution at 380 cm−1 declined (Figure 5B). As mentioned earlier, in the presence of cellulose II, the GLOD data are not reliable. Similar is the case with the pure cellulose II sample (#11, Table 4), where a very high value of GLOD was obtained due to this sample being a highly crystalline cellulose II material.
The next set of samples consisted of NaOH-treated aspen holopulp that was freeze-dried, oven-dried, and treated with HCl (#5, #6, and #7; Table 4). Whereas the GLOD data were similar between the freeze-died and oven-dried samples, indicating that they did not change significantly with regard to the GLOD in their aggregated structures, on acid hydrolysis at 100°C for 6 h, there was considerable decline in the GLOD value. The decline is caused by the removal of the amorphous cellulose domains in the holopulp, which led to an increase at 380 cm−1 as the sample became more crystalline (Figure 5C). Removal of amorphous cellulose by acid treatment is a widely recognized phenomenon and is used in the production of crystalline cellulose (Spiliopoulos et al., 2021). The next sample set contains pure Avicel PH-101 and 10% xylan-containing Avicel PH-101, and their spectra are shown in Figure 5D. Here, no changes were detected in 250- to 450-cm−1 region of the spectra, and this supported the similar GLOD values of the two samples (#8, #9; Table 4). In the normalized spectra, identical contributions at 350 and 380 cm−1 are expected from the two samples because xylan is known to have no significant bands at these band positions (Agarwal and Ralph, 1997).
Finally, the spectral features of two highly crystalline cellulose I samples—cotton MCC (Whatman CC31) and tunicin, along with 100% crystalline cellulose II (Whatman CC31) are shown in Figure 5E. As expected, the ratio values are similar between the two cellulose I samples (9.6 and 9.4; Table 4). In contrast, for cellulose II, the ratio is significantly higher (86.2; Table 4) due to the high intensity of the 355-cm−1 band in the Raman spectrum (Figure 5E). The origin of this intensity lies in the cellulose allomorph itself and not in amorphous cellulose because this sample was 100% crystalline.
Processability Parameter
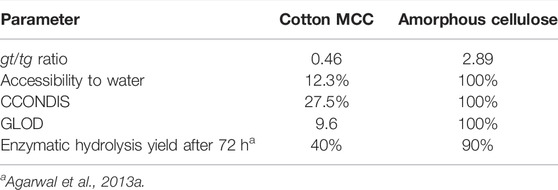
In future, it may be possible to relate the processability of a material with one or more of the Raman parameters discussed here. For example, in case of enzymatic hydrolyzability of cotton MCC (Whatman CC31) and amorphous cellulose, these parameters and the hydrolysis yields of these samples (Agarwal et al., 2013a) are listed in Table 5. The amount of cellulose that can be saccharified from the MCC (40%, Table 5) was significantly lower than the amount obtained from amorphous cellulose (90%, Table 5). Based on these limited data and the sample-associated Raman parameters, it appears that to improve saccharification, the cellulose materials should be processed such that the values of some of their Raman parameters are similar to those observed for amorphous cellulose (Table 5), which was highly hydrolyzable. The manner in which this can be accomplished ought to be the objective of future research. Only such investigations would reveal which of the four parameters, listed in Table 5 (gt/tg ratio, accessibility to water, CCONDIS, and GLOD), is actually important in the context of enzymatic hydrolysis.
Conclusion
As shown by the spectral analyses presented here, additional information on the aggregated state of cellulose can be obtained by Raman spectroscopy. Beyond crystallinity, such supramolecular state-related parameters consist of the gt-to-tg ratio (CH2OH conformation), accessibility to water, chain conformation disorder, and glycosidic linkage orientation disorder. As reported earlier, in case a sample consists of cellulose polymorphs other than cellulose I, they can also be detected and quantified (Agarwal, 2014; Agarwal et al., 2021c). Clearly, Raman spectroscopy is capable of playing an important role in the field of valorization of cellulose materials and therefore should be used more often in such endeavors.
Author Contributions
UA, the sole author of the manuscript, obtained some of the data and wrote the entire manuscript.
Conflict of Interest
The author declares that the research was conducted in the absence of any commercial or financial relationships that could be construed as a potential conflict of interest.
Publisher’s Note
All claims expressed in this article are solely those of the authors and do not necessarily represent those of their affiliated organizations, or those of the publisher, the editors, and the reviewers. Any product that may be evaluated in this article, or claim that may be made by its manufacturer, is not guaranteed or endorsed by the publisher.
Acknowledgments
The author acknowledges the help received from Sally Ralph in carrying out various experiments, obtaining some of the Raman spectra, and making combined versions of Figures 1, 3, 5.
References
Adar, F., Delhaye, M., and DaSilva, E. (2007). Evolution of Instrumentation for Detection of the Raman Effect as Driven by Available Technologies and by Developing Applications. J. Chem. Educ. 84, 50–60. doi:10.1021/ed084p50
Agarwal, U. P. (2014). 1064 Nm FT-Raman Spectroscopy for Investigations of Plant Cell walls and Other Biomass Materials. Front. Plant Sci. 5, 490. doi:10.3389/fpls.2014.00490
Agarwal, U. P. (2019). Analysis of Cellulose and Lignocellulose Materials by Raman Spectroscopy: A Review of the Current Status. Molecules 24, 1659. doi:10.3390/molecules24091659
Agarwal, U. P., Ralph, S. A., Baez, C., and Reiner, R. S. (2021a). Contributions of Crystalline and Noncrystalline Cellulose Can Occur in the Same Spectral Regions: Evidence Based on Raman and IR and its Implication for Crystallinity Measurements. Biomacromolecules 22, 1357–1373. doi:10.1021/acs.biomac.0c01389
Agarwal, U. P., Ralph, S. A., Baez, C., and Reiner, R. S. (2021c). Detection and Quantitation of Cellulose II by Raman Spectroscopy. Cellulose 28, 9069–9079. doi:10.1007/s10570-021-04124-x
Agarwal, U. P., Ralph, S. A., Baez, C., Reiner, R. S., and Verrill, S. P. (2017). Effect of Sample Moisture Content on XRD-Estimated Cellulose Crystallinity index and Crystallite Size. Cellulose 24, 1971–1984. doi:10.1007/s10570-017-1259-0
Agarwal, U. P., and Ralph, S. A. (1997). FT-Raman Spectroscopy of wood: Identifying Contributions of Lignin and Carbohydrate Polymers in the Spectrum of Black spruce (Picea Mariana). Appl. Spectrosc. 51, 1648–1655. doi:10.1366/0003702971939316
Agarwal, U. P., Ralph, S. A., Reiner, R. S., and Baez, C. (2018). New Cellulose Crystallinity Estimation Method that Differentiates between Organized and Crystalline Phases. Carbohydr. Polym. 190, 262–270. doi:10.1016/j.carbpol.2018.03.003
Agarwal, U. P., Ralph, S. A., Reiner, S. A., and Baez, C. (2016). Probing Crystallinity of Never-Dried Wood Cellulose With Raman Spectroscopy. Cellulose 23, 125–144.
Agarwal, U. P., Reiner, R. R., and Ralph, S. A. (2013b). Estimation of Cellulose Crystallinity of Lignocelluloses Using Near-IR FT-Raman Spectroscopy and Comparison of the Raman and Segal-WAXS Methods. J. Agric. Food Chem. 61 (1), 103–113. doi:10.1021/jf304465k
Agarwal, U. P., Reiner, R. S., Ralph, S. A., Catchmark, J., Chi, K., Foster, E. J., et al. (2021b). Characterization of the Supramolecular Structures of Cellulose Nanocrystals of Different Origins. Cellulose 28, 1369–1385. doi:10.1007/s10570-020-03590-z
Agarwal, U. P., Reiner, R. S., and Ralph, S. A. (2010). Cellulose I Crystallinity Determination Using FT-Raman Spectroscopy: Univariate and Multivariate Methods. Cellulose 17, 721–733. doi:10.1007/s10570-010-9420-z
Agarwal, U. P., Zhu, J. Y., and Ralph, S. A. (2013a). Enzymatic Hydrolysis of Loblolly pine: Effects of Cellulose Crystallinity and Delignification. Holzforschung 67, 371–377. doi:10.1515/hf-2012-0116
Aldaeus, F., Larsson, K., Srndovic, J. S., Kubat, M., Karlström, K., Peciulyte, A., et al. (2015). The Supramolecular Structure of Cellulose-Rich wood Pulps Can Be a Determinative Factor for Enzymatic Hydrolysability. Cellulose 22, 3991–4002. doi:10.1007/s10570-015-0766-0
Atalla, R. H., and Dimick, B. E. (1975). Raman-spectral Evidence for Differences between the Conformations of Cellulose I and Cellulose II. Carbohydr. Res. 39. Cl–C3. doi:10.1016/s0008-6215(00)82656-7
Baldwin, K. J., Batchelder, D. N., and Webster, S. (2002). “Raman Microscopy: Confocal and Scanning Near-Field,” in Handbook of Raman Spectroscopy. Editors I. R. Lewis, and H. G. Edwards (New York: Marcel Dekker), 145–190. Ch. 4.
Chundawat, S. P. S., Donohoe, B. S., da Costa Sousa, L., Elder, T., Agarwal, U. P., Lu, F., et al. (2011). Multi-scale Visualization and Characterization of Lignocellulosic Plant Cell wall Deconstruction during Thermochemical Pretreatment. Energy Environ. Sci. 4, 973–984. doi:10.1039/c0ee00574f
De Figueiredo, L. P., and Ferreira, F. F. (2014). The Rietveld Method as a Tool to Quantify the Amorphous Amount of Microcrystalline Cellulose. J. Pharm. Sci. 103, 1394–1399. doi:10.1002/jps.23909
Edwards, H. G. M., Farwell, D. W., and Webster, D. (1997). FT Raman Microscopy of Untreated Natural Plant Fibres. Spectrochimica Acta A: Mol. Biomol. Spectrosc. 53, 2383–2392. doi:10.1016/s1386-1425(97)00178-9
Fan, L. T., Lee, Y.-H., and Beardmore, D. H. (1980). Mechanism of the Enzymatic Hydrolysis of Cellulose: Effects of Major Structural Features of Cellulose on Enzymatic Hydrolysis. Biotechnol. Bioeng. 22, 177–199. doi:10.1002/bit.260220113
Foston, M., Hubbell, C. A., Samuel, R., Jung, S., Fan, H., Ding, S.-Y., et al. (2011). Chemical, Ultrastructural and Supramolecular Analysis of Tension wood in Populus Tremula X alba as a Model Substrate for Reduced Recalcitrance. Energ. Environ. Sci. 4, 4962–4971. doi:10.1039/c1ee02073k
Gao, J., Jebrane, M., Terziev, N., and Daniel, G. (2021). Enzymatic Hydrolysis of the Gelatinous Layer in Tension wood of Salix Varieties as a Measure of Accessible Cellulose for Biofuels. Biotechnol. Biofuels 14, 141. doi:10.1186/s13068-021-01983-1
Gierlinger, N., Goswami, L., Schmidt, M., Burgert, I., Coutand, C., Rogge, T., et al. (2008). In Situ FT-IR Microscopic Study on Enzymatic Treatment of poplar wood Cross-Sections. Biomacromolecules 9, 2194–2201. doi:10.1021/bm800300b
Himmel, M. E., and Picataggio, S. K. (2008). “Our challenge Is to Acquire Deeper Understanding of Biomass Recalcitrance and Conversion,” in Biomass Recalcitrance. Editor M. E. Himmel (Oxford, United Kingdom: Blackwell Publishing Lt.), 1–6.
Huber, G. W., Iborra, S., and Corma, A. (2006). Synthesis of Transportation Fuels from Biomass: Chemistry, Catalysts, and Engineering. Chem. Rev. 106, 4044–4098. doi:10.1021/cr068360d
Ibbett, R., Gaddipati, S., Hill, S., and Tucker, G. (2013). Structural Reorganisation of Cellulose Fibrils in Hydrothermally Deconstructed Lignocellulosic Biomass and Relationships with Enzyme Digestibility. Biotechnol. Biofuels 6, 33. doi:10.1186/1754-6834-6-33
Jeoh, T., Ishizawa, C. I., Davis, M. F., Himmel, M. E., Adney, W. S., and Johnson, D. K. (2007). Cellulase Digestibility of Pretreated Biomass Is Limited by Cellulose Accessibility. Biotechnol. Bioeng. 98, 112–122. doi:10.1002/bit.21408
Johnson, D. K., and Elander, R. T. (2008). “Pretreatments for Enhanced Digestibility of Feedstocks,” in Biomass Recalcitrance. Editor M. E. Himmel (Oxford, United Kingdom: Blackwell Publishing Lt.), 436–453.
Leu, S.-Y., and Zhu, J. Y. (2013). Substrate-related Factors Affecting Enzymatic Saccharification of Lignocelluloses: Our Recent Understanding. Bioenerg. Res. 6 (2), 405–415. doi:10.1007/s12155-012-9276-1
Ling, Z., Wang, T., Makarem, M., Santiago Cintrón, M., Cheng, H. N., Kang, X., et al. (2019). Effects of ball Milling on the Structure of Cotton Cellulose. Cellulose 26, 305–328. doi:10.1007/s10570-018-02230-x
Maddams, W. F. (1980). The Scope and Limitations of Curve Fitting. Appl. Spectrosc. 34, 245–267. doi:10.1366/0003702804730312
Mosier, N., Wyman, C., Dale, B., Elander, R., Lee, Y. Y., Holtzapple, M., et al. (2005). Features of Promising Technologies for Pretreatment of Lignocellulosic Biomass. Bioresour. Tech. 96, 673–686. doi:10.1016/j.biortech.2004.06.025
Ohmine, K., Ooshima, H., and Harano, Y. (1983). Kinetic Study on Enzymatic Hydrolysis of Cellulose by Cellulose fromTrichoderma Viride. Biotechnol. Bioeng. 25, 2041–2053. doi:10.1002/bit.260250813
Park, S., Baker, J. O., Himmel, M. E., Parilla, P. A., and Johnson, D. K. (2010). Cellulose Crystallinity index: Measurement Techniques and Their Impact on Interpreting Cellulase Performance. Biotechnol. Biofuels 3, 10. doi:10.1186/1754-6834-3-10
Park, S., Johnson, D. K., Ishizawa, C. I., Parilla, P. A., and Davis, M. F. (2009). Measuring the Crystallinity index of Cellulose by Solid State 13C Nuclear Magnetic Resonance. Cellulose 16, 641–647. doi:10.1007/s10570-009-9321-1
Parrott, E. P. J., and Zeitler, J. A. (2015). Terahertz Time-Domain and Low-Frequency Raman Spectroscopy of Organic Materials. Appl. Spectrosc. 69, 1–25. doi:10.1366/14-07707
Peciulyte, A., Karlström, K., Larsson, P. T., and Olsson, L. (2015). Impact of the Supramolecular Structure of Cellulose on the Efficiency of Enzymatic Hydrolysis. Biotechnol. Biofuels 8, 56. doi:10.1186/s13068-015-0236-9
Rollin, J. A., Zhu, Z., Sathitsuksanoh, N., and Zhang, Y.-H. P. (2010). Increasing Cellulose Accessibility Is More Important Than Removing Lignin: A Comparison of Cellulose Solvent-Based Lignocellulose Fractionation and Soaking in Aqueous Ammonia. Biotechnol. Bioeng. 108, 22–30. doi:10.1002/bit.22919
Schenzel, K., Fischer, S., and Brendler, E. (2005). New Method for Determining the Degree of Cellulose I Crystallinity by Means of FT Raman Spectroscopy. Cellulose 12, 1971–1924. doi:10.1007/s10570-004-3885-6
Spiliopoulos, P., Spirk, S., Pääkkönen, T., Viljanen, M., Svedström, K., Pitkänen, L., et al. (2021). Visualizing Degradation of Cellulose Nanofibers by Acid Hydrolysis. Biomacromolecules 22, 1399–1405. doi:10.1021/acs.biomac.0c01625
Vieira, F. S., and Pasquini, C. (2014). Determination of Cellulose Crystallinity by Terahertz-Time Domain Spectroscopy. Anal. Chem. 86, 3780–3786. doi:10.1021/ac4035746
Wang, H., Horikawa, Y., Tsuchikawa, S., and Inagaki, T. (2020). Terahertz Time-Domain Spectroscopy as a Novel Tool for Crystallographic Analysis in Cellulose. Cellulose 27, 9767–9777. doi:10.1007/s10570-020-03508-9
Wang, H., Tsuchikawa, S., and Inagaki, T. (2021). Terahertz Time-Domain Spectroscopy as a Novel Tool for Crystallographic Analysis in Cellulose: The Potentiality of Being a New Standard for Evaluating Crystallinity. Cellulose 28, 5293–5304. doi:10.1007/s10570-021-03902-x
Wickholm, K., Larsson, P. T., and Iversen, T. (1998). Assignment of Non-crystalline Forms in Cellulose I by CP/MAS 13C NMR Spectroscopy. Carbohydr. Res. 312, 123–129. doi:10.1016/s0008-6215(98)00236-5
Wiley, J. H., and Atalla, R. H. (1987). Band Assignments in the Raman Spectra of Celluloses. Carbohydr. Res. 160, 113–129. doi:10.1016/0008-6215(87)80306-3
Yu, Y., Wu, J., Ren, X., Lau, A., Rezaei, H., Takada, M., et al. (2022). Steam Explosion of Lignocellulosic Biomass for Multiple Advanced Bioenergy Processes: A Review. Renew. Sustain. Energ. Rev. 154, 111871. doi:10.1016/j.rser.2021.111871
Zhou, Z., Lei, F., Li, P., and Jiang, J. (2018). Lignocellulosic Biomass to Biofuels and Biochemicals: A Comprehensive Review with a Focus on Ethanol Organosolv Pretreatment Technology. Biotechnol. Bioeng. 115, 2683–2702. doi:10.1002/bit.26788
Keywords: cellulose, crystallinity, lignocellulose, biofuels, bio-based economy, supramolecular structure
Citation: Agarwal UP (2022) Beyond Crystallinity: Using Raman Spectroscopic Methods to Further Define Aggregated/Supramolecular Structure of Cellulose. Front. Energy Res. 10:857621. doi: 10.3389/fenrg.2022.857621
Received: 18 January 2022; Accepted: 15 March 2022;
Published: 11 April 2022.
Edited by:
Jia-Long Wen, Beijing Forestry University, ChinaReviewed by:
Yunqiao Pu, Oak Ridge National Laboratory (DOE), United StatesSamarthya Bhagia, Oak Ridge National Laboratory, United States
Copyright © 2022 Agarwal. This is an open-access article distributed under the terms of the Creative Commons Attribution License (CC BY). The use, distribution or reproduction in other forums is permitted, provided the original author(s) and the copyright owner(s) are credited and that the original publication in this journal is cited, in accordance with accepted academic practice. No use, distribution or reproduction is permitted which does not comply with these terms.
*Correspondence: Umesh P. Agarwal, dW1lc2gucC5hZ2Fyd2FsQHVzZGEuZ292
 Umesh P. Agarwal