 Jaswant Singh
 S. P. Singh
 K. S. Verma2
- 1Department of Electrical Engineering, Rajkiya Engineering College, Ambedkar Nagar, India
- 2Department of Electrical Engineering, Kamla Nehru Institute of Technology, Sultanpur, India
- 3Department of ICE, Netaji Subhas University of Technology, New Delhi, India
The electrical energy generated from solar energy photovoltaic (PV) technology is intermittent, varying, and irregular. With PV technology’s limited energy conversion efficiency, it is imperative to extract the maximum of converted energy. The zero slopes of the power versus voltage curve are utilized to determine the maximum power point. Conventional algorithms provide lower convergence time along with low power oscillations. This paper proposes an adaptive perturb and observe (A-P&O) maximum power point tracking (MPPT) technique for the energy conversion system. The primary objectives of the proposed technique are to obtain a more robust, better tracking capability, improved efficiency, and fast response lesser oscillations under steady-state with a simple structure to implement. Maximum power point (MPP) tracking under varying meteorological conditions and load variations is still a challenge. The proposed P&O technique has been tested under realistic meteorological variations and load variations. The comparative evaluation of the proposed adaptive-step size A-P&O MPPT technique and other conventional techniques such as perturb and observe (P&O), incremental conductance (IC), modified P&O and fuzzy logic control (FLC) have also been performed. The performance of the proposed control technique is evaluated using a MATLAB/Simulink environment. The obtained results confirm that the proposed control technique is superior in performance as compared to the other four conventional techniques.
1 Introduction
In recent years, due to the increasing demand for electricity in the domestic and industrial sectors, almost every country is struggling with an energy deficit. Consequently, continuous expansion of conventional energy generation systems to meet the demand is happening, increasing the threat to the environment in terms of carbon footprints. In addition; raw material used in conventional methods is exhausting at a rapid rate (Jiayi et al., 2008). Due to this, researchers are looking for alternate energy sources which are renewable and have a clean process of energy generation. Currently, renewable energy sources such as solar energy, wind energy, fuel cell, biogas, geothermal, and micro-turbine are prominent excerpts in the generation of electricity. The solar energy hypothesis is one of the most important sources of the future energy mix. Also, due to recent research and developments in the field of power electronics have made solar energy more feasible for domestic and industrial applications (Dolara et al., 2009).
Systems utilizing solar energy can be classified as solar thermal systems and solar PV systems. However, photovoltaic (PV) power is most promising and beneficial because of its easy installation, pollution-free, clean with low-cost, long life, noiseless, and required low maintenance. Also, the PV market is showing a steady and sustained evolvement, all over the world with rapid cost reduction and increased efficiency in technology (Mekhilef et al., 2011). However, the overall power conversion efficiency of these PV cells is low (35–40% approximately). Furthermore, exploitation of the generated energy by these PV cells is strongly affected by loading conditions. Therefore, researchers are simultaneously exploring solutions to increase power conversion efficiency and extract maximum power through the MPPT techniques. Typically, the available power from the PV array depends on irradiance level and ambient temperature whereas extracted power is dependent on loading conditions. Because of the non-linear relationship between cell voltage and current, the power available for extraction will be maximum at a certain operating point only. Furthermore, MPP varies with the variation in operating conditions of the PV system (Li, 2019; Reza Reisi et al., 2013). Therefore, it is imperative to use maximum power point tracking techniques (MPPT) to extract the maximum available power in every operating condition (Hlaili and Mechergui, 2016).
Over the past decade, several reports and research articles have achieved enhanced energy conversion efficiency in PV technology using different MPPT techniques. These MPPT techniques can be divided into three types: conventional, artificial-intelligence (AI), and hybrid-based techniques. Constant voltage control (CVC) (Kumar et al., 2014; Derbeli et al., 2021), Hill-Climbing (Jordehi, 2016; Amir et al., 2017; Pavithra et al., 2021), Perturb & Observe (P&O) (Esram and Chapman, 2007; Yilmaz et al., 2019; Mousa et al., 2021), Sliding Mode Control (SMC) based MPPT technique (Ahmed and Salam, 2016), Incremental Conductance (IC) (Li and Wang, 2009; Kumar et al., 2014; Mamarelis et al., 2014; Bendib et al., 2015), incremental resistance (IR) based MPPT (Chauhan et al., 2020), and fractional voltage/current (Elbaset et al., 2015) are conventional techniques having less complex behavior and are easy to implement. Among these, P&O and IC algorithms are more prevalent. Second category algorithms use soft computing or artificial-intelligence (AI) based techniques namely: fuzzy logic controller (FLC) based MPPT (Saravanan and Ramesh Babu, 2016), artificial neural network (ANN) MPPT (Kottas et al., 2006), adaptive neuro-fuzzy inference system (ANFIS) based MPPT (Ben Salah and Ouali, 2011; Amara et al., 2018), particle swarm optimization (PSO) based MPPT (Algarín et al., 2017; Aouchiche et al., 2018; Wang et al., 2018) technique and evolutionary algorithms (EA) based MPPT. These intelligent techniques are suited for efficient operation in more dynamic environments to produce output with lesser steady-state oscillations, but they are more sophisticated as compared to conventional techniques requiring more resources for effective realization. In addition, several hybrid MPPT techniques using combinations of conventional/Artificial-Intelligence (AI)/modification of conventional techniques have also been introduced to deal with dynamic and partial-shading conditions. Some of the combinations for hybrid controllers are modified P&O (Esram and Chapman, 2007; Bayrak and Ghaderi, 2019), PI-FLC based MPPT (Saravanan and Ramesh Babu, 2016; Eltamaly and Farh, 2019), and Neural-fuzzy logic (N-FL) based technique (Loukil et al., 2020). However, these MPPT techniques are immensely complex and expensive as compared to conventional techniques.
P&O control technique is widely used as it can be implemented with low-cost microprocessors, simple, and robust. However, the three main drawbacks of this technique: large steady-state oscillation, slow tracking response, and dependency of step dimension, make it less suited under rapidly varying meteorological conditions. Whereas, overcoming the limitations through improvement or modification in the P&O MPPT technique (Bayrak and Ghaderi, 2019) increases the complexity.
A rapid and variable step-size P&O technique that eliminates large fluctuations and slow tracking response of the conventional version. Simulations results are validated through MATLAB/Simulink model which indicates reduced steady-state oscillations, improved efficiency, and optimal power extraction. The detailed performance analysis is conducted in comparison with conventional MPPT control techniques such as P&O (Esram and Chapman, 2007), IC (Li and Wang, 2009), MP&O (Bayrak and Ghaderi, 2019), and FLC (Saravanan and Ramesh Babu, 2016) techniques, respectively. A white-box mathematical model has been developed using fundamental principles of PV physics and the system developed is incorporated using a boost converter (Mekhilef et al., 2011) with a suitable duty cycle as shown in Figure 1.
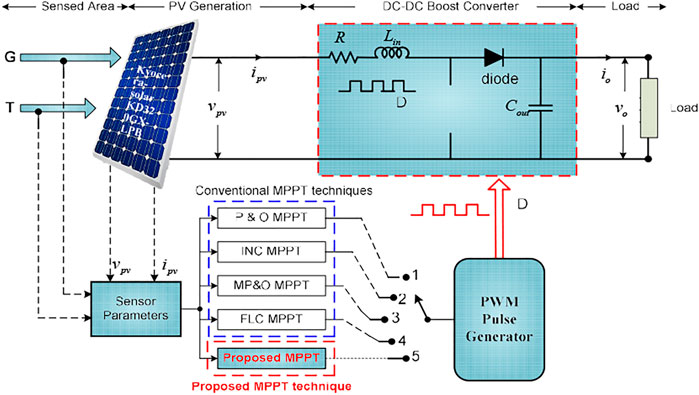
FIGURE 1. Schematic diagram of PV energy conversion system with various MPPT techniques.
Significant contributions of this paper are as follows:
• The developed MPPT technique is implemented and validated to extract maximum power under varying meteorological conditions and load variations.
• The performance of a PV-connected boost converter using the proposed MPPT technique gives reduced steady-state oscillation, improved efficiency, extract optimal power, and fast-tracking response.
• The proposed technique is compared with conventional techniques available in literature such as perturb and observed (P&O), incremental conductance (IC), modified P&O, and fuzzy logic control (FLC).
This paper is systematically organized as follows: Section 2 explains an overall system configuration and mathematical model of the PV system (i.e., PV array, electrical characteristics, boost converter) in detail. Section 3 describes the comparison between the conventional and the proposed MPPT techniques. In Section 4, the performance investigation of the proposed MPPT and four traditional MPPT techniques are verified via simulation test results and a comparative study has been presented. Finally, concluding remarks are given in Section 5.
2 System Configuration and Modeling
The system under consideration consists of the following components: PV array; MPPT; boost-converter; and electric load (battery, resistive, inverter, etc.,). The arrangement of the different components is depicted in Figure 1, which consists of a PV array, a boost converter, and an MPPT controller. The parameters and ratings of the PV panel and the boost converter are given in Table 1 and Table 2, respectively.
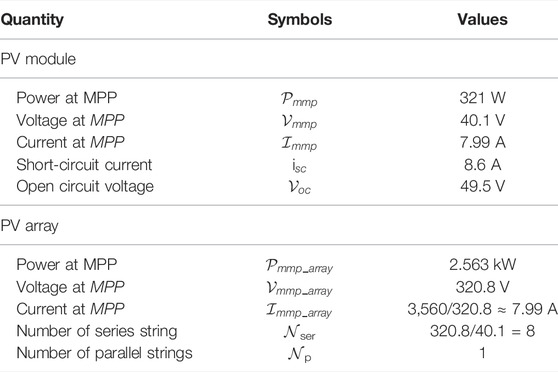
TABLE 1. Specification parameters of Kyocera-solar KD320GX-LPB PV module and array.
TABLE 2. The specification of electrical parameters for the boost converter.
2.1 Solar PV Cell
2.1.1 Mathematical Modeling of PV Cell
The basic equivalent-circuit model of a solar PV cell is depicted in Figure 2. The exclusive goal of modeling PV cell using a one-diode represented here is to mimic the characteristics and performance of PV cells under irregular climate conditions (Pavithra et al., 2021).

FIGURE 2. One-diode model-based equivalent circuit of PV cell.
The mathematical expression for solar photovoltaic cell output current can be given as:
where;
In a solar PV cell, the diode current
from (Eq. 1) and (Eq. 2), the net PV current can be expressed as:
where;
Furthermore, photocurrent
where,
where Eg is the semiconductor energy bandgap,
where
2.1.2 Influence of P-V and I-V Characteristics for PV Module at STC
According to standard test conditions, the irradiance and the temperature should be 1000 W/m2 and 25°C, respectively. A commercially available Kyocera solar PV cell (KD320GX-LPB) is chosen for this study. Power-Voltage (P-V) and Current-Voltage (I-V) characteristics for different irradiance and temperature (TSTC = 20°C to 60°C and G = 400 W/m2 to 1000 W/m2) are depicted in Figures 3A,B.
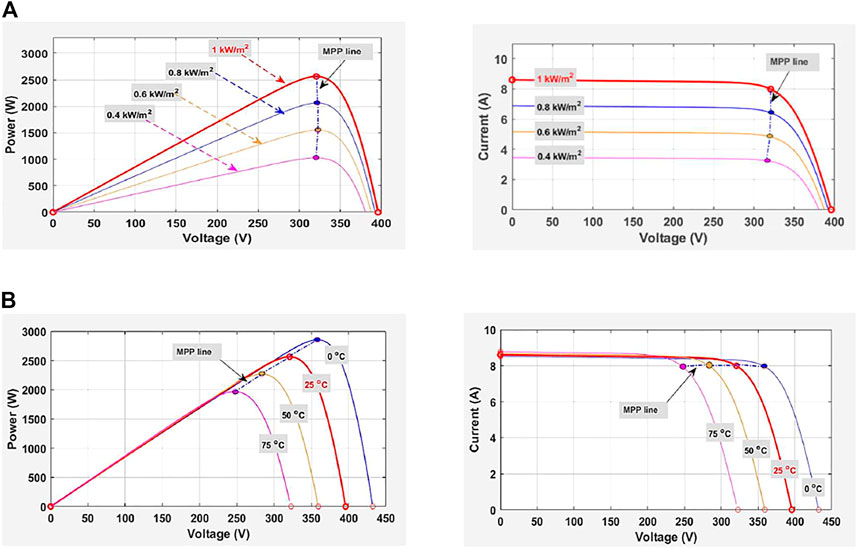
FIGURE 3. P-V and I-V characteristics for PV module Kyocera solar KD320GX-LPB under (A) for varying irradiance (W/m2) and (B) for varying temperature (°C).
As evident from Figure 3, the increase in irradiance, increases the generated power, whereas a rise in the temperature reduces it. The maximum output power
2.2 Modeling of dc/dc Boost Converter
The boost converter is a power electronic device that converts the average value of the voltage (or current) from a low level to a higher level, regulated by varying the duty cycle “D” at a high switching frequency (Mousa et al., 2021). Such a converter is one of the most extensively used non-isolated dc-dc converters in PV systems for tracking the MPP as it has many features such as high efficiency, robustness, and simple structure. The equivalent circuit topology of boost converter for both on and off switching modes in continuous mode of operation is shown in Figure 4.
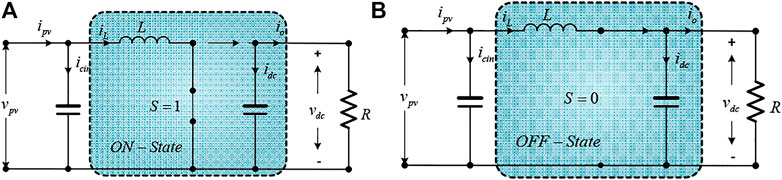
FIGURE 4. Equivalent circuit diagram of boost converter topology: (A) On-state, and (B) Off-state.
The mathematical modeling of a boost converter in a continuous mode of conduction state can be expressed by Eq. 9. For ON time state:
where
at OFF time state: when the s = 0, the simplified circuit can be represented by the state equations which are as follows:
in the state-space, the equation is:
from the state-space matrices in Eqs. 10–12 are obtained as:
from the above state-space model of the T.F. is V0(s)/d(s):
where
3 Proposed MPPT Control Technique
An MPPT technique is a very vital part of any solar PV system. It is employed to extract maximum power under varying meteorological conditions such as ambient temperature, irradiance, and partial shading conditions. In this paper, the performance of the conventional MPPT techniques is compared to the proposed modified perturb & observe (P&O) MPPT. A schematic of the test setup for the proposed as well as convenient technique consisting of 2.56 kW PV array is shown in Figure 1.
3.1 Conventional MPPT Control Techniques
3.1.1 Perturb and Observe (P&O) MPPT
The P&O technique is one of the simplest and most widely employed techniques for the control of power modulators in PV systems, because of its easy implementation in a low-cost system (Yilmaz et al., 2019). A conventional P&O algorithm can be installed with a perturbation mechanism to increase or decrease the reference voltage or current via a boost converter duty cycle
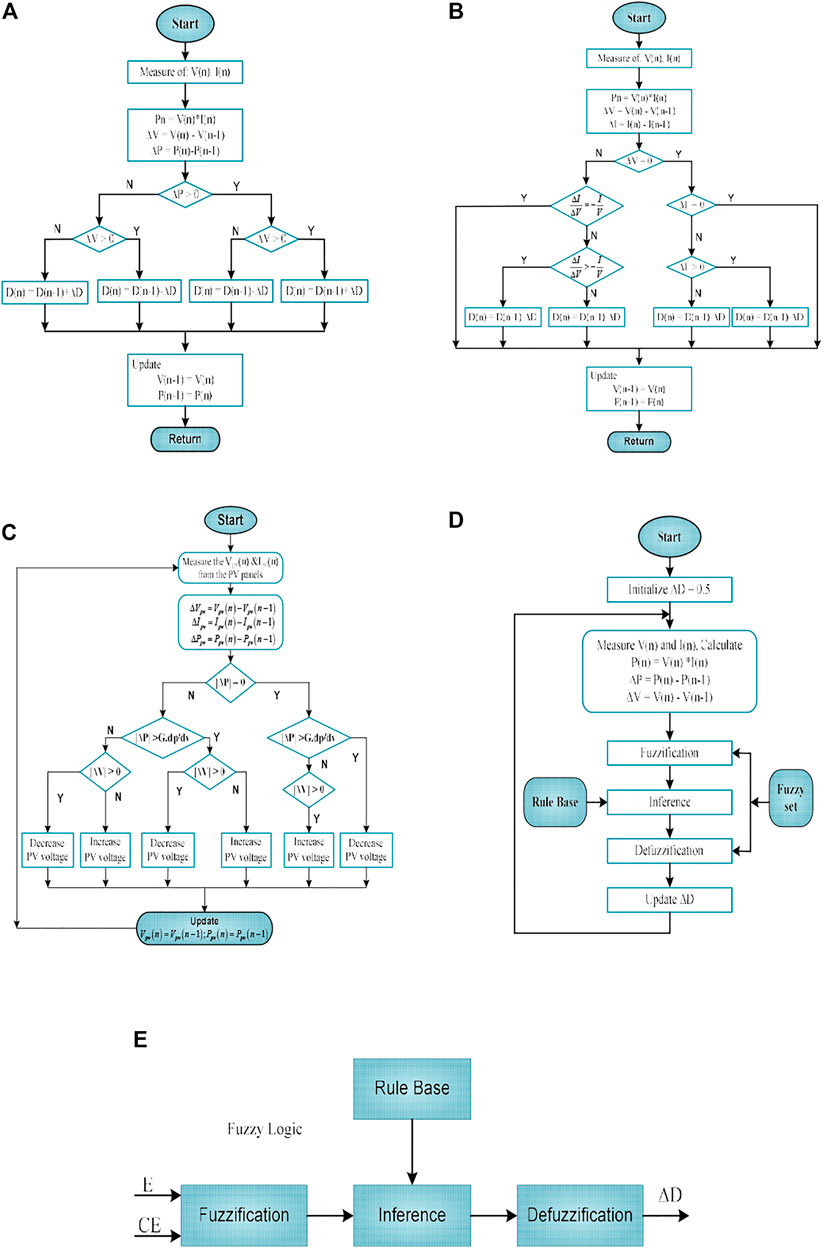
FIGURE 5. Flow-chart of the four conventional MPPT techniques (A) P&O (Esram and Chapman, 2007) (B) Inc Cond (Li and Wang, 2009) (C) MP&O (Bayrak and Ghaderi, 2019) (D) FLC based MPPT (Saravanan and Ramesh Babu, 2016). (E). Block diagram of FL-MPPT technique.
The conventional approach uses selected fixed step-size change in the duty cycle
3.1.2 Incremental Conductance (IC) MPPT
The incremental conductance control technology utilizes the information of the slope of the power curve, which will be zero at the MPP (Li and Wang, 2009). As depicted in Figure 5B, the derivative is positive on the left side, and negative on the right side of the MPP. The maximum output power available can be calculated as:
Differentiating Eq. 16 with respect to photovoltaic voltage, we get,
at MPP, as dppv/dvp = 0 at Eq. 17 become,
We define the change in instantaneous output conductance (G =
3.1.3 Modified Perturb and Observe (MP&O) MPPT
In this approach, the variable step size is considered in place of the fixed step size in the perturbation cycle. The conventional P&O technique is not capable to confer adequate response and tracking accuracy for both steady-state and dynamic conditions due to fixed step-size. If the step-size is kept large to achieve the rapid dynamic response, then the spacious oscillations around the MPP causing a loss of productive power will occur. Therefore, to overcome this drawback a modified P&O technique was proposed by (Safari and Mekhilef, 2011; Abo-Al-Ez et al., 2020; Jana et al., 2020). Figure 5C shows the flowchart of the modified P&O technique depicting the strategy. It is seen from the figure that when
3.1.4 Fuzzy Logic Controller (FLC) Based MPPT
Fuzzy logic is a soft computing (SC) technique (Saravanan and Ramesh Babu, 2016). It is among the most effective control techniques. It uses the concept of multiple rules and multiple variables ranging between entirely false and entirely true. It consists of an estimate that maps the input values to the output values derived from the IF-THEN rule. It effectively distributes with the non-linear I-V curve of the photovoltaic system which operated at a membership function instead of a mathematical module. FLC has fuzzification, inference-mechanism, defuzzification, and rule-based look-up table as main components. The flowchart of the FLC-based MPPT is depicted in Figure 5D. Moreover, FLC-based MPPTs usually have two inputs and one output, as shown in the Figure 5E. The input variables are error [E(n)] and change in error [CE(n)], which are computed as below.
where
The output variable usually changes with the change in duty ratio
The FLC output that is a change in duty ratio
Although the main drawbacks are that it operates at input and output membership functions instead of a mathematical model based on the experience and brief information about the operating system. Therefore, to overcome these shortcomings, we have proposed a novel MPPT technique, which is explained in Section 3.2.
3.2 Proposed Variable Step Efficient Modified P&O MPPT Technique
According to the available literature, conventional MPPT techniques described in Section 3.1 is not capable to confer fast response and accurate tracking around MPP. This is mainly due to fixed step-size perturbation. If the step-size is kept large to achieve the rapid dynamic response, then large oscillations around the MPP will increase causing a loss of output power. Therefore, to overcome these drawbacks, proposed a new variable step-size of efficient modified P&O (EM-PO) MPPT technique is used to eliminate these problems. According to research gaps, a novel MPPT technique is proposed in this paper, whose operation could be depicted as follows: if the variable power
where
where
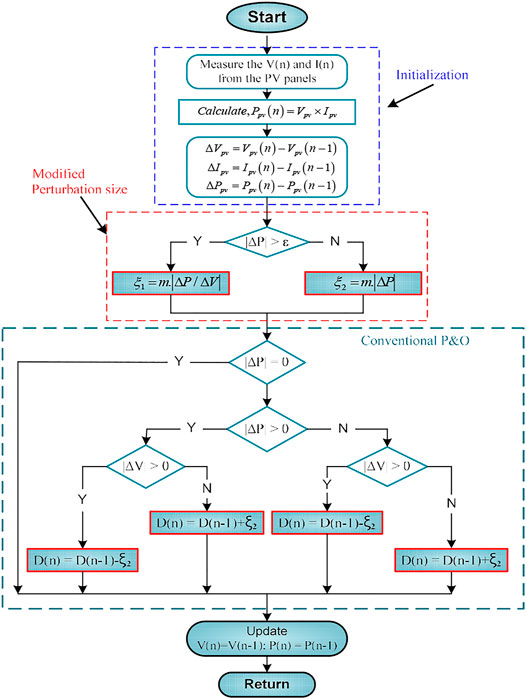
FIGURE 6. Flowchart of the proposed variable step MPPT technique.
here,
where the predefined value of
The effective power
3.2.1 Control Strategy of Proposed Technique
The overall performance of proposed the new MPPT technique A- P&O is designed using the following steps:
• Step-1: Measuring initialize of
• Step 2: To calculate the
• Step 3: If the variable power
• Step 4: If the variable power
• Step 5: Update the best individual solution envisaged by each
4 Results and Discussions
In order to conduct a performance analysis of the proposed adaptive A-P&O MPPT technique a 2.56 kW PV energy conversion system as depicted in Figure 1 is considered. Performance is also compared with P&O, Inc Cond, modified P&O, and FLC MPPT techniques. The simulation results are validated in MATLAB/Simulink using a personal computer with an IntelR CoreTM i7 CPU at 2.2 GHz and 8 GB of RAM. The following three scenarios of operating conditions have been considered for the investigation:
• Scenario-I: Varying irradiance at a fixed temperature.
• Scenario-II: Varying temperature at fixed irradiance.
• Scenario-III: Varying load at standard test condition.
4.1 Scenario-I: Varying Irradiance at Constant Temperature
In this scenario, the performance investigation of the proposed MPPT technique is performed under dynamic behavior such as varying irradiance at constant ambient temperature TSTC = 25°C and fixed RLoad at 97.55 Ω, respectively. The simulation results are verified at varying irradiance of four levels (or stages) of S11, S12, S13, and S14. Figure 7 illustrates the variation pattern of irradiance with a sudden change in levels from S11 is 1000 W/m2 to 750 W/m2 during trs11 = 0–0.8 s; S12 is 750 W/m2 to 500 W/m2 during trs12 = 0.8–1.5 s; S13 is 500 W/m2 to 1000 W/m2 during trs13 = 1.5 s to 3.0 s; and S14 reporting to its previous level, i.e., 1000 W/m2 during trs14 = 3.0–4.0 s, respectively. Theoretical values of maximum power obtainable on S11, S12, S13, and S14 are 2.56, 1.94, 1.28, and 2.56 kW, respectively.
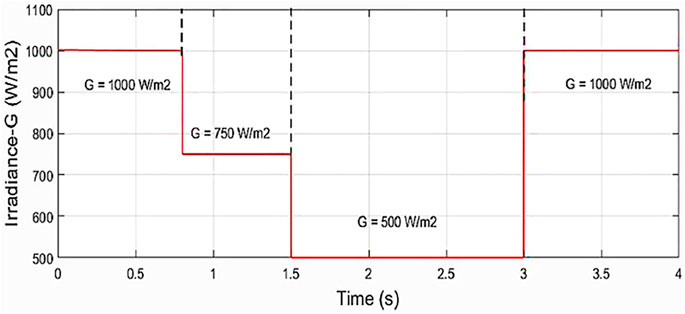
FIGURE 7. Irradiance pattern for Scenario-I.
During this scenario, power, voltage and load current behavior obtained for different MPPT techniques are illustrated in Figure 8. It is evident from the results that the proposed control technique gives the least oscillations around MPP with fast-tracking response, less power ripples, and effectively improved efficiency that is better than the other four conventional MPPT techniques.
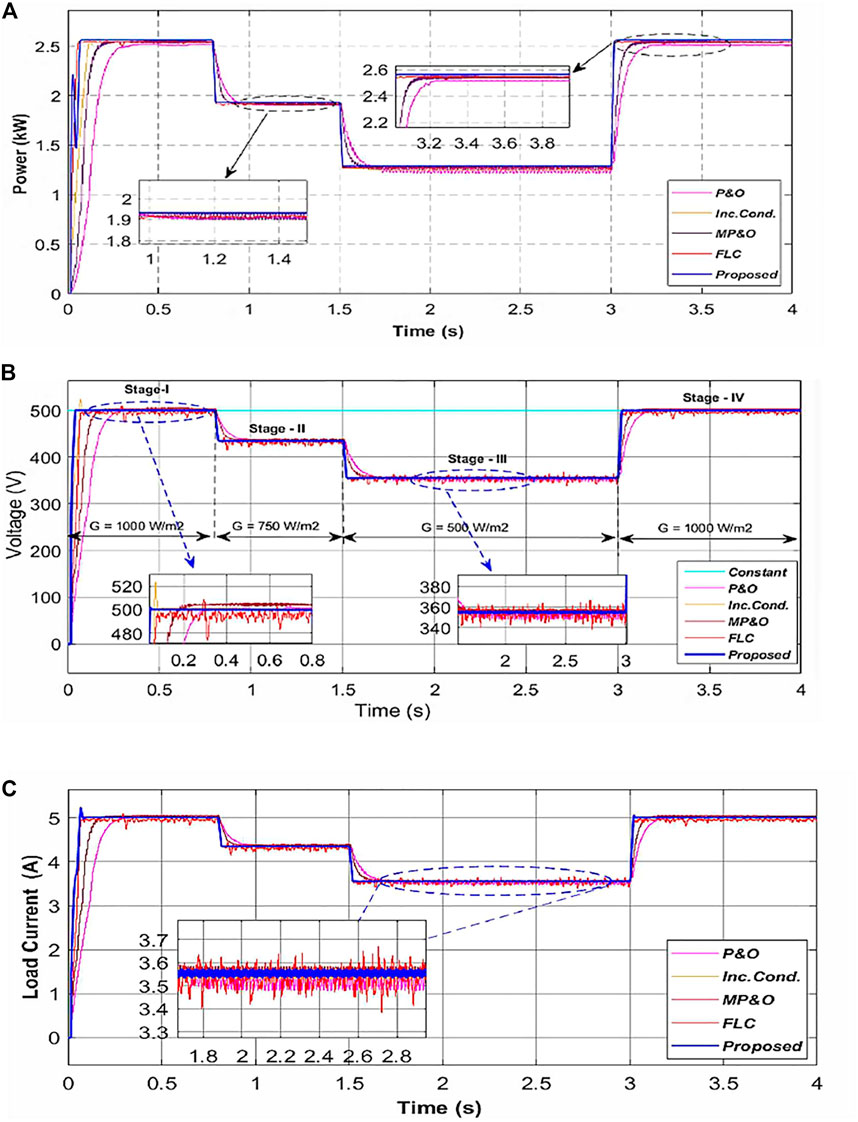
FIGURE 8. Responses under Scenario-I: (A) Output power P0 (B) output voltage, V0 and (C) load current, I0.
Output power obtained, response time, and efficiency under steady-state with different MPPT techniques are tabulated in Table 3. Output power of P0_S11 = 2.55 kW with output voltage V0_S11 = 501.5 V and load current I0_S11 = 5.09 Amp is achieved with rise time trS11 = 39.9 m-sec. It is evident from the results obtained that for all variable irradiance stages S12, S13, and S14, the proposed MPPT technique also gives better performance compared with the other four conventional techniques which are depicted clearly in Table 3.
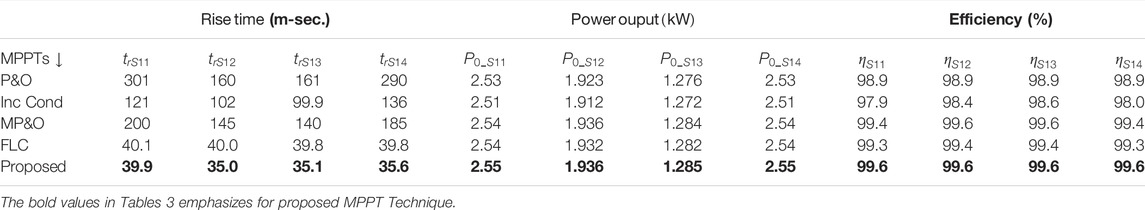
TABLE 3. Performance comparison analysis of simulation results validated under scenario-I.
4.2 Scenario-II: Varying Temperature at Constant Irradiance
In this scenario, the performance investigation of proposed MPPT technique is performed under the dynamic behavior such as varying temperature at constant irradiance for GSTC = 1000 W/m2 and fixed RLoad = 97.55 Ω, respectively. The simulation results are verified at varying irradiance of four levels (or stages) of S21, S22, S23, and S24. Figure 9 illustrates that the tracking accuracy of the system under varying temperatures with sudden change levels from S21 is 20°C to 50°C during trs21 = 0 s to 0.8 s; S22 is 50°C to 30°C during trs22 = 0.8–1.5 s; S23 is 30°C to 40°C during trs23 = 1.5 s to 2.5 s; and S24 reporting to its previous level, i.e., 40°C during trs24 = 2.5 s to 4.0 s, respectively. The theoretical value of maximum power obtainable on S21, S22, S23, and S24 are 2.62, 2.26, 2.50, and 2.38 kW, respectively.
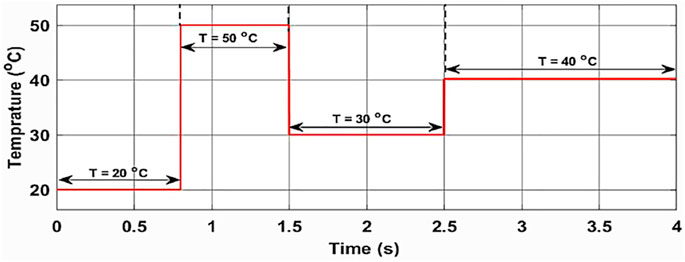
FIGURE 9. Temperature pattern for Scenario-II.
During this scenario, all the levels of power, voltage and load current are tracked successfully using a boost converter for variable scaling factors as shown in Figure 9 and Figures 10A–C. The proposed control technique gives the least oscillations around MPP with fast-tracking response, less power, ripples, and effective improved efficiency are better than the other four conventional MPPT techniques as shown in Table 4. Accordingly, Figure 10A, Figure 10B, Figure 10C and Table 4 illustrates that the proposed control technique (blue) gives output power (P0_S21) = 2.612 kW, output voltage (V0_S21) = 508.5 V and load current (I0_S21) = 5.12 Amp settled at trS21 = 39.1 m-sec as compared with other four conventional P&O (pink); Inc Cond (yellow); MP&O (brown) and FLC (red) based MPPT techniques, respectively. That is approximately identical to ideal values Pm_s21 in PV array operated at temperature S21 = 20°C, more detailed as depicted in Table 6. Similarly, for all variable temperature stages S22, S23, and S24, the proposed MPPT technique also gives better performance as compared to the other four conventional techniques which are depicted clearly in Table 4.
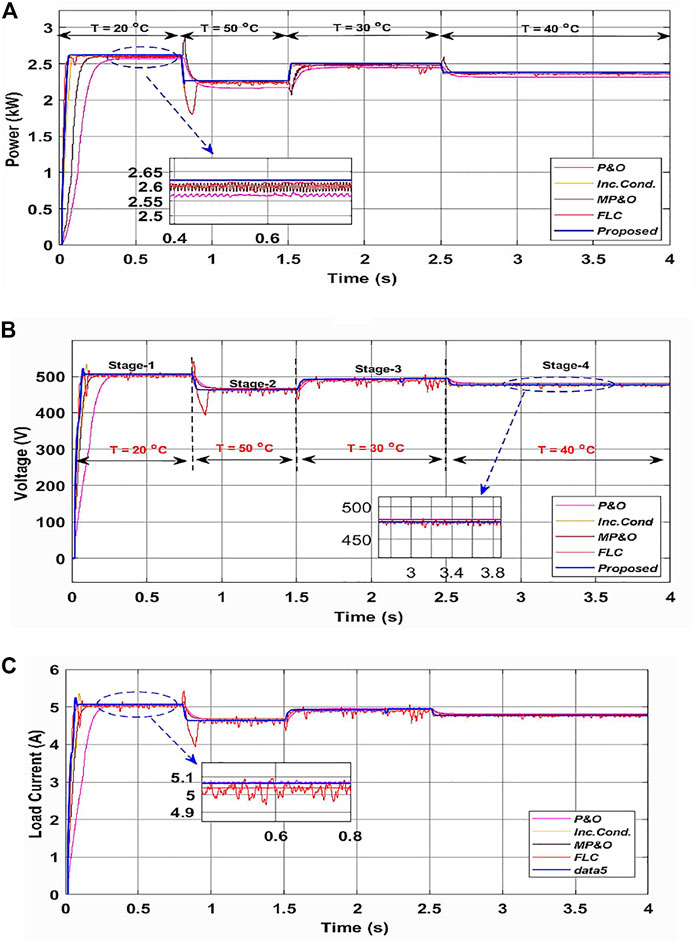
FIGURE 10. Responses under Scenario-II: (A) Output power, P0 (B) output voltage, V0 and (C) output current, I0.
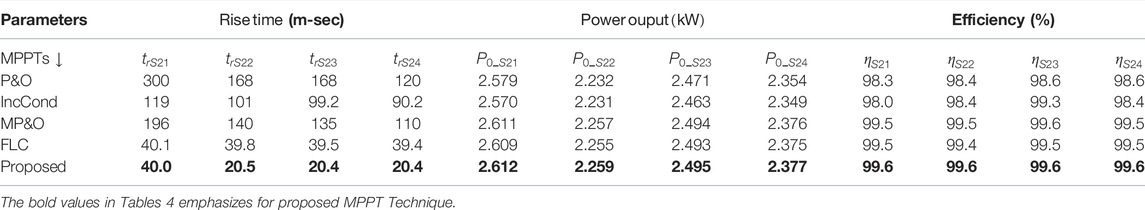
TABLE 4. Performance comparison analysis of simulation results validated under scenario-II.
4.3 Scenario-III: Varying Load at Standard Test Condition
In this scenario, the performance comparison analysis of proposed MPPT technique is performed under dynamic behavior such as varying load at constant irradiance, GSTC is 1000 W/m2 and constant TSTC is 25°C, respectively. The simulation results are verified at varying load resistance of four levels (or stages) of S31, S32, S33, and S44. Similarly, Figure 11 illustrates the tracking accuracy of the system under varying resistive load with sudden change levels from S31 = 80 Ω during trs31 = 0 s to 1.0 s; S32 = 100 Ω during trs32 = 1.0 s to 2.0 s; S33 = 75 Ω during trs33 = 2.0–3.0 s; and S34 reporting to its previous level i.e., 90 Ω during trs34 = 3.0–4.0 s, respectively. The theoretical value of maximum power obtainable on S31, S32, S33, and S34 is 2.56 kW.
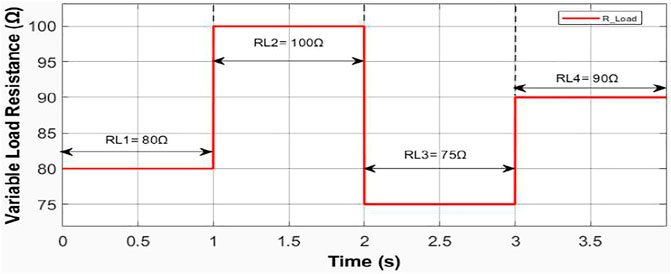
FIGURE 11. Load variations pattern for Scenario-III.
During this scenario, all the levels of power, voltage, and load current are tracked successfully by employing a boost converter for variable scaling factors as shown in Figures 12A–C. Accordingly, Figure 12A, Figure 12B, Figure 12C and Table 5 illustrates that the proposed control technique (blue) gives output power P0_S31 = 2.553 kW, output voltage V0_S31 = 451.4 V and load current I0_S31 = 5.67 Amp settled at trS31 = 39.9 m-sec as compared with other four conventional P&O (pink); Inc Cond (yellow); MP&O (brown) and FLC (red) based MPPT techniques, approximately identical to ideal values Pm_s31 in PV array operated at load resistance S31 = 80 Ω. Similarly, for all load resistance stages S32, S33, and S34, the proposed MPPT technique gives better performance as compared with the other four conventional techniques which are depicted clearly in Table 5.
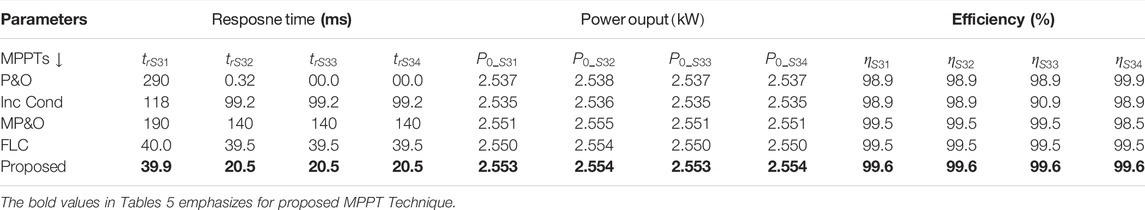
TABLE 5. Performance comparison analysis of simulation results validated under scenario-III.
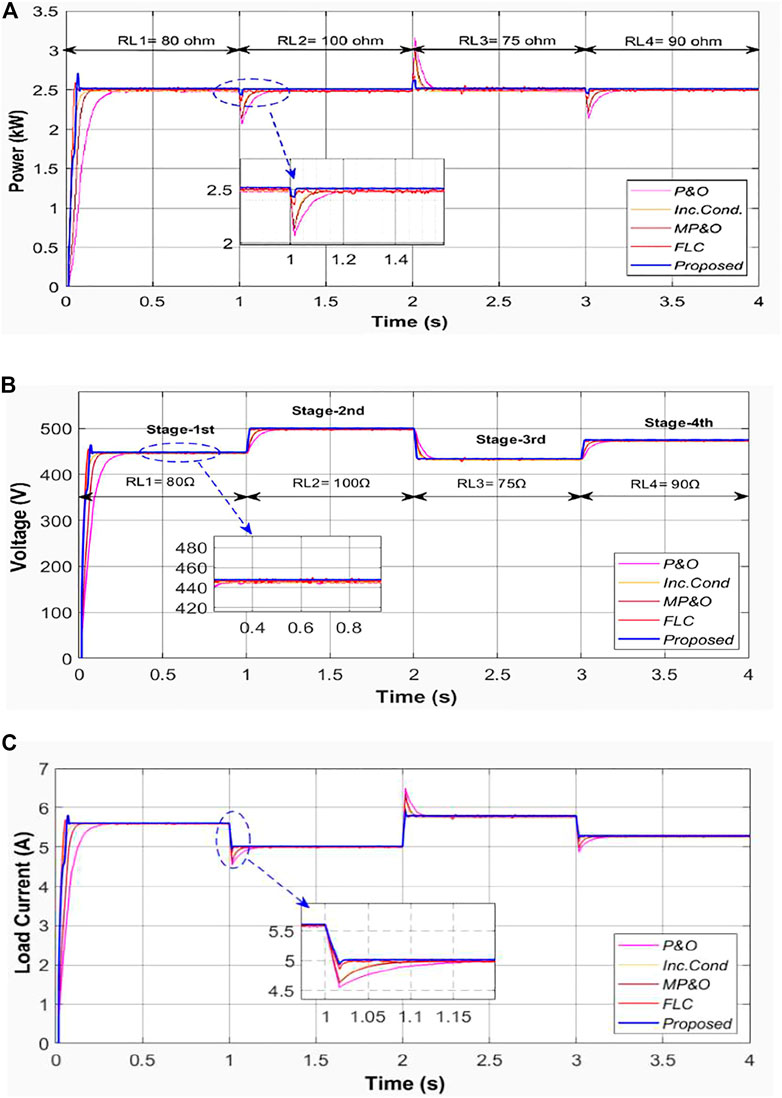
FIGURE 12. Responses under Scenario-III: (A) Output power (P0) (B) output voltage (V0) and (C) output current (I0)
4.4 Transient State Analysis
To verify the performances of all five considered MPPT techniques investigated during the transient state, responses of the PV system under scenario-I for level S11 are recorded. Responses obtained are shown in Figure 13. The sampling time captured in Scenario-I for level S11 for proposed MPPT technique is 35.8 m-sec., for P&O is 301 m-sec, for Inc Cond is 121 m-sec., for MP&O is 200 m-sec., and for FLC is 40 m-sec, respectively.
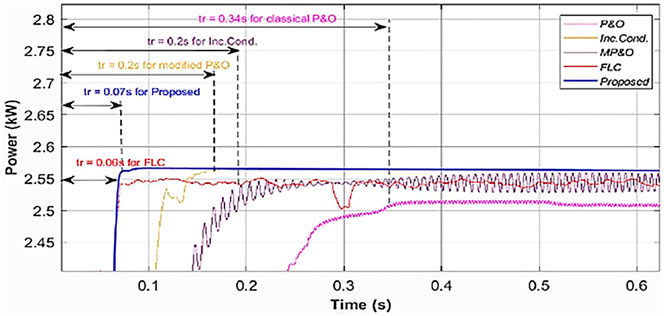
FIGURE 13. Performance of dynamic response time (tr) of MPPTs tested under Scenario-I in level S1.
The proposed technique tested under standard test conditions (GSTC is 1000 W/m2 and TSTC is 25°C) achieved dynamic efficiency of 99.68% which is better than the other four conventional control techniques as shown in Figure 14.
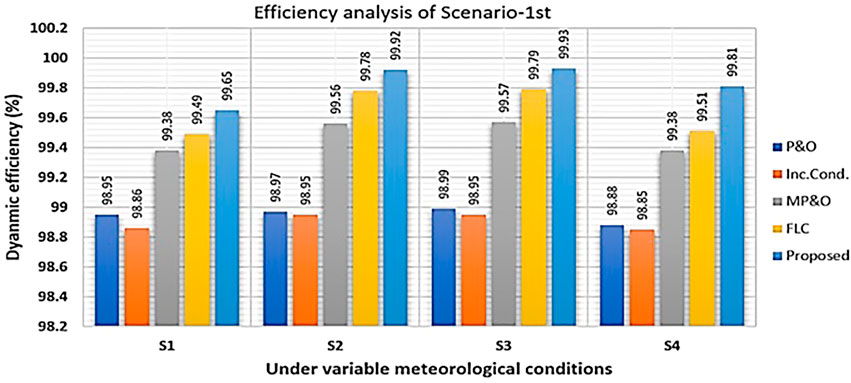
FIGURE 14. Convergence time and dynamic efficiency under scenario-first.
Overall performance comparison analysis of tracking simulation results is validated for the proposed and conventional MPPTs under all three different scenarios and given in Table 6. From Table 6, it is evident that proposed technique is better than other conventional techniques available in the literature. The proposed technique gives better efficiency, more output power, and lesser ripple in comparison to other techniques.
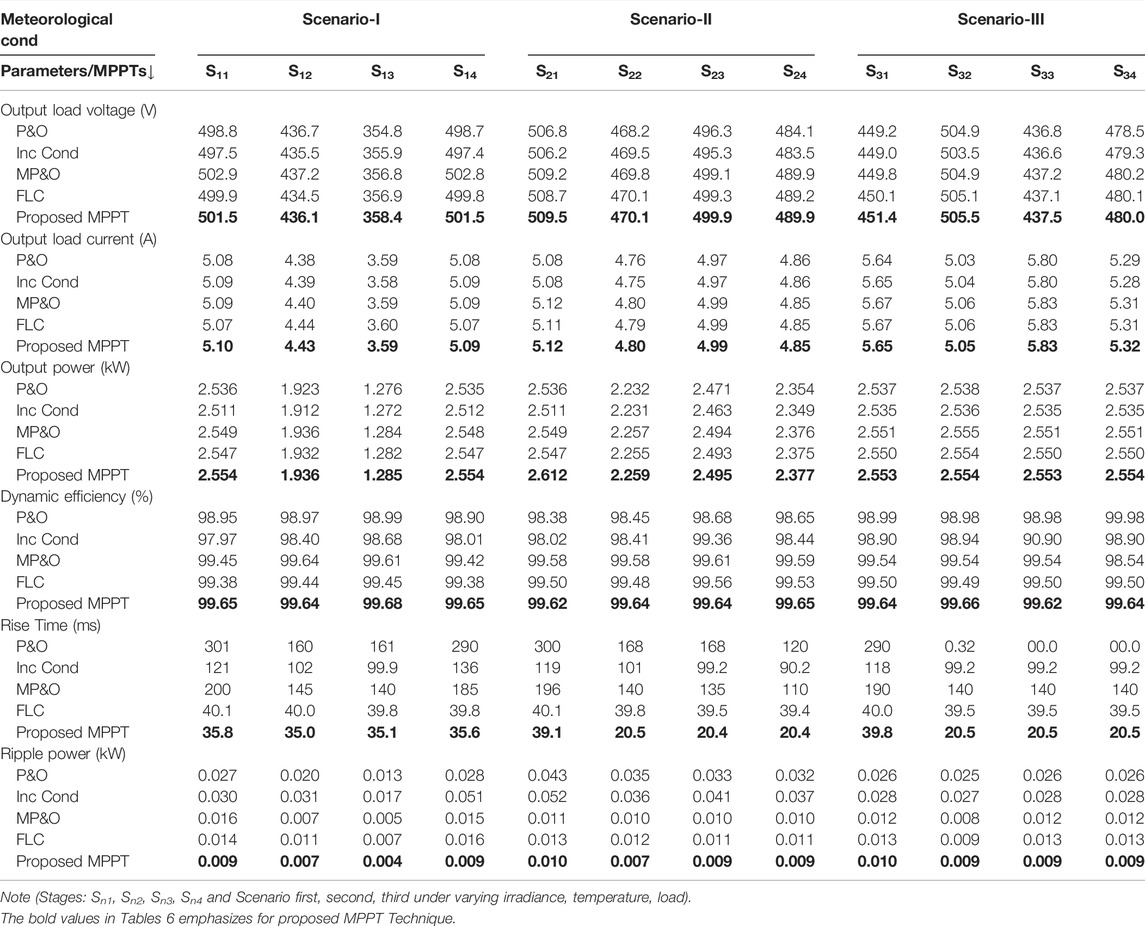
TABLE 6. Overall performance comparison under scenario-I, II and III.
5 Conclusion
In this paper, an improved P&O MPPT technique is proposed and developed with a mechanism to automatically adjust the step-size, possessing the characteristics of accurate rapid tracking response, effectively improved efficiency, reducing oscillations, and extracting optimal power for PV energy conversion system. The performance of the developed adaptive step-sized MPPT algorithm is compared with the other four conventional MPPT techniques; such as P&O, I&C, modified P&O, and FLC-based techniques. Performance validation is conducted under sudden changes of meteorological conditions and load variations considering the steady-state and dynamic conditions. The developed algorithm is tested for a 2.563 kW PV energy conversion system, using MATLAB/Simulink environment under varying irradiance, varying ambient temperatures, and varying load conditions. The effective efficiency of PV system using the developed adaptive step-sized MPPT algorithm improves from 99.61 to 99.9%, as compared to the other four conventional MPPT techniques. In terms of accuracy, the FLC MPPT algorithm comes closer to the developed algorithm but the adaptive step-size MPPT algorithm performs better in terms of tracking accuracy and limiting the oscillations. The proposed improved adaptive step-size P&O MPPT algorithm finds its applications in tracking the maximum power under sudden changes in the ambient environmental conditions. In the future, the developed algorithm can be realized experimentally in order to further improve its applicability by incorporating more realistic working conditions
Data Availability Statement
The raw data supporting the conclusion of this article will be made available by the authors, without undue reservation.
Author Contributions
All authors listed have made a substantial, direct, and intellectual contribution to the work and approved it for publication.
Funding
This research received no specific grant from any funding agency in the public, commercial, or not-for-profit sectors.
Conflict of Interest
The authors declare that the research was conducted in the absence of any commercial or financial relationships that could be construed as a potential conflict of interest.
Publisher’s Note
All claims expressed in this article are solely those of the authors and do not necessarily represent those of their affiliated organizations, or those of the publisher, the editors, and the reviewers. Any product that may be evaluated in this article, or claim that may be made by its manufacturer, is not guaranteed or endorsed by the publisher.
References
Abo-Al-Ez, K. M., Kaddah, S. S., Diab, S., and Abdraboh, E.-H. (2020). Performance Analysis of Maximum Power Point Tracking (MPPT) for PV Systems under Real Meteorological Conditions. Green Energy Technol., 199–228. doi:10.1007/978-3-030-05578-3_7
Ahmed, J., and Salam, Z. (2016). A Modified P&O Maximum Power Point Tracking Method with Reduced Steady-State Oscillation and Improved Tracking Efficiency. IEEE Trans. Sustain. Energy 7 (4), 1506–1515. doi:10.1109/TSTE.2016.2568043
Algarín, C. R., Giraldo, J. T., and Álvarez, O. R. (2017). Fuzzy Logic Based MPPT Controller for a PV System. Energies 10 (12), 2036. doi:10.3390/en10122036
Ali, A. I. M., Sayed, M. A., and Mohamed, E. E. M. (2018). Modified Efficient Perturb and Observe Maximum Power Point Tracking Technique for Grid-Tied PV System. Int. J. Electr. Power & Energy Syst. 99, 192–202. doi:10.1016/j.ijepes.2017.12.029
Ali, M. M., Youssef, A. R., Ali, A. S., and Abdel‐Jaber, G. T. (2020). Variable Step Size PO MPPT Algorithm Using Model Reference Adaptive Control for Optimal Power Extraction. Int. Trans. Electr. Energ Syst. 30 (1), 1–21. doi:10.1002/2050-7038.12151
Amara, K., Fekik, A., Hocine, D., Bakir, M. L., Bourennane, E.-B., Malek, T. A., et al. (2018). “Improved Performance of a PV Solar Panel with Adaptive Neuro Fuzzy Inference System ANFIS Based MPPT,” in Proceeding of the 7th International IEEE Conference on Renewable Energy Research and Applications, ICRERA 2018, Paris, France, Oct. 2018 (IEEE), 1098–1101. 5. doi:10.1109/ICRERA.2018.8566818
Amir, A., Amir, A., Selvaraj, J., Rahim, N. A., and Abusorrah, A. M. (2017). Conventional and Modified MPPT Techniques with Direct Control and Dual Scaled Adaptive Step-Size. Sol. Energy 157 (August), 1017–1031. doi:10.1016/j.solener.2017.09.004
Amir, M., and Srivastava, S. K. (2018). “Analysis of MPPT Based Grid Connected Hybrid Renewable Energy System with Battery Backup,” in Proceeding of the 2018 International Conference on Computing, Power and Communication Technologies, GUCON 2018, Greater Noida, India, Sept. 2018 (IEEE), 903–907. doi:10.1109/GUCON.2018.8674902
Aouchiche, N., Aitcheikh, M. S., Becherif, M., and Ebrahim, M. A. (2018). AI-based Global MPPT for Partial Shaded Grid Connected PV Plant via MFO Approach. Sol. Energy 171 (June), 593–603. doi:10.1016/j.solener.2018.06.109
Bayrak, G., and Ghaderi, D. (2019). An Improved Step‐up Converter with a Developed Real‐time Fuzzy‐based MPPT Controller for PV‐based Residential Applications. Int. Trans. Electr. Energ Syst. 29 (12), 1–20. doi:10.1002/2050-7038.12140
Ben Salah, C., and Ouali, M. (2011). Comparison of Fuzzy Logic and Neural Network in Maximum Power Point Tracker for PV Systems. Electr. Power Syst. Res. 81 (1), 43–50. doi:10.1016/j.epsr.2010.07.005
Bendib, B., Belmili, H., and Krim, F. (2015). A Survey of the Most Used MPPT Methods: Conventional and Advanced Algorithms Applied for Photovoltaic Systems. Renew. Sustain. Energy Rev. 45, 637–648. doi:10.1016/j.rser.2015.02.009
Chauhan, U., Rani, A., singh, V., and Kumar, B. (2020). “A Modified Incremental Conductance Maximum Power Point Technique for Standalone PV System,” in Proceeding of the 2020 7th International Conference on Signal Processing and Integrated Networks, SPIN, Noida, India, Feb. 2020 (IEEE), 61–64. doi:10.1109/SPIN48934.2020.9071156
Derbeli, M., Napole, C., Barambones, O., Sanchez, J., Calvo, I., and Fernández-Bustamante, P. (2021). Maximum Power Point Tracking Techniques for Photovoltaic Panel: A Review and Experimental Applications. Energies 14 (22), 7806–7831. doi:10.3390/en14227806
Dolara, A., Faranda, R., and Leva, S. (2009). Energy Comparison of Seven MPPT Techniques for PV Systems. J. Electromagn. Analysis Appl. 01 (03), 152–162. doi:10.4236/Jemaa.2009.13024
Elbaset, A., Ali, H., and Abd-El Sattar, M. (2015). A Modified Perturb and Observe Algorithm for Maximum Power Point Tracking of Photovoltaic System Using Buck-Boost Converter. JES. J. Eng. Sci. 43, 344–362. Sciences Assiut University Faculty of Engineering. doi:10.21608/jesaun.2015.115189
Eltamaly, A. M., and Farh, H. M. H. (2019). Dynamic Global Maximum Power Point Tracking of the PV Systems under Variant Partial Shading Using Hybrid GWO-FLC. Sol. Energy 177, 306–316. doi:10.1016/j.solener.2018.11.028
Esram, T., and Chapman, P. L. (2007). Comparison of Photovoltaic Array Maximum Power Point Tracking Techniques. IEEE Trans. Energy Convers. 22 (2), 439–449. doi:10.1109/TEC.2006.874230
Hlaili, M., and Mechergui, H. (2016). Comparison of Different MPPT Algorithms with a Proposed One Using a Power Estimator for Grid Connected PV Systems. Int. J. Photoenergy 2016, 1–10. doi:10.1155/2016/1728398
Jana, S., Kumar, N., Mishra, R., Sen, D., and Saha, T. K. (2020). Development and Implementation of Modified MPPT Algorithm for Boost Converter‐based PV System under Input and Load Deviation. Int. Trans. Electr. Energ Syst. 30 (2), 1–15. doi:10.1002/2050-7038.12190
Jiayi, H., Chuanwen, J., and Rong, X. (2008). A Review on Distributed Energy Resources and MicroGrid. Renew. Sustain. Energy Rev. 12 (9), 2472–2483. doi:10.1016/j.rser.2007.06.004
Jordehi, A. R. (2016). Maximum Power Point Tracking in Photovoltaic (PV) Systems: A Review of Different Approaches. Renew. Sustain. Energy Rev. 65, 1127–1138. doi:10.1016/j.rser.2016.07.053
Kottas, T. L., Boutalis, Y. S., and Karlis, A. D. (2006). New Maximum Power Point Tracker for PV Arrays Using Fuzzy Controller in Close Cooperation with Fuzzy Cognitive Networks. IEEE Trans. Energy Convers. 21 (3), 793–803. doi:10.1109/TEC.2006.875430
Kumar, B., Chauhan, Y. K., and Shrivastava, V. (2014). A Comparative Study of Maximum Power Point Tracking Methods for a Photovoltaic-Based Water Pumping System. Int. J. Sustain. Energy 33 (4), 797–810. doi:10.1080/14786451.2013.769990
Li, S. (2019). A Variable-Weather-Parameter MPPT Control Strategy Based on MPPT Constraint Conditions of PV System with Inverter. Energy Convers. Manag. 197 (February), 111873. doi:10.1016/j.enconman.2019.111873
Li, J., and Wang, H. (2009). “A Novel Stand-Alone PV Generation System Based on Variable Step Size INC MPPT and SVPWM Control,” in Proceeding of the 2009 IEEE 6th International Power Electronics and Motion Control Conference, IPEMC ’09, Wuhan, China, May 2009 (IEEE), 2155–2160. 3. doi:10.1109/IPEMC.2009.5157758
Loukil, K., Abbes, H., Abid, H., Abid, M., and Toumi, A. (2020). Design and Implementation of Reconfigurable MPPT Fuzzy Controller for Photovoltaic Systems. Ain Shams Eng. J. 11, 319–328. doi:10.1016/j.asej.2019.10.002
Mamarelis, E., Petrone, G., and Spagnuolo, G. (2014). Design of a Sliding-Mode-Controlled SEPIC for PV MPPT Applications. IEEE Trans. Ind. Electron. 61 (7), 3387–3398. doi:10.1109/TIE.2013.2279361
Mekhilef, S., Saidur, R., and Safari, A. (2011). A Review on Solar Energy Use in Industries. Renew. Sustain. Energy Rev. 15 (4), 1777–1790. doi:10.1016/j.rser.2010.12.018
Mousa, H. H. H., Youssef, A.-R., and Mohamed, E. E. M. (2021). State of the Art Perturb and Observe MPPT Algorithms Based Wind Energy Conversion Systems: A Technology Review. Int. J. Electr. Power & Energy Syst. 126, 106598. doi:10.1016/j.ijepes.2020.106598
Pavithra, C., Singh, P., Sundramurthy, V. P., Karthik, T. S., Karthikeyan, P. R., T. Abraham, J., et al. (2021). “A Brief Overview of Maximum Power Point Tracking Algorithm for Solar PV System,” in Materials Today: Proceedings (Elsevier), 10–13. doi:10.1016/j.matpr.2021.01.220
Reza Reisi, A., Hassan Moradi, M., and Jamasb, S. (2013). Classification and Comparison of Maximum Power Point Tracking Techniques for Photovoltaic System: A Review. Renew. Sustain. Energy Rev. 19, 433–443. doi:10.1016/j.rser.2012.11.052
Safari, A., and Mekhilef, S. (2011). Simulation and Hardware Implementation of Incremental Conductance MPPT with Direct Control Method Using Cuk Converter. IEEE Trans. Ind. Electron. 58 (4), 1154–1161. doi:10.1109/TIE.2010.2048834
Saravanan, S., and Ramesh Babu, N. (2016). Maximum Power Point Tracking Algorithms for Photovoltaic System - A Review. Renew. Sustain. Energy Rev. 57, 192–204. doi:10.1016/j.rser.2015.12.105
Wang, N., Jin, M., Wang, Z., and Cheng, M. (2018). “Optimization of Photovoltaic MPPT System Efficiency Based on Combined Algorithm,” in Proceeding of the ICEMS 2018 - 2018 21st International Conference on Electrical Machines and Systems, Jeju, Korea, Oct. 2018 (Jeju (South Korea): KIEE EMECS KIEE Electrical Machinery and Energy Conversion Systems), 1122–1126. doi:10.23919/ICEMS.2018.8549191
Keywords: PV array, boost converter, MPPT technique, maximum power point, meteorological conditions
Citation: Singh J, Singh SP, Verma KS and Kumar B (2022) Comparative Analysis of MPPT Control Techniques to Enhance Solar Energy Utilization and Convergence Time Under Varying Meteorological Conditions and Loads. Front. Energy Res. 10:856702. doi: 10.3389/fenrg.2022.856702
Received: 17 January 2022; Accepted: 23 May 2022;
Published: 14 July 2022.
Edited by:
Shabana Urooj, Princess Nourah bint Abdulrahman University, Saudi ArabiaReviewed by:
Krishan Kumar, Dehn India, IndiaSeema Kewat, Hong Kong Polytechnic University, Hong Kong SAR, China
Mohammad Amir, Jamia Millia Islamia, India
Dheeraj Joshi, Delhi Technological University, India
Copyright © 2022 Singh, Singh, Verma and Kumar. This is an open-access article distributed under the terms of the Creative Commons Attribution License (CC BY). The use, distribution or reproduction in other forums is permitted, provided the original author(s) and the copyright owner(s) are credited and that the original publication in this journal is cited, in accordance with accepted academic practice. No use, distribution or reproduction is permitted which does not comply with these terms.
*Correspondence: Jaswant Singh, jaswant.knit2011@gmail.com