- College of Information Science and Engineering, Northeastern University, Shenyang, China
The uncertainty and volatility of renewable energy generation lead to large amounts of abandoned electricity. The electricity-hydrogen coupling microgrid (EHCM) consists of the proton exchange membrane electrolytic cell (PEMEC), liquid organic hydrogen carrier (LOHC) hydrogen storage, proton exchange membrane fuel cell (PEMFC). The structure helps to increase the utilization of wind and photovoltaic power. The scheduling of an EHCM is very challenging. This paper proposes the optimal operation of a microgrid considering the uncertainty of wind speed, light, and the coupling of electricity and hydrogen. The electricity-hydrogen coupling model and hydrogen market model are constructed. The microgrid provides ancillary services to the grid while meeting hydrogen demand. The above model is solved using a two-stage optimization method with time scales of day-ahead and intra-day. Finally, taking the IEEE 33-node microgrid as an example, the effectiveness of the proposed model is verified. The results of the case show that the proposed method can obtain more benefits and reduce carbon emissions.
Introduction
The 2015 Paris Climate Conference proposed limiting climate change to “well below 2°C”, which led to research on replacing traditional fossil energy with renewable energy. President Xi Jinping announced in 2020 that China will peak carbon dioxide emissions before 2030 and carbon neutrality before 2060. In this context, finding out green energy to replace fossil fuels to reduce carbon emissions is a very hot issue (Muyeen et al., 2011). Among various energy types, hydrogen is considered as a clean energy source. The reaction of the hydrogen fuel cell and the combustion of hydrogen are zero carbon emissions. Hydrogen can be used in heating systems, power generation systems (Chapman et al., 2019; Berger et al., 2020), industrial processes, and hydrogen fuel cell vehicles (Ramachandran and Menon, 1998; Marini et al., 2012; Zuo et al., 2021). It can be applied in many ways in the future (Jin et al., 2021; Liu et al., 2021; Zhang et al., 2021). The research about the production, transportation, and application of hydrogen is worthy of study.
It is very important to study the relationship between power systems and the application of hydrogen. Hydrogen production by electrolysis is considered to be one of the most efficient forms of hydrogen supply. In recent years, there has been a great deal of research into the use of renewable energy sources to produce hydrogen from abandoned electricity. China has the largest installed capacity of photovoltaic and wind power, and the renewable energy supply and demand show an inverse distribution trend. The installed wind power capacity in the “Three North” region accounts for 80%. The demand of electricity is concentrated in the central and eastern parts of China, which leads to an imbalance between electricity production and consumption (Liu et al., 2020; Qiu et al., 2022). The high penetration of renewable energy may cause intermittency and reliability problems for the grid. Microgrids provide efficient energy management for the integrated use of various distributed power sources, such as wind turbines and photovoltaics (Wang et al., 2013). Distributed generations are connected to the microgrid as a power bi-directional controllable aggregator. The distribution network does not have to directly face different types and nature of generating units (Zhang et al., 2017). The reliability and economy of distributed generations are enhanced. By using multi-energy complementarities and energy laddering (Wu et al., 2017), the energy utilization efficiency of the entire distribution network is eventually improved, and pollution emissions are significantly reduced (Jia et al., 2015; Li et al., 2015; Zhou et al., 2018).
The microgrid with the coupling of electricity and hydrogen can provide power to the grid, auxiliary services to the power market, and hydrogen to the hydrogen market.
A microgrid containing electrolytic cells and hydrogen fuel cells is established (Li et al., 2021), and a power capacity allocation with hydrogen as a flexible resource is proposed. A multi-objective optimization model with the lowest annual operating cost and the highest flexibility is established. The capacity allocation method of hybrid energy storage microgrid with the coupling of electricity and hydrogen is proposed in (Kong et al., 2021). The capacity allocation result with optimal integrated economy and power supply reliability is solved by particle swarm algorithm. In (García et al., 2013), an energy management model is proposed for microgrids containing renewable energy sources, batteries, and hydrogen storage devices to optimize the operating costs of individual microgrids. Similarly, a microgrid energy management system is proposed in (García et al., 2016). It takes into account the lifetime of the hydrogen system and battery storage to reduce operating costs. A hydrogen-based system for rural communities is built in (Mendis et al., 2015), where hydrogen is used to optimize renewable energy utilization and perform active/reactive power management.
In some remote areas where renewable energy is abundant, it is difficult to build large hydrogen transmission pipelines. Hydrogen is transported by liquefaction (Reuß et al., 2017). A promising method for storing and transporting hydrogen is hydrogen carriers, which keep hydrogen in some other chemical state (Fikrt et al., 2017). The concept of liquid organic hydrogen carriers (LOHCs) was introduced in the 1970s and 1980s (Taube et al., 1983). The process is to store hydrogen in the hydrogenation product through the reaction between unsaturated organic matter and hydrogen. The dehydrogenation process is to release hydrogen gas through a dehydrogenation reaction. The advantages are safety in transportation, storage, etc. Hydrogen can be transported and stored by appropriate adaptation of the existing infrastructure (Song et al., 2021). Hydrogenious Technologies (Hydrogenious LOHC Technologies, 2022) and H2-Industries (H2 Industries, 2022) of Germany used isomers of dibenzyltoluene as the main storage and transportation material for LOHCs. Wang et al. (Wang et al., 2017) compared N-ethylcarbazole hydrogen storage and high-pressure hydrogen storage. The efficiency of both can be equal without considering heat loss. Yang et al. (Yang et al., 2017) account that the hydrogen utilization using 70 and 35 MPa gas tanks and N-ethylcarbazole carriers are about 86, 88.3, and 88.7%. Niermann et al. (Niermann et al., 2019) studied a hydrogen storage process framework to compare the effect of different LOHCs materials and high-pressure hydrogen storage on the efficiency. Finally, considering the waste heat utilization of fuel cells, the overall chain efficiency of LOHCs exceeds that of high-pressure hydrogen storage. Therefore, LOHCs are recommended as a safer and more efficient way to store and transport hydrogen.
Hydrogen storage has been less studied in microgrids. A control scheme is proposed in (Recalde Melo and Chang-Chien, 2014) to coordinate offshore wind farms and hydrogen management systems to reduce the impact of wind power intermittency. Cost minimization and equivalent hydrogen consumption calculation methods are used in (Pu et al., 2019). Hydrogen storage is used for the consumption of excess electricity, which can achieve the minimum cost and energy storage state balance. An energy management method is proposed in (Li et al., 2020) to meet the demand of the microgrid, and to convert the excess electricity into hydrogen. The fuel cell is discharged when there is a power shortage. The energy management is achieved through coordinated control of various devices. The above work does not take into account the technical challenges of storage and transportation, while the ancillary services market is considered in the optimal scheduling model proposed in (El-Taweel et al., 2019). However, the model only considers demand response programs and ignores the possibility of using fuel cell units. The model in (El-Taweel et al., 2020) does not consider fuel cells, which limit the ability of the hydrogen production and storage system to provide multiple grid services. In summary, although previous work has included many aspects, a reasonable integrated model of microgrid coupled with electricity and hydrogen has not been studied. To solve the above problems, a coupling of electricity and hydrogen microgrid model based on LOHC for hydrogen storage and transportation is developed in this paper.
The contributions of this paper are as follows: 1) The microgrid model considers the constraints of grid and electricity-hydrogen coupling units, the operational characteristics of power to hydrogen and hydrogen storage. It reduces errors arising from the fixed efficiency of the traditional model, and improves the utilization of renewable energy generation. 2) The PEMFC power generation system consists of PEMFCs and batteries. And the characteristics of the PEMFC are considered to make it a guaranteed power generation unit. The microgrid can participate in grid auxiliary services to maximize microgrid revenue. 3) Day-ahead and intra-day multi-timescale scheduling is adopted to deal with the uncertainty of renewable energy. The day-ahead objective is to maximize the daily income of the microgrid, which is dispatched using mixed integer linear programming (MILP). In intra-day scheduling, model predictive control (MPC) is embedded in mixed integer quadratic programming (MIQP) to reduce prediction errors and achieve real-time control. 4) The EHCM meets hydrogen demand and power demand. The application of LOHC technology and the sale of oxygen is considered, which can improve safety and economy. The EHCM forms a zero-carbon energy system, which is significant for the future development and application of hydrogen.
The EHCM Model
The Structure of an EHCM
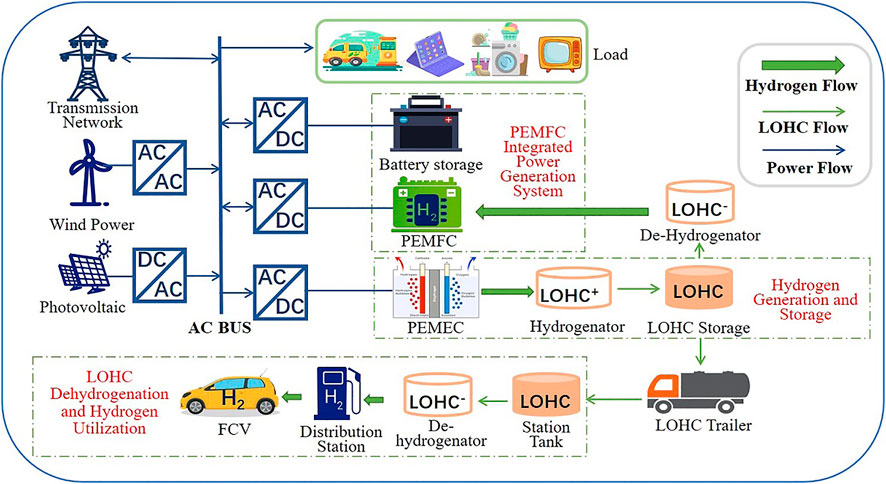
The structure of the EHCM based on LOHC is shown in Figure 1. The EHCM mainly consists of wind turbines, PV panels, PEMEC, PEMFC, storage batteries, electrical loads, etc. It constitutes a closed-loop energy system of “electricity - hydrogen - electricity,” and it can meet the hydrogen demand of the hydrogen market.
As can be seen from Figure 1, the LOHC-based hydrogen supply chain consists of an AC-DC converter, a PEMEC, a hydrogenator, and a LOHC storage tank. The PEMEC uses excess power to produce hydrogen, and hydrogen is passed through a hydrogenator to combine it with organic solvents to form LOHC. When the PEMFC receives the power generation signal, the hydrogen production and storage system based on LOHC uses the dehydrogenation reaction to meet the demand of the microgrid and grid auxiliary services. LOHC can also transport hydrogen to specific locations via tanker trucks, dehydrogenated and supplied to hydrogen refueling stations or industrial use, etc. To meet the demand for hydrogen and the high-power fluctuations of renewable energy, the PEMEC has a higher rated power.
The more commonly used alkaline electrolytic cells have disadvantages, such as low hydrogen production efficiency, insufficient dynamic response, etc. The membrane electrode of the PEMEC has many advantages over the alkaline electrolyte and asbestos diaphragm. It has good proton conduction characteristics, differential pressure resistance characteristics, high operating drop flow density, a wide range of adjustable power, and fast start-stop adjustment speed. Therefore, the EHCM uses PEMEC and PEMFC to realize the transfer of electricity and hydrogen.
Mathematical Model of Microgrid
Wind Power and Photovoltaic Models and Uncertainty Expression
The power model of wind turbines is shown as follows.
Where
To improve the accuracy of the PV model, the actual output power needs to take into account the light intensity and temperature, so the PV power is shown as follows.
Where
The wind speed and solar radiation follow a probability distribution function (PDF) based on the corresponding historical data (Farsangi et al., 2018) and do not affect the proposed model. To describe the uncertainty of wind power, the Weibull distribution function is used to describe the probability density function of wind power.
Where
The mean and maximum wind speed values are used to estimate the parameters of the Weibull function. The mean wind speed
The predicted wind speed value is
The uncertainty of the PV is coped with using the Beta distribution function, which is shown as follows.
Where
According to the Beta probability distribution function, the radiation absorbed by the solar panel is shown as follows.
Where
Battery Model
The charging model of battery is shown as follows.
The discharging model of battery is shown as follows.
Where
Where
Operating Characteristics Model of the PEMEC
Hydrogen production utilizes multiple parallel electrolytic cells which are composed of electrolytic chambers in series. By controlling the current of a single electrolytic cell, and discrete start-stop control of multiple electrolytic cells, the excess power can be used to produce hydrogen. The reaction principle of the PEMEC single electrolytic chamber is shown in Figure 2.
The voltage and current relationship for a single electrolytic chamber is shown as follows.
Where
The hydrogen production efficiency of PEMEC decreases as the power consumption increases. The models with constant efficiency of electrolytic cells have some deviations. The power consumption
Where
The Model of PEMFC
The voltage equation of PEMFC is shown as follows.
Where
The PEMFC power and hydrogen consumption rate are shown as follows.
Where
Gas Storage Model
LOHC is used to store hydrogen. The storage of hydrogen is an exothermic hydrogenation reaction, while the release of hydrogen is a heat-absorbing dehydrogenation reaction. LOHCs can store hydrogen at chemically high densities under ordinary environmental conditions to improve the safety and flexibility of the system. The mathematical models of hydrogen storage and oxygen storage are shown as follows.
Where
Energy Management Strategies of the PEMFC Generation System
In the PEMFC generation system, the PEMFC is the primary power source to follow the load demand and provide energy support for grid auxiliary services. Considering the compensation of the soft characteristics of PEMFC, the battery is added to the EHCM. The battery stores energy when the system is overpowered and supplies power during cold start and power switching so that the PEMFC power quickly follows the load changes.
Characterization of PEMFC
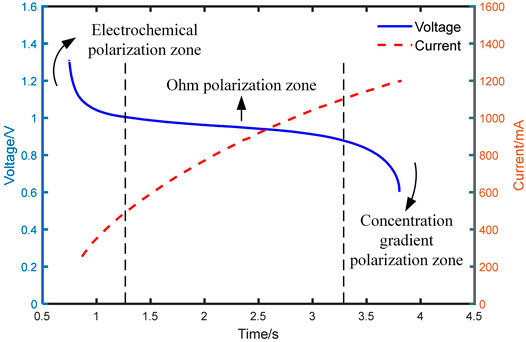
The PEMFC has soft characteristics when in cold start and load change states. When the PEMFC is used alone, the power output response is not fast enough. There is not enough current output for the changing demands of the load, and there is a voltage dip inside the cell.
As shown in Figure 3, when the demand power increases, the output current increases while its voltage keeps dropping. When the voltage drops to the lowest value, the PEMFC stack will shut down due to high internal temperature.
There is a gas delay in the chemical reaction process of the PEMFC. When the load increases, the current increases and the voltage drops accordingly. In contrast to the change in electrical power, the gas is supplied more slowly, and there is a transient drop in voltage. As the supply of sufficient gas gradually reaches a new balance in PEMFC, the time scale difference between the power and the gas reaction causes a delay in power output. The following equation will ensure the operation of the PEMFC.
Where
Considering the voltage protection threshold of the PEMFC stack, the output current shows a rise while the voltage drops and rises back when the current enters a plateau. The process keeps repeating inside the PEMFC. The response of the PEMFC is too slow to respond to rapid changes in load alone.
Work Modal Management
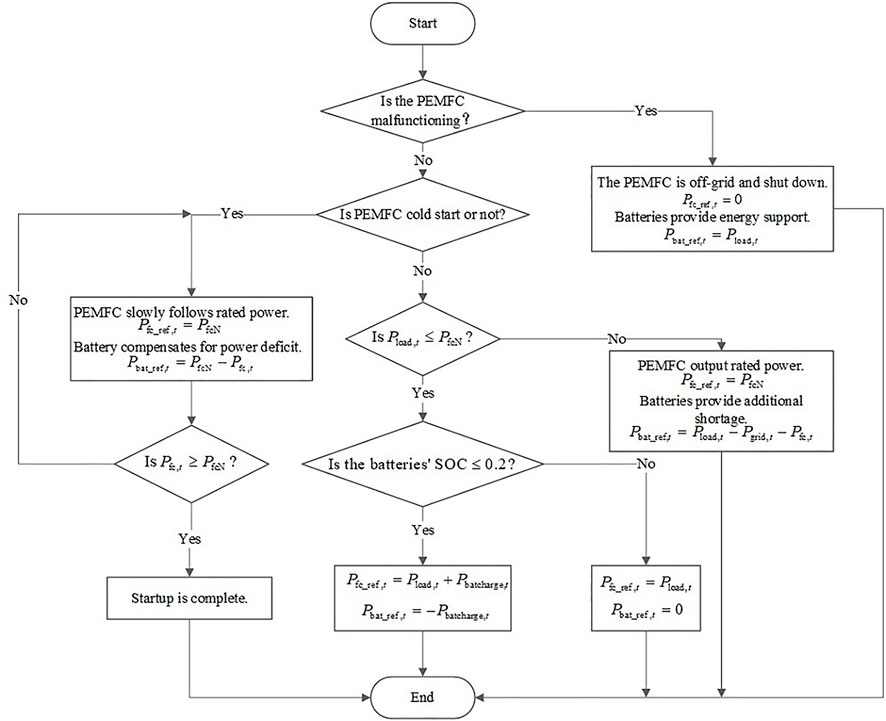
The PEMFC does not meet power supply standards in cold start and load switching states. It is used in combination with the battery to form a power supply system. To achieve power supply reliability of the PEMFC system, the energy management modes can be divided into four operating modes. The switching judgment and power command assignment between different operating modes are shown in Figure 4. The load of the microgrid is
Mode I (PEMFC Cold Start)
When the PEMFC cold started or power switched, the power output is slow and the battery is rapidly discharged to provide power for the microgrid bus. The energy flow diagram is shown in Figure 5A.
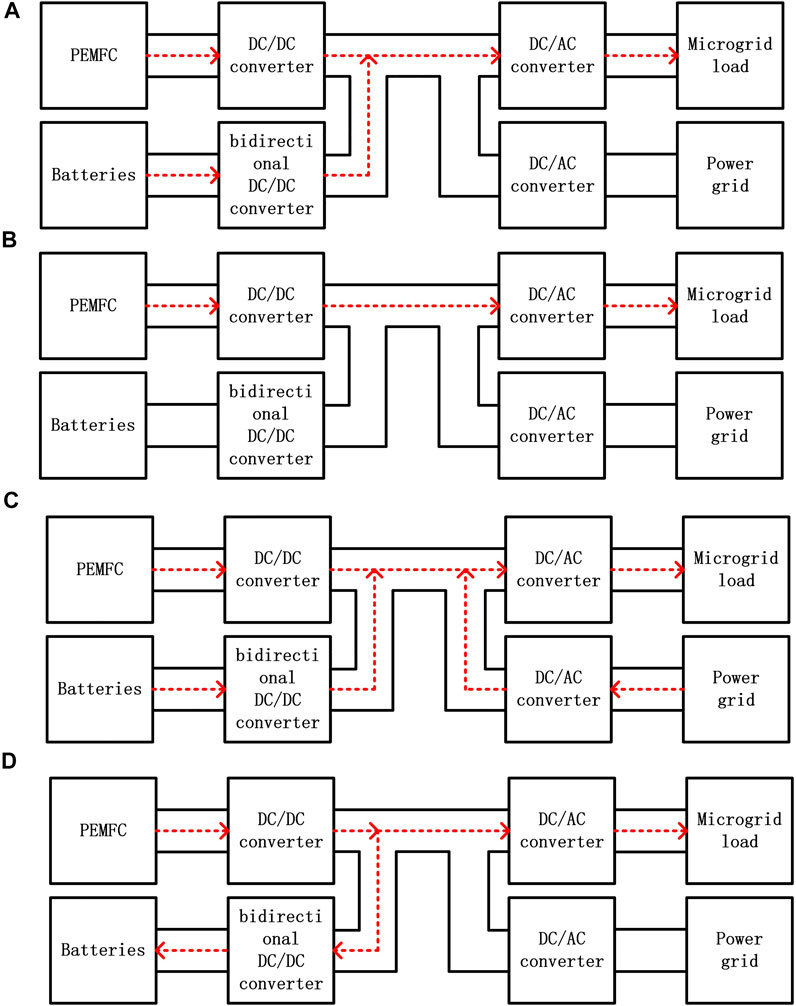
FIGURE 5. (A) Energy flow diagram of mode I, (B) Energy flow diagram of mode II, (C) Energy flow diagram of mode III, (D) Energy flow diagram of mode IV.
The power and the current output balance of the system are shown as follows.
Mode II (Rated Power Operating Mode)
When the output power of the system is rated, the PEMFC can follow the load. The battery is in standby mode and its SOC is in the normal range. Its energy flow diagram is shown in Figure 5B.
The power and the current output balance of the system are shown as follows.
Mode III (Overload Operation Mode)
When the microgrid load is greater than the rated output power of the power supply system, the system is in an overload state. The battery provides power at its normal SOC. The load receives the remaining power from the grid. The energy flow diagram is shown in Figure 5C.
The power and the current output balance of the system are shown as follows.
Mode IV (Reduced Load Operation Modes)
When the load is less than the rated output power of the PEMFC and the battery SOC is in the state of power deficit, the PEMFC generates more power to charge the battery to ensure the battery works in a healthy state to ensure its life. The energy flow diagram is shown in Figure 5D.
The power and the current output balance of the system are shown as follows.
Model Solving of an EHCM Based on LOHC
The electricity-hydrogen coupling model consists of PEMEC, LOHC hydrogen storage devices and PEMFC to realize the functions of hydrogen production, hydrogen storage and hydrogen power generation to meet hydrogen demand and load demand. We propose an EHCM scheduling model that considers the dynamic characteristics of PEMEC and PEMFC. Two-stage optimal scheduling with day-ahead global and intra-day real-time scheduling is adopted.
Day-Ahead Scheduling
Objective Function
The optimization goal of the day-ahead scheduling is to maximize the revenue of the microgrid. By optimizing the scheduling of generation, energy storage and electricity market auxiliary services, the operating costs of the microgrid can be reduced. It can also improve hydrogen production and grid auxiliary service revenue. The objective function is shown as follows.
Where
1. Revenue of the microgrid
Where
Revenues from sales of hydrogen and oxygen are shown as follows.
Where
The electricity market auxiliary demand response revenue is shown as follows.
Where
The environmental revenue of reduced greenhouse gas emissions from hydrogen fuel cell vehicles compared to regular fuel vehicles is shown as follows.
Where
2. Microgrid operation and maintenance costs
Where
Constraints
1. Power balance constraints
2. Battery charging and discharging constraints
Where
To protect the service life of the battery, the depth of charge and discharge is shown as follows.
3. PEMEC operating constraints
The operating constraints of the PEMEC include the nonlinear relationship between hydrogen production flow and power consumption, the range of current density regulation.
Where
4. PEMFC operating constraints
Where
To ensure the backup capacity to meet the grid auxiliary services, the upper and lower limits are constrained as follows.
5. Gas storage capacity constraints
The constraints of LOHC hydrogen and oxygen storage capacity are shown as follows.
6. Grid power constraints
The grid power is affected by the feeder capacity and follows the following constraints.
Intra-Day Scheduling
The prediction bias in the day-ahead scheduling leads to power fluctuations and scheduling errors. To make the intra-day scheduling close to the day-ahead scheduling and reduce the economic loss caused by uncertainty and the security of microgrid, intra-day scheduling is scheduled once every 15 min. The objective function is as follows.
Where
Solving Process
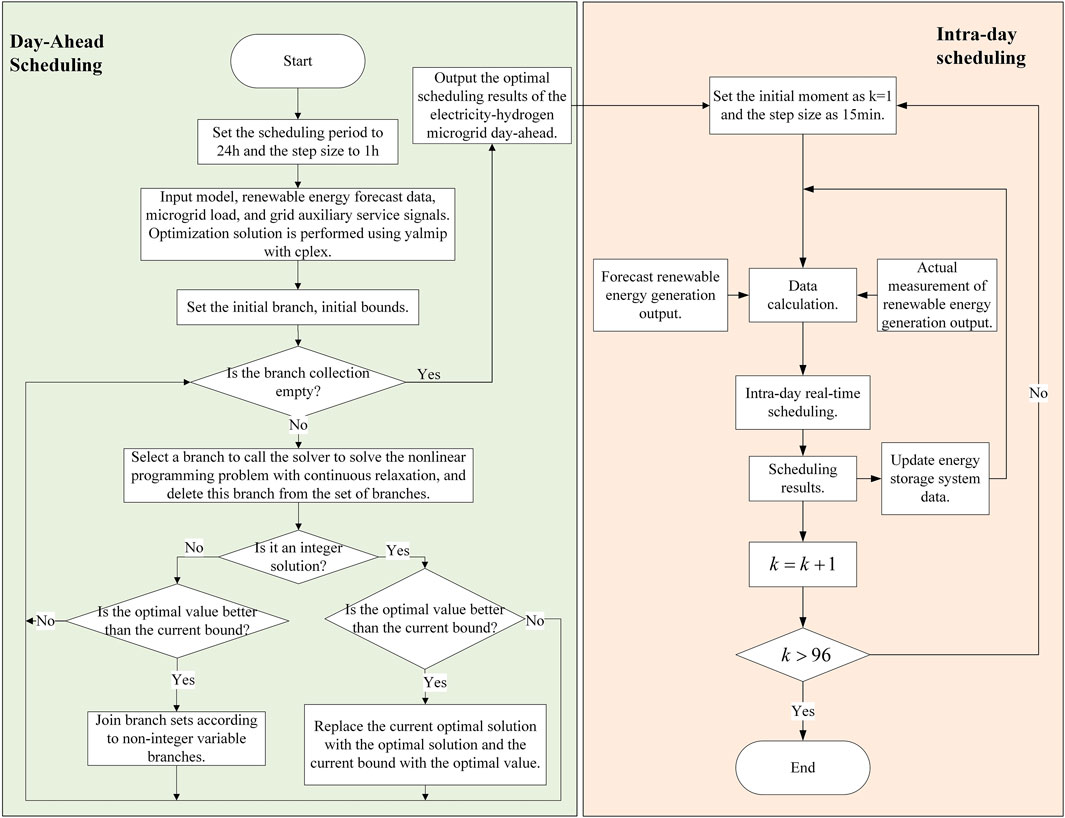
The optimal scheduling method proposed is day-ahead long-timescales scheduling and intra-day real-time scheduling. The specific solving optimization process is shown in Figure 6.
The day-ahead scheduling period is 24 h, and the step size is 1 h. Considering the uncertainty of wind power and PV, the optimization objective is to maximize the daily micro-grid revenue. The model is a mixed integer linear programming model, which is solved by Yalmip and Cplex to obtain global optimization results. However, the day-ahead optimal scheduling step is in hours. There is a prediction error, and the electricity-hydrogen microgrid cannot respond to the power fluctuation in time. The microgrid provides a demand response service and accepts signals from the power grid, which requires more accurate optimal scheduling. Based on the short-term prediction results, MPC model prediction control is used, and the optimization is rolled over every 15 min. The intra-day optimization is based on the day-ahead optimization results. The controllable unit of the EHCM corrects the day-ahead optimization results to reduce the prediction errors and improve the stability and economy of the microgrid.
Case Analysis
Basic Data
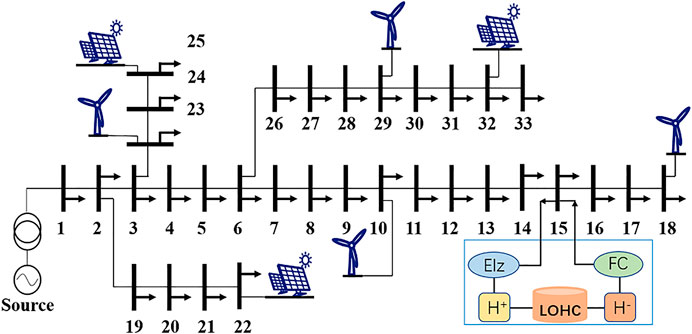
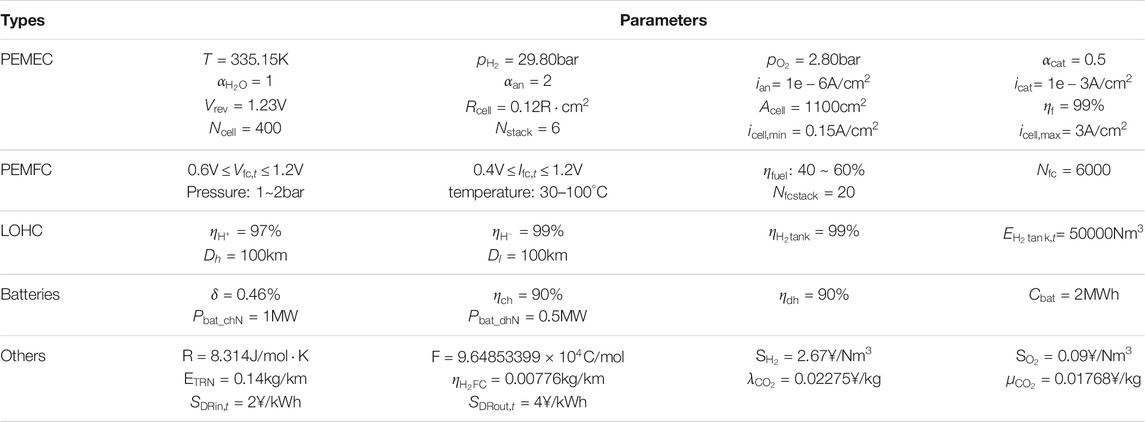
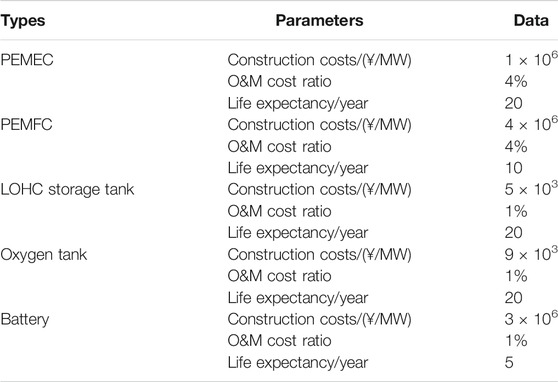
To verify the effectiveness of the proposed scheduling method, this section uses wind speed and light generation data from a microgrid in remote areas of western China, and the microgrid distribution structure diagram is shown in Figure 7. There is a surplus of wind and solar power, but it is expensive to build high power transmission lines and hydrogen pipelines. Hydrogen can be transported by ordinary tanker truck using LOHC hydrogen storage, and the transport distance is set at 100 km. The EHCM consists of four wind farms, three photovoltaic power plants, 48 MW PEMEC system, 10 MW PEMFC and 2 MWh battery power generation system. Typical daily scenarios in summer and winter are set up to solve the optimal scheduling results of this EHCM. The system economic parameters and specific equipment parameters are shown in Tables 1, 2.
Scenarios Setting
To study the effects of electricity-hydrogen coupling, hydrogen demand and grid auxiliary services on the scheduling results, the following four scenarios are set up for comparison.
S1: A scheduling method considering the dynamic characteristics of electricity-hydrogen coupling and auxiliary services of power grid.
S2: A Scheduling method that ignores the dynamic characteristics of electricity-hydrogen coupling.
S3: Ignore the scheduling mode of grid auxiliary services.
S4: A scheduling method that ignores the electricity-hydrogen coupling and the dynamic characteristics of auxiliary services of power grid.
Analysis of Results
Day-Ahead Optimized Scheduling Results
Figures 8, 9 show the day-ahead optimal scheduling results for a typical day in summer and winter. Figures 8A, 9A show the renewable energy generation forecast and microgrid load forecast for typical days in summer and winter. Figures 8B, 9B show the output of each unit for typical days in summer and winter. Figures 8C, 9C show the comparison of hydrogen production and hydrogen demand for typical days in summer and winter.
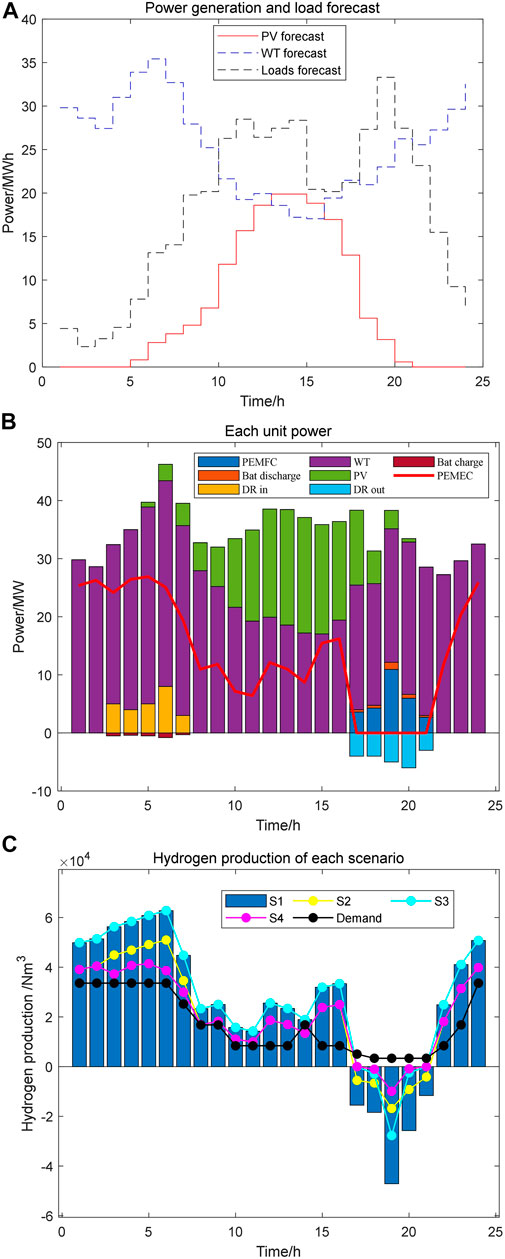
FIGURE 8. (A) Day-ahead forecast results of a typical summer day, (B) each unit power of a typical summer day, (C) hydrogen production and hydrogen demand of a typical summer day.
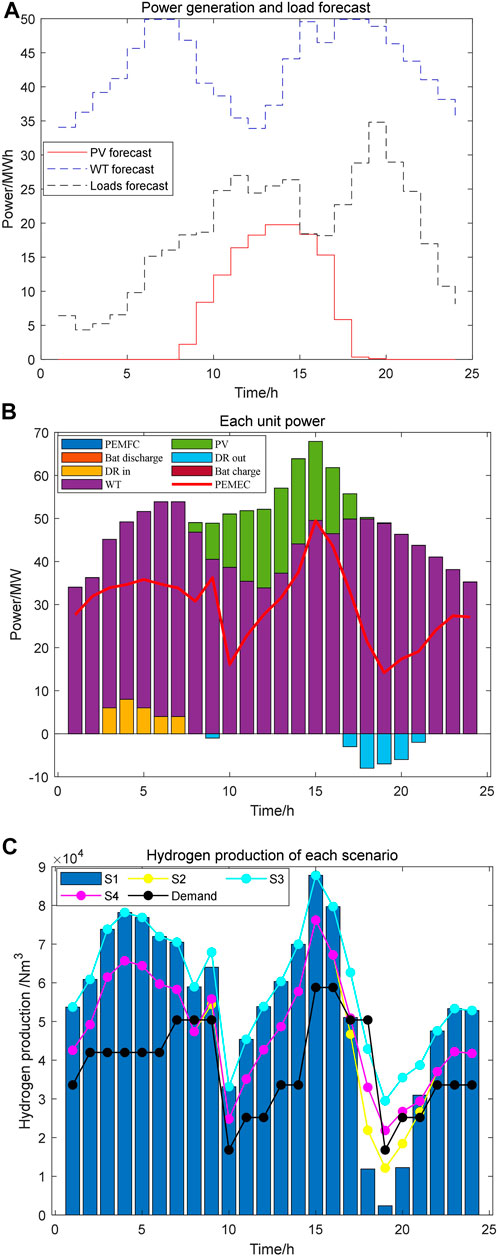
FIGURE 9. (A) Day-ahead forecast results of a typical winter day, (B) each unit power of a typical winter day, (C) hydrogen production and hydrogen demand of a typical winter day.
Summer light is strong in the northwest and wind speed is relatively low compared to other seasons. Photovoltaic and wind power systems are simultaneously used as the primary energy source for the EHCM. When the microgrid operates in island mode, renewable energy generation cannot meet the electric load demand. When there is power abandonment, PEMEC consumes excess electricity from renewable sources to produce hydrogen. It can realize the conversion of energy forms, and improve the utilization rate of renewable energy generation. When there is a shortage of electrical energy supply, the energy gap within the capacity can be supported by PEMFC with batteries to provide power for the load. The stored hydrogen is consumed and the microgrid forms a closed energy loop. The EHCM participates in the grid demand response service. Within the capacity of the microgrid, when the grid requires power during power consumption peaks, it is powered first by renewable energy generation and second by the PEMFC power systems. The PEMEC of the EHCM can provide a wide range of power consumption for the grid in a low consumption period.
In winter, the light intensity is weaker than in other seasons and the light hours become shorter, while the wind power generation is in the peak range for a long time. As shown in Figure 9A, wind power can meet the winter load of the microgrid. Hydrogen is produced in large quantities during the winter months, which can be highly profitable. In Figure 9B, the battery power and PEMFC power are 0 on a typical winter day. While the power of the PEMEC is high, the hydrogen production per unit time is at a high level. Using this energy can reduce renewable energy abandonment and reduce carbon emissions.
As can be seen in Figures 8, 9, the primary power source of the EHCM in the proposed day-ahead optimization strategy comes from renewable energy generation and the PEMFC power generation system. The PEMFC is required for part of a typical day in summer, while wind power is more abundant in winter and the main load is the PEMEC. Hydrogen production is at a higher position in winter. In S1, the dynamic characteristics of the electricity-hydrogen coupling system are considered, which is neglected in S2. In the simulation results of Figures 8C, 9C, that the hydrogen production shows a more significant deviation. Therefore, the dynamic characteristics of electricity-hydrogen coupling have a great influence on hydrogen production. If it is neglected, the control of hydrogen production will be very inaccurate and affect the accuracy and economy of the system.
Intra-day Optimal Scheduling Results
Figures 10, 11 show the results of intra-day real-time optimal scheduling after model predictive control. The day-ahead optimal scheduling is in hours. The forecast results for wind and PV are relatively rough, and the microgrid scheduling cannot respond to load fluctuations in time. The real-time scheduling of intra-day is based on 15 min. Comparing the optimized scheduling results in Figure 10 with those in Figures 8, 11 with those in Figure 9, the model prediction control can predict the real-time wind power and PV output more accurately than the day-ahead optimization results. The actual power consumed by PEMEC is more accurate and renewable power is fully consumed. When the real-time scheduling and the day-ahead scheduling results are close, the microgrid controllable units correct the individual scheduling results based on the day-ahead scheduling to reduce the error. When the intra-day scheduling differs significantly from the day-ahead scheduling results, the microgrid controllable units can be optimally scheduled in real time based on the actual renewable energy forecast values.
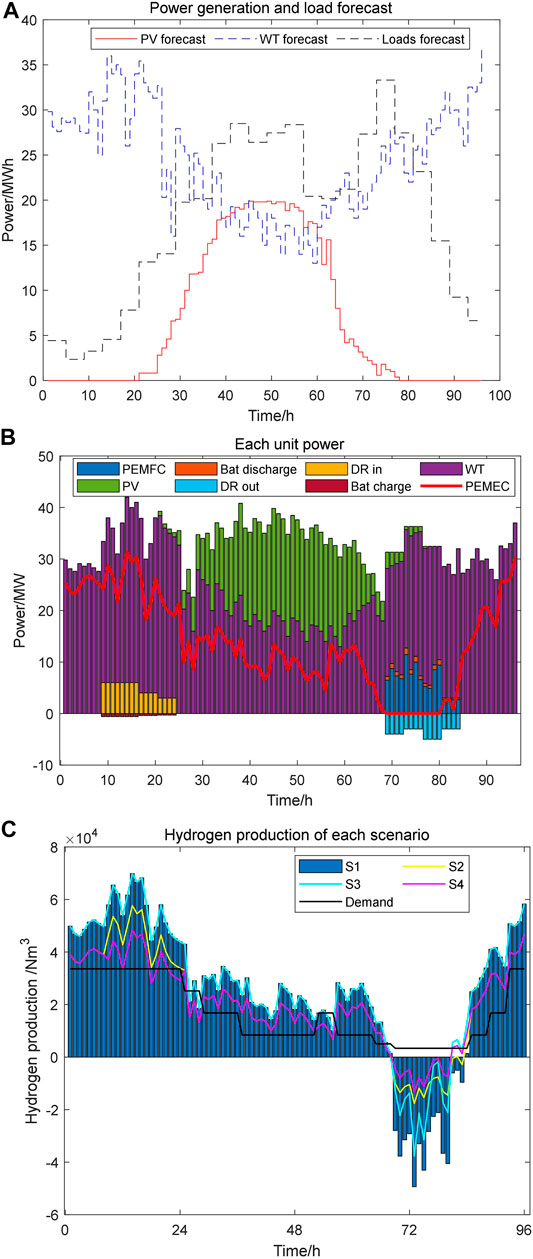
FIGURE 10. (A) Intra-day forecast results of a typical summer day, (B) each unit power of a typical summer day, (C) hydrogen production and hydrogen demand of a typical summer day.
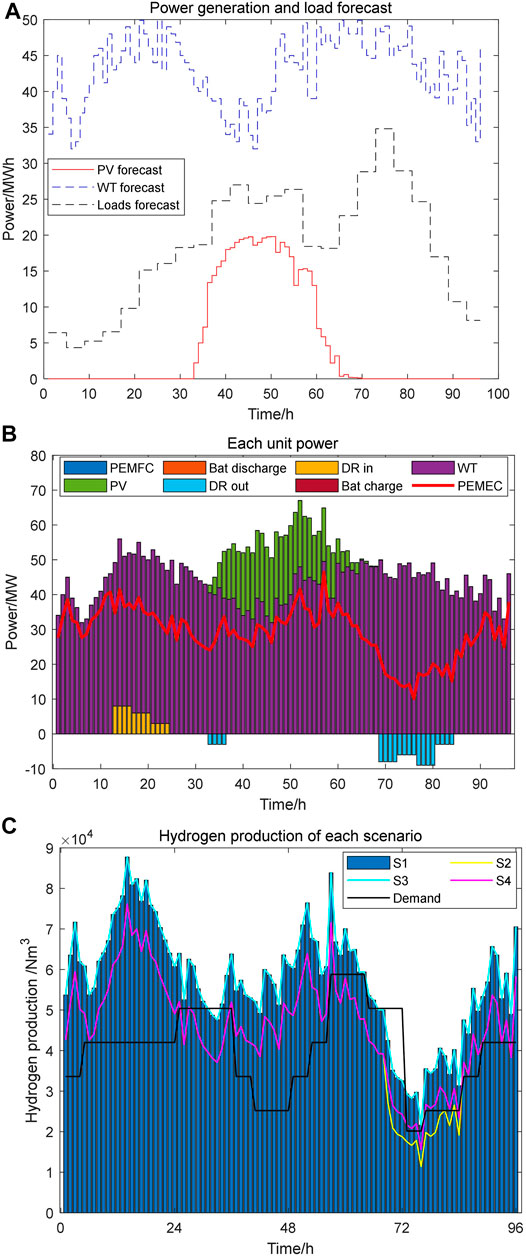
FIGURE 11. (A) Intra-day forecast results of a typical winter day, (B) each unit power of a typical winter day, (C) hydrogen production and hydrogen demand of a typical winter day.
Considering the dynamic characteristics of electricity-hydrogen coupling, the intra-day scheduling results of the PEMEC and PEMFC generation systems are more accurate. The efficiency of the power to hydrogen is related to the absorbed power of the PEMEC, which allows the maximum approximation of actual hydrogen production. It can get a better overview of hydrogen production and the state of hydrogen storage. The power response of the PEMFC system can follow the load change, which can reduce the hydrogen consumption and guarantee the quality of the system power supply.
Economic Analysis of Day-Ahead and Intra-day Scheduling Results
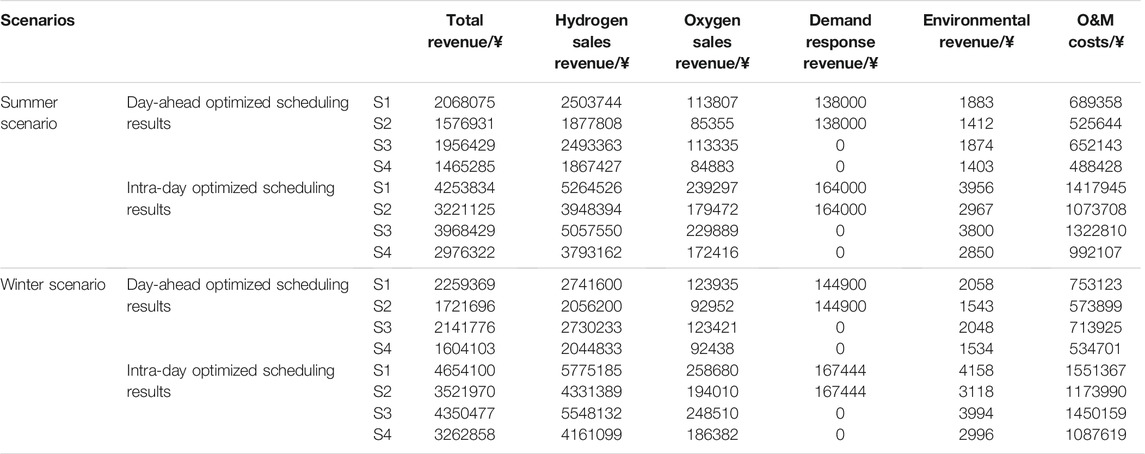
Table 3 shows the optimization costs for day-ahead and intra-day scheduling of the EHCM for different scenarios. The time scale of the day-ahead optimal scheduling is broad. Uncertainty in renewable energy forecasts makes it difficult to accurately reflect actual power generation, leading to power shortages and abandonment. The intra-day optimal scheduling is based on the day-ahead optimal scheduling for error reduction. Therefore, it has a good impact on the microgrid economy. Intra-day scheduling improves microgrid economics by making corrections to optimization results in a short period. From Table 3, hydrogen sales revenue, oxygen sales revenue, demand response revenue, and reduced carbon emissions revenue in the typical summer day in S1 are improved by 9.5, 8.9, 5, and 9.3%, which in the typical winter day are improved by 9.7, 8.1, 2.1, and 5.1%. The microgrid day-ahead and intra-day optimal scheduling for S1 consider the dynamic characteristics of electricity-hydrogen coupling and demand response services. In terms of overall economics, the total revenues of day-ahead and intra-day scheduling for a typical day scenario in summer and winter are improved by 9.25 and 9.41%. The intra-day optimization revenue of each typical day is higher than that of the day-ahead scheduling results. It shows that intra-day scheduling can reduce the errors generated by day-ahead scheduling. The optimization method proposed in this paper has the effect of improving the economy.
Analysis of Optimized Scheduling Results for Different Scenarios
A comparison of typical daily scenarios in summer and winter shows that hydrogen production in the winter scenario is more than twice as high as in summer, due to the high wind speed and the larger capacity of the wind farm. S1 considers the dynamic characteristics of electricity-hydrogen coupling with participation in grid demand response services. S2 and S3 ignore electricity-hydrogen coupling dynamic characteristics and grid demand response services, while S4 ignores the above two. Analysis of the day-ahead optimal scheduling results for a typical summer day shows that the total revenue of the microgrid is the highest in S1. After ignoring the electricity-hydrogen coupling characteristics, the revenue from hydrogen sales in the S2 scenario is decreased by 23.7%. This has a significant impact on the control of hydrogen production as the efficiency variation of the PEMEC is ignored. S3 only ignores the demand response service, and there is only a tiny change in hydrogen production revenue. For the microgrid with high-capacity PEMEC devices, precise control can be made for wide power fluctuations. The impact on hydrogen production and power fluctuations in the microgrid is minimal due to the low power of demand response. As a result, microgrids can provide additional ancillary services to increase revenue. S4 is the least profitable scenario because it ignores the electricity-hydrogen coupling characteristics and the grid auxiliary services.
In summary, an EHCM can improve the economy. Because PEMEC can cope with the wide range of power fluctuations caused by the uncertainty of renewable energy. Hydrogen and oxygen have a wide range of uses, and the revenue from the sale of gas from the microgrid is significant. The EHCM, which contains a PEMEC and a PEMFC power generation system, can absorb a large amount of abandoned electricity from renewable energy for hydrogen production. Hydrogen can also be used to supply loads by generating electricity through reactions of the PEMFC. Thus, the EHCM can provide the corresponding grid auxiliary services. As clean energy, when used as the energy for hydrogen fuel cell vehicles, the reaction products of hydrogen are only water. Therefore, from the environmental point of view, it can reduce carbon emissions to achieve economic benefits. But most importantly, it brings environmental benefits and enhances the overall environmental friendliness.
Analysis of Different Weighting Coefficients
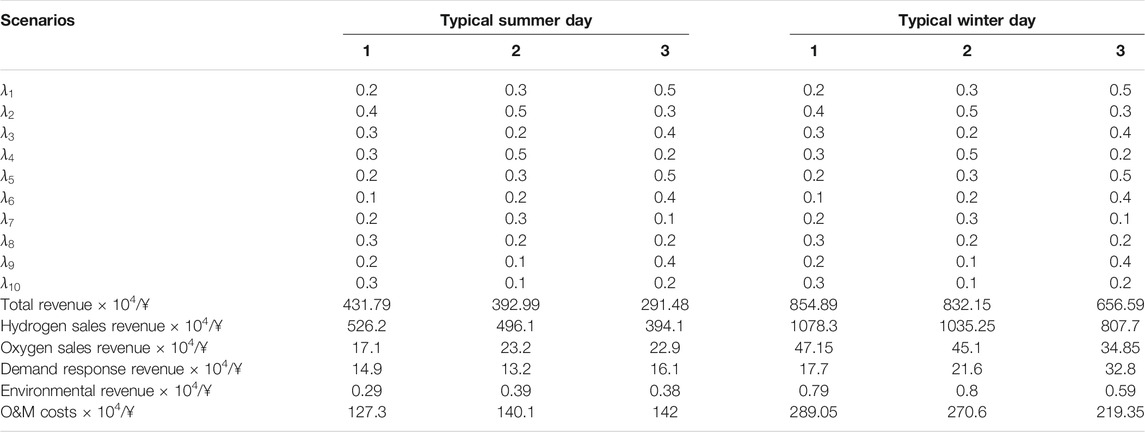
Different weighting factors are used for intra-day real-time scheduling, and the optimized scheduling results are shown in Table 4. It presents the results of three sets of weighting coefficients for summer and winter typical days. The weighting factors
Conclusion
In this paper, an EHCM model consisting of renewable energy generation, hydrogen production, hydrogen storage and PEMFC is built. A two-stage optimal scheduling model that considers the uncertainty of renewable energy generation is proposed. The two-stage scheduling scheme includes day-ahead optimized and MPC-based real-time optimized scheduling. The microgrid is required to meet hydrogen and electricity loads, while providing demand response ancillary services to the grid. Different scenarios are studied using examples to verify the effectiveness of the proposed method. The conclusions are as follows.
1) The EHCM model constructed in this paper provides electricity and hydrogen. The proposed two-stage optimization method can effectively improve the economic efficiency of the microgrid. Renewable energy generation increases and carbon emissions decrease. A win-win situation for both environmental protection and economic gain.
2) The microgrid model considers the nonlinear relationship between the hydrogen production flow of PEMEC and its power consumption, the dynamic characteristics of the PEMFC stack power generation, and the modal management method of PEMFC stack. It can effectively improve the hydrogen production capacity of EHCMs and significantly enhance the economic benefits.
3) The EHCM can provide demand response auxiliary services to the grid by using its energy storage and generation functions. It improves the economy of microgrids while providing stable support for the grid.
Data Availability Statement
The original contributions presented in the study are included in the article/Supplementary Material, further inquiries can be directed to the corresponding author.
Author Contributions
XL, WZ, and MH contributed to conception and design of the study. XL organized the database. YL performed the statistical analysis. WZ wrote the first draft of the manuscript. MH and YL wrote sections of the manuscript. All authors contributed to manuscript revision, read, and approved the submitted version.
Funding
This work was supported by the National Key R&D Program of China under grant (2018YFA0702200), the National Natural Science Foundation of China (62173074), the Key Project of National Natural Science Foundation of China (U20A2019).
Conflict of Interest
The authors declare that the research was conducted in the absence of any commercial or financial relationships that could be construed as a potential conflict of interest.
Publisher’s Note
All claims expressed in this article are solely those of the authors and do not necessarily represent those of their affiliated organizations, or those of the publisher, the editors and the reviewers. Any product that may be evaluated in this article, or claim that may be made by its manufacturer, is not guaranteed or endorsed by the publisher.
References
Berger, M., Radu, D., Fonteneau, R., Deschuyteneer, T., Detienne, G., and Ernst, D. (2020). The Role of Power-To-Gas and Carbon Capture Technologies in Cross-Sector Decarbonisation Strategies. Electric Power Syst. Res. 180, 106039. doi:10.1016/j.epsr.2019.106039
Chapman, A., Itaoka, K., Hirose, K., Davidson, F. T., Nagasawa, K., Lloyd, A. C., et al. (2019). A Review of Four Case Studies Assessing the Potential for Hydrogen Penetration of the Future Energy System. Int. J. Hydrogen Energ. 44 (13), 6371–6382. doi:10.1016/j.ijhydene.2019.01.168
El-Taweel, N. A., Khani, H., and Farag, H. E. Z. (2019). Hydrogen Storage Optimal Scheduling for Fuel Supply and Capacity-Based Demand Response Program Under Dynamic Hydrogen Pricing. IEEE Trans. Smart Grid 10 (4), 4531–4542. doi:10.1109/TSG.2018.2863247
El-Taweel, N. A., Khani, H., and Farag, H. E. Z. (2020). Optimal Sizing and Scheduling of Lohc-Based Generation and Storage Plants for Concurrent Services to Transportation Sector and Ancillary Services Market. IEEE Trans. Sustain. Energ. 11, 1381–1393. doi:10.1109/TSTE.2019.2926456
Farsangi, A. S. N., Hadayeghparast, S., Mehdinejad, M., and Shayanfar, H. (2018). A Novel Stochastic Energy Management of a Microgrid with Various Types of Distributed Energy Resources in Presence of Demand Response Programs. Energy 160, 257–274. doi:10.1016/j.energy.2018.06.136
Fikrt, A., Brehmer, R., Milella, V.-O., Müller, K., Bösmann, A., Preuster, P., et al. (2017). Dynamic Power Supply by Hydrogen Bound to a Liquid Organic Hydrogen Carrier. Appl. Energ. 194 (MAY15), 1–8. doi:10.1016/j.apenergy.2017.02.070
García, P., Torreglosa, J. P., Fernández, L. M., Jurado, F., Langella, R., and Testa, A. (2016). Energy Management System Based on Techno-Economic Optimization for Microgrids. Electric Power Syst. Res. 131 (FEB.), 49–59. doi:10.1016/j.epsr.2015.09.017
García, P., Torreglosa, J. P., Fernández, L. M., and Jurado, F. (2013). Optimal Energy Management System for Stand-Alone Wind Turbine/photovoltaic/hydrogen/battery Hybrid System with Supervisory Control Based on Fuzzy Logic. Int. J. Hydrogen Energ. 38 (33), 14146–14158. doi:10.1016/j.ijhydene.2013.08.106
H2 Industries (2022). LOHC Technology Turns Hydrogen into a Safe Power Storage Technology. Available at: https://h2-industries.com/zh-hans/technology/https://www.Hydrogenious.net/index.php/en/products (Accessed January 11, 2022).
Hydrogenious LOHC Technologies (2022). Products. Available at: https://www.Hydrogenious.net/index.php/en/products (Accessed January 11, 2022).
Jia, H., Wang, D., Xu, X., and Yu, X. (2015). Research on Some Key Problems Related to Integrated Energy Systems. Automation Electric Power Syst. 39 (07), 198–207. doi:10.7500/AEPS20141009011
Jin, C., Ren, D., Xiao, J., Hou, J., Du, E., and Zhou, Y. (2021). Optimization Planning on Power System Supply-Grid-Storage Flexibility Resource for Supporting the "carbon Neutrality" Target of China. Electric Power 54 (08), 164–174. doi:10.11930/j.issn.1004-9649.202012126
Kong, L., Yu, J., Cai, G., Wang, S., and Liu, C. (2021). Power Regulation of Off-Grid Electro-Hydrogen Coupled System Based on Model Predictive Control. Proc. CSEE 41 (09), 3139–3149. doi:10.13334/j.0258-8013.pcsee.200874
Li, Q., Pu, Y., Han, Y., and Chen, W. (2020). Hierarchical Energy Management for Electric-Hydrogen Island Direct Current Micro-grid. J. Southwest Jiaotong Univ. 55 (05), 912–919.
Li, Q., Zhao, S., Pu, Y., Chen, W., and Yu, J. (2021). Capacity Optimization of Hybrid Energy Storage Microgrid Considering Electricity-Hydrogen Coupling. Trans. China Electrotechnical Soc. 36 (03), 486–495. doi:10.19595/j.cnki.1000-6753.tces.200754
Li, Z., Zhang, F., Liang, J., Yun, Z., and Zhang, J. (2015). Optimization on Microgrid with Combined Heat and Power System. Proc. CSEE 35 (14), 3569–3576. doi:10.13334/j.0258-8013.pcsee.2015.14.011
Liu, M., Liang, X., Lin, Q., and Wang, L. (2021). Key Issues and Countermeasures of CCUS Projects Linking Carbon Emission Trading Market under the Target of Carbon Neutrality. Proc. CSEE 41 (14), 4731–4739. doi:10.13334/j.0258-8013.pcsee.210544
Liu, Z., Yu, S., and Liang, N. (2020). The Optimal Scheduling with Hydrogen Storage Participation for Interconnected Power System. Electric Power Sci. Eng. 36 (03), 45–51. doi:10.3969/j.ISSN.1672-0792.2020.03.007
Marini, S., Salvi, P., Nelli, P., Pesenti, R., Villa, M., Berrettoni, M., et al. (2012). Advanced Alkaline Water Electrolysis. Electrochimica Acta 82 (none), 384–391. doi:10.1016/j.electacta.2012.05.011
Mendis, N., Muttaqi, K. M., Perera, S., and Kamalasadan, S. (2015). An Effective Power Management Strategy for a Wind-Diesel-Hydrogen-Based Remote Area Power Supply System to Meet Fluctuating Demands Under Generation Uncertainty. IEEE Trans. Ind. Applicat. 51 (2), 1228–1238. doi:10.1109/TIA.2014.2356013
Muyeen, S. M., Takahashi, R., and Tamura, J. (2011). Electrolyzer Switching Strategy for Hydrogen Generation from Variable Speed Wind Generator. Electric Power Syst. Res. 81 (5), 1171–1179. doi:10.1016/j.epsr.2011.01.005
Niermann, M., Drünert, S., Kaltschmitt, M., and Bonhoff, K. (2019). Liquid Organic Hydrogen Carriers (LOHCs) - Techno-Economic Analysis of LOHCs in a Defined Process Chain. Energy Environ. Sci. 12 (1), 290–307. doi:10.1039/c8ee02700e
Pu, Y., Li, Q., Chen, W., Huang, W., Hu, B., Han, Y., et al. (2019). Energy Management for Islanded Dc Microgrid with Hybrid Electric-Hydrogen Storage System Based on Minimum Utilization Cost and Energy Storage State Balance. Power Syst. Techn. 43 (03), 918–927. doi:10.13335/j.1000-3673.pst.2018.1528
Qiu, Y., Zhou, S., Gu, W., Pan, G., and Chen, X. (2022). Proceedings of the CSEE (2022). Application Prospect Analysis of Hydrogen Enriched Compressed Natural Gas Technologies under the Target of Carbon Emission Peak and Carbon Neutrality. Available at: http://kns.cnki.net/kcms/detail/11.2107.TM.20211102.1629.005.html (Accessed February 7, 2022).
Ramachandran, R., and Menon, R. K. (1998). An Overview of Industrial Uses of Hydrogen. Int. J. Hydrogen Energ. 23 (7), 593–598. doi:10.1016/S0360-3199(97)00112-2
Recalde Melo, D. F., and Chang-Chien, L.-R. (2014). Synergistic Control Between Hydrogen Storage System and Offshore Wind Farm for Grid Operation. IEEE Trans. Sustain. Energ. 5 (1), 18–27. doi:10.1109/TSTE.2013.2272332
Reuß, M., Grube, T., Robinius, M., Preuster, P., Wasserscheid, P., and Stolten, D. (2017). Seasonal Storage and Alternative Carriers: A Flexible Hydrogen Supply Chain Model. Appl. Energ. 200, 290–302. doi:10.1016/j.apenergy.2017.05.050
Song, P., Hou, J., Mu, X., and Wang, X. (2021). Screening and Application Scenarios of Liquid Organic Hydrogen Carrier Systems. Nat. Gas Chem. Industry (C1 Chem. Chem. Engineering) 46 (01), 1–5+33.
Taube, M., Rippin, D., Cresswell, D., and Knecht, W. (1983). A System of Hydrogen-Powered Vehicles with Liquid Organic Hydrides. Int. J. Hydrogen Energ. 8 (3), 213–225. doi:10.1016/0360-3199(83)90067-8
Wang, C., Hong, B., Guo, L., Zhang, D., and Liu, W. (2013). A General Modeling Method for Optimal Dispatch of Combined Cooling, Heating and Power Microgrid. Proc. CSEE 33 (31), 26–33+3. doi:10.13334/j.0258-8013.pcsee.2013.31.006
Wang, H., Zhou, X., and Ouyang, M. (2017). Corrigendum to "Efficiency Analysis of Novel Liquid Organic Hydrogen Carrier Technology and Comparison with High Pressure Storage Pathway" [Int J Hydrogen Energy 41 (2016) 18062-18071]. Int. J. Hydrogen Energ. 42 (36), 23242. doi:10.1016/j.ijhydene.2017.06.189
Wu, M., Luo, Z., Ji, Y., Li, Y., and Kou, L. (2017). Optimal Dynamic Dispatch for Combined Cooling Heating and Power Microgrid Based on Model Predictive Control. Proc. CSEE 37 (24), 7174–7184+7431. doi:10.13334/j.0258-8013.pcsee.170576
Yang, M., Sun, Y., and Cheng, H. (2017). Comments on "Efficiency Analysis of Novel Liquid Organic Hydrogen Carrier Technology and Comparison with High Pressure Storage Pathway" [Int. J. Hydrogen Energy 41 (2016) 18062-18071]. Int. J. Hydrogen Energ. 42, S0360319917336625. doi:10.1016/j.ijhydene.2017.09.034
Zhang, X., Niu, H., and Zhao, J. (2017). Optimal Dispatch Method of Distribution Network with Microgrid. Trans. China Electrotechnical Soc. 32 (07), 165–173. doi:10.19595/j.cnki.1000-6753.tces.2017.07.019
Zhang, Y., Zhang, N., Dai, H., Zhang, S., Wu, X., and Xue, M. (2021). Model Construction and Pathways of Low-Carbon Transition of China’s Power System. Electric Power 54 (03), 1–11. doi:10.11930/j.issn.1004-9649.202101058
Zhou, C., Zheng, J., Jing, Z., Wu, Q., and Zhou, X. (2018). Multi-objective Optimal Design of Integrated Energy System for Park-Level Microgrid. Power Syst. Techn. 42 (06), 1687–1697. doi:10.13335/j.1000-3673.pst.2018.0280
Keywords: hydrogen generation, fuel cell, liquid organic hydrogen carrier, microgrid, renewable energy, grid auxiliary service
Citation: Liu X, Zhong W, Hou M and Luo Y (2022) Two-Stage Optimal Operation Management of a Microgrid Considering Electricity-Hydrogen Coupling Dynamic Characteristics. Front. Energy Res. 10:856304. doi: 10.3389/fenrg.2022.856304
Received: 17 January 2022; Accepted: 25 January 2022;
Published: 25 March 2022.
Edited by:
Wei Hu, Zhejiang University, ChinaReviewed by:
Xiangke Li, Hong Kong Polytechnic University, Hong Kong SAR, ChinaLili Cui, Shenyang Normal University, China
Copyright © 2022 Liu, Zhong, Hou and Luo. This is an open-access article distributed under the terms of the Creative Commons Attribution License (CC BY). The use, distribution or reproduction in other forums is permitted, provided the original author(s) and the copyright owner(s) are credited and that the original publication in this journal is cited, in accordance with accepted academic practice. No use, distribution or reproduction is permitted which does not comply with these terms.
*Correspondence: Xinrui Liu, bGl1eGlucnVpQGlzZS5uZXUuZWR1LmNu
 Xinrui Liu
 Weiyang Zhong
 Min Hou
 Yuqing Luo