 Bhargav Appasani
 Amitkumar V. Jha
 Kunjabihari Swain
 Murthy Cherukuri
 Dusmanta Kumar Mohanta
- 1School of Electronics Engineering, Kalinga Institute of Industrial Technology, Bhubaneswar, India
- 2Department of Electrical and Electronics Engineering, NIST Institute of Science and Technology, Berhampur, India
- 3Department of Electrical and Electronics Engineering, Birla Institute of Technology, Ranchi, India
The power grid is evolving into a smart grid due to the diverse energy generation and distribution. This complex grid has to be continuously monitored in real-time for its safe operation. Sensors known as phasor measurement units (PMUs) are used for obtaining health information pertaining to the grid in terms of time-synchronized voltage and current phasors. Measurements from several PMUs are sent through a synchrophasor communication network (SCN) to the phasor data concentrator (PDC). The PMUs, the PDC and the SCN together constitute the wide area measurement system (WAMS). Being an important constituent of the WAMS, the resiliency estimation of SCNs is paramount for their proper design. Resilience is a measure of the systems resistance to the disturbances or a measure of its ability to bounce back to a functional state in the event of failure. This paper presents a quantitative metric for estimating the resiliency of SCNs. Monte Carlo simulation (MCS) models are used to simulate random component failures, and the data is used for measuring the resiliency of the SCNs. A multi-objective genetic algorithm (GA) is used for optimizing the placement of PMUs and the PDC, to observe the power system with the minimum number of PMUs, and to simultaneously maximize the resilience. The practical power grid of West Bengal, India, is analyzed as a case study. This work can be a significant contribution to the power sector as it assists in the proper planning and placement of the communication infrastructure in a WAMS.
Introduction
The present-day power system is rapidly progressing in the fields of generation, transmission, and distribution of energy. Factors such as the diverse and distributed nature of power consumption, increased use of renewable energy that enables the consumer to be an energy provider, etc., have exacerbated the complexity of the power grid (Cascio et al., 2021). A glitch or a failure in one part of this complex network, unless espied and curtailed, can translate into a major power outage. This requirement has led to the inception of the Smart Grid (SG). The conventional supervisory control and data acquisition system (SCADA) which has its existence since a long time seems to be inefficient in capturing real-time dynamics of the power system due to its low resolution (typically one sample in every 2–4 s), lack of synchronization, lack of angle measurements, etc., (Usman and Faruque, 2019). Consequently, it was emphasized to use synchrophasor technology to envision true potential of the SG. An SG consists of several intelligent sensors known as the Phasor Measurement Units (PMUs) with advanced communication capabilities that collect, communicate and monitor the real-time information pertaining to the grid dynamics (Jha et al., 2019). Moreover, PMU is based on synchrophasor technology which has very high resolution, synchronized measurements of magnitude as well as angle, which seems to be far superior than SCADA in capturing real-time dynamics of the power system (Phadke and Thorp, 2017). The PMUs, PDC and their communication networks together constitute the wide area measurement system (WAMS) (Mohammadi et al., 2016).
The most general communication networks used in WAMS is deployed based on Internet Protocol (IP) which is vulnerable to the security threats. The threats such as denial of service (DoS), distributed denial of service (DDoS), etc., can affect the normal operation of the SG resulting in its degraded performance. Even the performance of the SG is hampered as a normal course of actions due to failure of several components in the communication network. Such disturbances degrade the performance of the communication networks and obstruct the power system operator’s situational awareness. Nevertheless, these challenges are indispensable in the communication network, and so in the SG. Consequently, it is more pertinent to consider these possibilities inherent to the communication network, and propose a communication network which is more resilient to such challenges. The resiliency of a communication network or a system is a measure of its ability to withstand a disturbance or to rapidly recover from the disturbances. These disturbances are due to the random failure of communication equipment or threats. Moreover, the PMUs can effectively communicate the synchrophasor measurements to the monitoring center using resilient communication network.
Motivation
Investigation of the resilience of these networks would help the system engineers in developing methods to enhance the resilience of the synchrophasor communication networks (SCNs) thereby providing the desired functionality even in the event of disturbances. The motivation for this work is to obtain a quantitative metric for measuring the resilience of the SCNs in the event of component failures. There are a few works related to the resiliency estimation of the SCNs, and an attempt is made to have a brief exposition so as to bring out the motivation for carrying out this work.
Literature Review
A comprehensive review on the communication technologies, architectures, and protocols for major smart grid applications has been presented in the works of Gungor et al. (2011). From the cyber physical perspective, the most comprehensive review on various aspects of the smart grid viz., communication technologies, standards, and challenges, have been presented by Jha et al. (2021d). The synchrophasor technologies have been shown to be one of the most widely used technologies in the real-time monitoring applications of the smart grid. Under the purview of synchrophasor technologies, the synchrophasor measurements, applications, and high speed sensors such as PMU, PDC, etc., are most comprehensively discussed (Phadke and Thorp, 2008; Ree et al., 2010; Bobba and Dagle, 2012), respectively. The communication infrastructure for the synchrophasor communication network with improved situational awareness has been proposed by Appasani et al. (2021). A risk assessment framework has been proposed for enhancing the resilience of the power system against cyber-attacks by Yan et al. (2013). Another risk assessment framework has been proposed by Appasani et al. for enhancing the resilience of PMU communication networks in the event of failure of communication networks et al (Appasani and Mohanta, 2017). Several researchers have embarked upon the assessment of resilience based upon the reliability estimation. A hierarchical Markov modeling technique to evaluate the reliability of PMU was presented by Wang et al. (2009). Murthy et al. have proposed a system of systems approach (Murthy et al., 2015) and a fuzzy type-2 approach (Murthy et al., 2014) for computing the reliability indices. From the communication infrastructure point of view, Ghosh et al. have investigated the impact of topological attributes on the placement of the communication infrastructure in an SG and proposed a graph theory-based approach for calculating the reliability parameters (Ghosh et al., 2013). A C-DAX architecture was proposed by Hoeflin et al. for investigating the reliability of smart grid communication infrastructure (Hoefling et al., 2015). Recently, methods have been proposed for constructing the SCNs and to investigate their effect on situational awareness of the grid operator (Appasani and Mohanta, 2018). In (Jha et al., 2021a), the authors combined both hardware failures and data loss to estimate the reliability of the SCNs. A similar approach was presented in (Jha et al., 2021c), to analyze the risk involved with the SCNs.
The survey on resiliency analysis of the smart grid with strategies, challenges, and research gaps are presented by Shittu et al. (2021). The trends on resiliency analysis in the distribution domain of the smart grid have been comprehensively reviewed by Sonal and Ghosh (2021). A resiliency model of transmission domain based on second-order programming for the smart grid is proposed in (Garifi et al., 2022). Under the influence of hurricanes, a resiliency model is proposed for the smart grid (Arab et al., 2015), incorporating the outage model, recovery model, and validation model. Based on the mining of the synchrophasor data, a distributed PMU network is modeled to enhance the resiliency of a communication network with various anomalies (Pandey et al., 2020). Various tools are used in the literature to model, simulate and validate the resiliency model in the paradigm of SG. Within the purview of cyber physical aspects of the SG, a panoramic survey is presented by Fan et al., where the state-of-the-art modeling and simulations approaches are analyzed from the literature (Fan et al., 2021). A platform known as SHARP-Net for modeling, simulation and validation of resiliency of PMU network has been proposed (Singh et al., 2020). An analytical approach for identifying risks and assessing their impacts on the operation of the SCN has been discussed in (Jha et al., 2021b). A review of these works indicates that there is a knowledge gap in the field of resilience investigation of SCNs. Most of these works assume the reliability of the communication networks or the risk assessment of these networks to be synonym with the resilience parameter. However, the resilience parameter is subtly different from these parameters and so the challenge is to properly frame a metric for quantifying the resilience of these networks.
Unique Contributions
The paper aims at developing the appropriate metrics for quantifying the resilience of the SCNs and to optimize these networks using the Genetic Algorithm (GA) optimization algorithm to enhance their resilience. The main contributions of this paper are:
1) Resiliency metric for estimating the resilience of SCNs has been derived based on the failure rates of the communication devices. The metric derived for evaluating the resilience not only uses the number of times a component fails but also that duration for which it remains in the failed state. Thus, the proposed approach doesn’t directly use the reliability for evaluation of resilience, as done in the previous works.
2) Monte-Carlo models are constructed to simulate equipment failures and obtain resilience metrics. Using this approach, uncertainties can also be incorporated in the failure rates of the constituent components, thereby getting a better estimate of the resilience.
3) Three different communication network topologies have been considered, and their resilience has been evaluated.
4) The resilience metrics were obtained for a practical power grid of India.
The research related to resilience investigation of the SCNs and their subsequent optimal placement to enhance the resilience would be of great importance to the power industry. These networks are part of the critical infrastructure of the nation’s power grid. Enhancing their resilience would improve the real-time monitoring of the grid and curtailing the propagation of catastrophic faults that may lead to a blackout.
Organization of the Work
The organization of the paper is as follows. The next section discusses the various communication architectures that will be employed for the SCNs. Three architectures, namely, dedicated, shared-wired, and shared-hybrid, are considered. Also, the components of the SCNs and their failure rates are presented. The third section describes the background related to the resiliency estimation of the SCNs. Monte-Carlo models for obtaining the resilience metrics are discussed in the fourth section, along with the optimal placement of PMU. In the fifth section, the developed resiliency metric is applied for the practical power grid of West Bengal, India.
An Overview on Communication Architectures for Synchrophasor Communication Networks
An SCN typically consists of PMUs which monitor the real-time data of the grid dynamics and communicate the data to PDCs. Since the PDC is located at the control center and PMUs are located at the grid substations, an SCN is used to connect PMUs and PDCs. Fiber-optic cables are used for communication as fiber optic cables are reliable for real-time applications. Three different topologies are considered for the SCN viz., dedicated-wired, shared-wired, and shared-hybrid.
Dedicated-Wired Synchrophasor Communication Networks
In the dedicated SCN, the PMUs and PDCs are connected using optical fiber cables, as shown in Figure 1. The backhaul network is based on an optical fiber core network which is used to connect PMUs and PDCs. Conventional PMUs are considered which unlike state-of-the-art PMUs, do not have various ports for interfacing. Thus, the optical transceiver (TxRx) is considered to facilitate synchrophasor data communication by resolving signal interoperability challenges at PMUs. The backhaul network consists of several optical devices used for networking such as optical switch, repeater, coupler, etc. To reduce the complexity, only the necessary components are considered to design the dedicated wired SCN. This is to emphasize that the repeater is of greater interest as its requirement entirely depends upon the distance between PMU and PDC. It is estimated that for every 100 Km distance, a repeater is required to maintain the signal quality (Khan et al., 2016). With respect to each PMU, a dedicated-wired network is needed, which is referred to as PMU Net. In the SCN, there may be more than one PMU. Thus, a network corresponding to PMU-N is designated as PMU Net-N. Like the PMU network, the dedicated network corresponding to PDC at the control center is known as PDC Net. It is worthy to note that the control center has some other end devices other than PDCs. Such a dedicated-wired SCN is shown in Figure 1, where N number of PMU networks and one PDC network are considered, which are connected over optical fiber-based backhaul network.
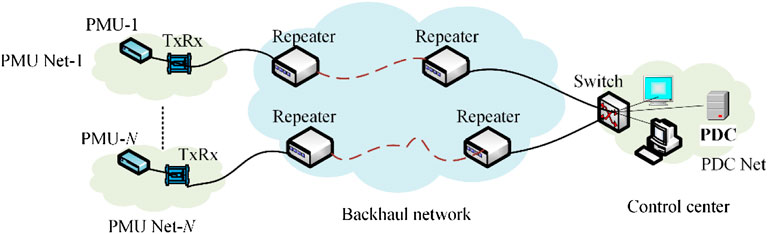
FIGURE 1. Dedicated-wired network topology.
Shared-Wired Synchrophasor Communication Networks
The shared-wired SCN uses a local area network (LAN) based on Ethernet protocol utilizing IEEE 802.3 standards for PMU network, as shown in Figure 2. As a result, the network comprising a PMU is referred to as PMU Ethernet network (PMU EtNet). Clearly, a shared wired SCN consists of more than one PMU. Thus, the network corresponding to PMU-N is designated as PMU EtNet-N. At the control center, PDC is also configured using a local area network based on Ethernet protocol utilizing IEEE 802.3 standards. Like the PMU network, the LAN corresponding to a PDC is known as PDC EtNet. The shared PMU network also consists of some other end devices (EDs). The traffic from RTU is regarded as the background traffic since the traffic from the PMU is of the point of interest from the perspective of synchrophasor applications. All PMU EtNet are connected to the PDC EtNet over an Internet protocol (IP) based backhaul network comprising of several networking components such as switch, router, bridge, gateway, etc. A shared-wired SCN is as shown in Figure 2. which consists of N PMU EtNet, and one PDC EtNet connected using IP based backhaul network.
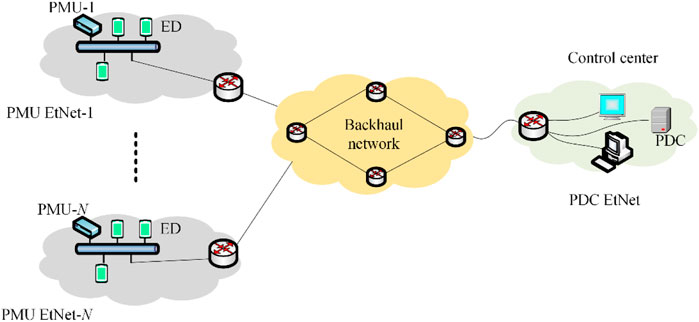
FIGURE 2. Shared-wired network topology.
Shared-Hybrid Synchrophasor Communication Networks
The shared-hybrid SCN uses a local area network (LAN) based on WiFi protocol utilizing IEEE 802.11 standards for PMU network, as shown in Figure 3. As a result, the network comprising of a PMU is referred to as PMU wireless network (PMU WiNet). The PMU is connected wirelessly to an access point (AP). This scenario occurs when a PMU is located remotely and wired cables cannot connect it to the router. Thus, the network corresponding to PMU-N is designated as PMU WiNet-N. However, at the control center, PDC is configured using a local area network based on Ethernet protocol utilizing IEEE 802.3 standards. Thus, the LAN corresponding to a PDC is known as PDC EtNet. The shared PMU network also consists of some other EDs. The traffic from RTU is regarded as the background traffic since the traffic from the PMU is of the point of interest from the perspective of synchrophasor applications. All PMUs and other end devices are interfaced using IEEE 802.11 standards to the access point (AP) for its operation creating infrastructure wireless LAN topology using a wireless module (WM). Further, each PMU WiNet is connected to the PDC EtNet over IP based backhaul network comprising of several networking components such as switch, router, bridge, gateway, etc. The shared-hybrid SCN shown in Figure 3, which consists of N PMU WiNet, and one PDC EtNet connected using IP based backhaul network.
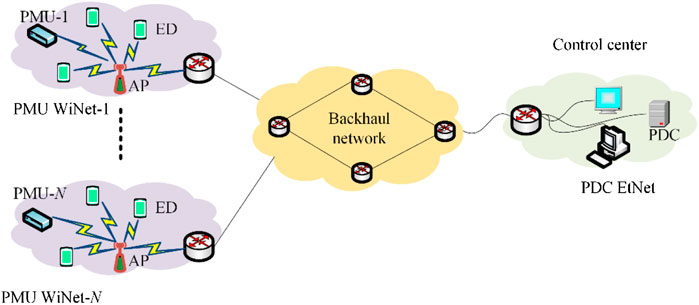
FIGURE 3. Shared-hybrid network topology.
The failure rates (number of failures per hour) and repair rates (number of repairs per hour) of the various components of the SCN are shown in Table 1. We assume that the backhaul network in case of shared-wired and shared-hybrid topologies has sufficient bandwidth and can never fail due to the alternative paths that it can provide for the transfer of data from PMU to the PDC.
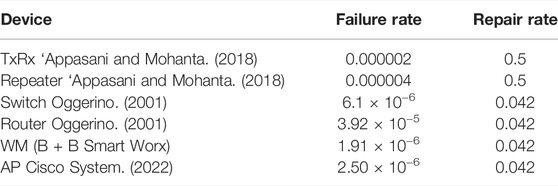
TABLE 1. Failure rates and repair rates of the various devices in an SCN.
Resiliency Estimation
Resilience is a measure of the systems resistance to the disturbances or a measure of its ability to bounce back to a functional state in the event of failure. One of the widely adopted assessment metric for resilience is given by Eq. 1 and is illustrated in Figure 4 (Bhusal et al., 2020).
where F(t) is the system’s performance as the function of time and F0 is the system’s performance in the fully functional state. t0 is the time at which the system begins its operations, te is the time at which the system’s performance begins to degrade. At td the system enters the failed state. At ts the system begins to regain its performance and at time tf the system enters a partially or fully functional state. In the fully functional state, all the equipment of the system is operational. In a semi-functional state, the system still delivers the required performance despite a few equipment, that is, not operational. Resilience is the ratio of actual functionality to that of the ideal functionality and can also be calculated over the entire operational time. The system’s performance degrades due to the failure of its components, and it returns to a semi-functional state when some of its components are repaired. The simplification of the expression in (Eq. 3) depends on the system. Series-parallel networks are used in this paper to obtain the resilience metric. The generic resiliency metric proposed by Bhusal et al. (2020), has been used in this work to derive the resilience for the SCN. Prior to this work nobody has used the performance function proposed by Bhusal et al. (2020). to evaluate the resilience of the SCN.
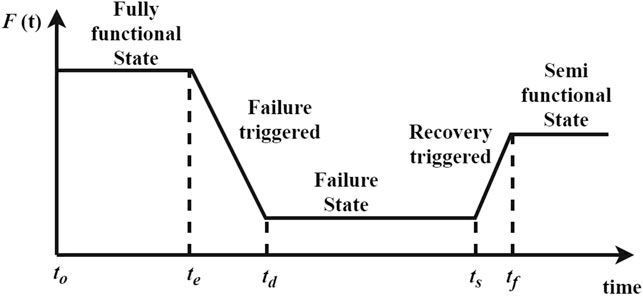
FIGURE 4. Performance curve for resilience assessment methodology.
A system containing several components can be modeled as a series-parallel network, as shown in Figure 5. The system with m parallel components shown in Figure 5A can only fail when all the redundant (parallel) components fail. The system with m series components shown in Figure 5B can fail when one of the series components fails. Figure 5C shows that the system can fail if both A and B fail or if either C or D fail. Series-parallel networks are widely used for estimating the reliability of a system. A similar approach can be taken to simplify the expression of resilience in Eq. 1. The performance curve for the system shown in Figure 5A is shown in Figure 6A, and the performance curve for the series network shown in Figure 5B is shown in Figure 6B. Based on these figures, the resilience metric is obtained for a parallel network and series system. Subsequently, these expressions are used to obtain the resilience metric for any system.
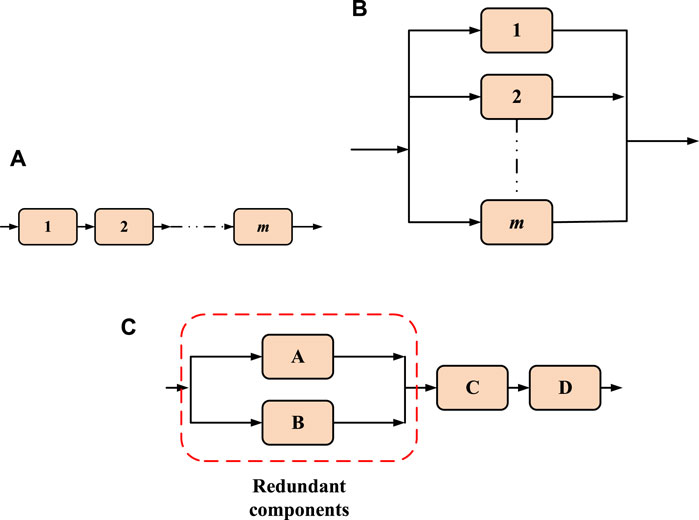
FIGURE 5. Series-parallel networks for system with (A) m parallel components (B) m series components (C) series-parallel components.
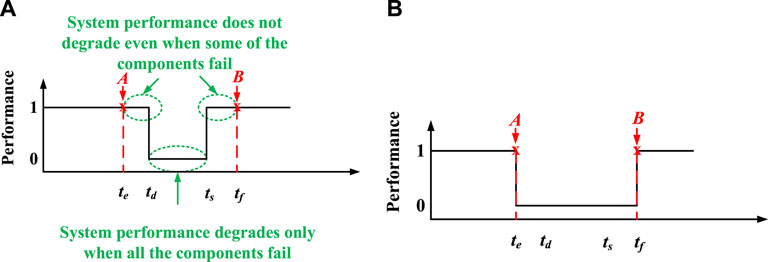
FIGURE 6. Performance curve for (A) a parallel network (B) a series network.
In Figure 6A, at point A, one or more than one parallel component fails, but the system’s performance does not degrade. The system’s performance becomes zero only when all the m parallel components fail. If the system’s operational time is T, then its resilience is given by the Eq. 2.
On the other hand, the series network performs only when all the components in the series are fully functional. If any of those components fail, its performance becomes zero. If the system’s operational time is T, then its resilience is given by the Eq. 3.
Assuming that no two components in the system fail simultaneously, the resilience of a system having m blocks with redundant components (parallel networks) and p blocks without any redundancy is given by the Eq. 4.
where T is the total operation time, and ni is the number of times the ith block with redundancy fails. The assumption that no two components can fail simultaneously holds in the milieu of low failure rates of the components. Moreover, the difference td – ts and tf – te is the time for which the parallel network block and the series network block remain in the failed state and is referred to as the downtime (DT). Thus, the Eq. 4 can be further simplified as:
The assessment metric given by Eq. 7 is very difficult to apply in the milieu of systems with several components such as the SNCs. The approach requires the need to identify all possible modes of failure. The alternative is to use the Monte-Carlo simulation. The latter approach would be computationally intensive but would provide accurate results as it can also accommodate the uncertainties involved in the failure of the components. Once the Monte-Carlo models are developed to obtain the resilience metrics, they can be used to obtain the practical SCNs.
Monte-Carlo Simulation Models and Optimal Placement of Phasor Measurement Units
The various components in an SCN can be modeled as a series-parallel network. It is assumed that the fiber-optic cable between the various entities does not fail. Two scenarios are considered, with and without redundancy. In case of redundancy that every other component has a redundant component. The series-parallel networks for the three different architectures with component redundancy are shown in Figure 7. The series-parallel networks of different SCNs viz., dedicated-wired, shared-wired, and shared-hybrid SCNs are designed in such a way that only critical networking components are considered for redundancy configuration. As an e.g., for the dedicated-wired SCN shown in Figure 1, only redundancy of transceiver, repeaters, and switch are considered in its series-parallel network representation which is as shown in Figure 7A. Similarly, for the shared-wired SCN shown in Figure 2, the PMU router and PDC router are considered in redundancy configuration for designing its series-parallel network which is as shown in Figure 7B. Likewise, for the shared-hybrid SCN shown in Figure 3, in addition to the PMU router and PDC router, WM, and AP are considered in redundancy configuration for designing its series-parallel network which is as shown in Figure 7C.
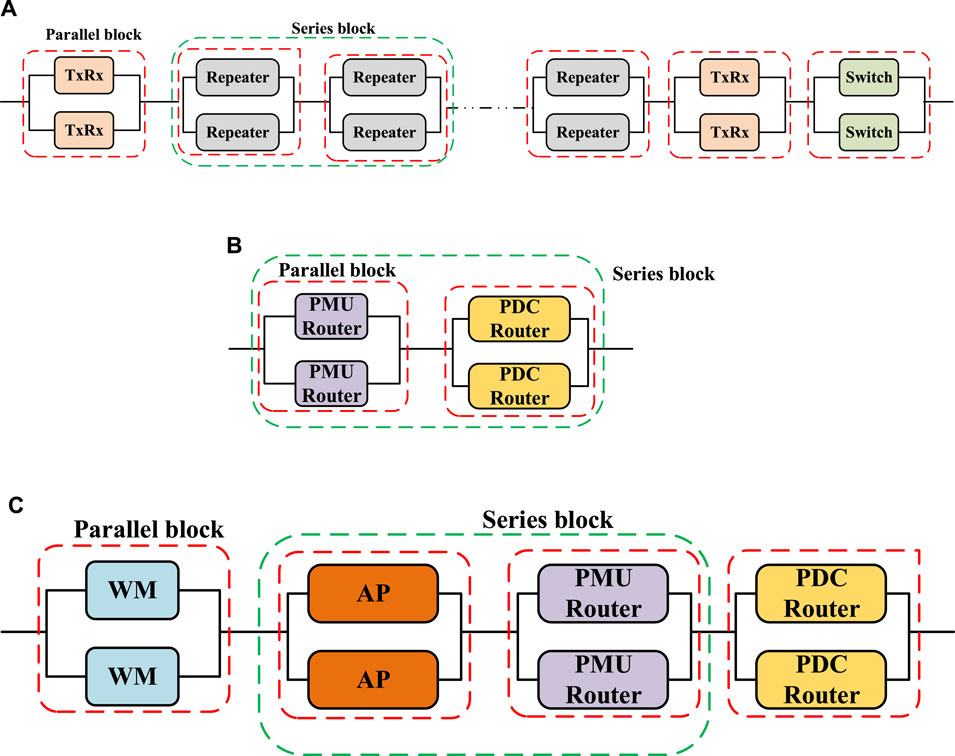
FIGURE 7. Series-parallel networks with redundant component (A) dedicated-wired (B) shared-wired (C) shared-hybrid.
Monte-Carlo Model for Simulating Random Component Failures
Monte-Carlo models are needed to obtain the parameters in Eq. 5. The total operation time is considered as 20 million years or 175200 million hours. The results obtained were the average value taken from 10 million runs. To add uncertainties to the model, the time-to-failure (TTF) and the time-to-repair (TTR) values for the various components are generated randomly using the following equations. TTF is the time taken by a system or a component to fail, whereas TTR is the time taken to repair the system.
where
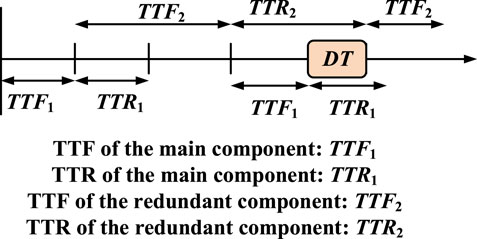
FIGURE 8. Monte-Carlo Model for obtaining the resilience metric.
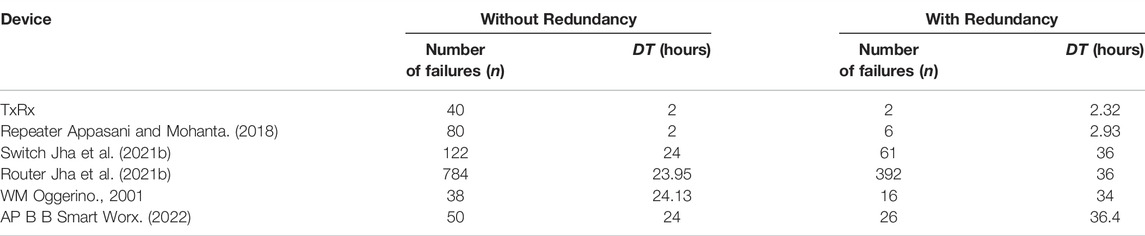
TABLE 2. Parameters obtained from the Monte-Carlo simulation with and without redundancy.
The resilience of the system can be calculated using Eq. 7. However, the number of repeaters needed for the SCN in the case of a dedicated-shared architecture depends on the location of the PMUs. So, it is needed to optimally place the PMUs and the PDC for observing the total system and at the same time to maximize the resilience of the system. This can be achieved using a multi-objective GA.
Optimal Phasor Measurement Units-Placement
The power grid can be observed without the need for placing the PMUs on all the electrical buses (Appasani and Mohanta, 2018). The PMUs and the PDC can be placed optimally not only to observe the entire power grid but also to maximize the resilience of the SCNs. A multi-objective GA is used to achieve this objective for a dedicated-wired topology. GA is a widely used optimization technique for solving practical problems. It is an evolutionary optimization technique that starts with an initial population of several individuals. Each individual represents a potential solution to the problem. These individuals evolve over a few generations. The individuals evolve, based on three operations:
• Reproduction: Based on the objective function a few individuals are selected at each step to produce individuals for the next generation
• Crossover: Next the individuals are grouped into pairs to generate off-springs who would be used in the next generation.
• Mutation: The off-springs generated are subjected to random mutations to create evolution.
An electric network having a buses can be described using a matrix A, which shows the connections between the buses. The matrix is called as the adjacency matrix and is given by Eq. 8. To indicate the presence of a PMU at a bus another matrix B is used, whose elements are given by (Eq. 9). The number of PMUs is given by NPMU and the numbers buses that are not observable with these PMUs is given by NUN. These are given by Eq. 10.
Shared topologies need not be concerned with the problem of maximizing resilience, as the metric is not dependent on the number of repeaters. The two objective functions to be minimized using the multi-objective GA are given by Eqs 11, 12. Eq. 11 takes a minimum value, when minimum number of PMUs (NPMU) are needed to observe the power system completely (Appasani and Mohanta, 2018). When the power system is completely observable, then NUN = 0.
Case Studies and Discussions
A case study is considered of the power grid of West Bengal, India. It is a regional grid consisting of 24 electric buses, and the grid topology is shown in Figure 9. The geographical coordinates of the electrical buses are available in (Appasani and Mohanta, 2018). The number of generator buses is 09, the number of load buses is 10, maximum number of connected lines to a bus is 05 and the reference bus location is the generator bus having the highest capacity compared to other generator buses.
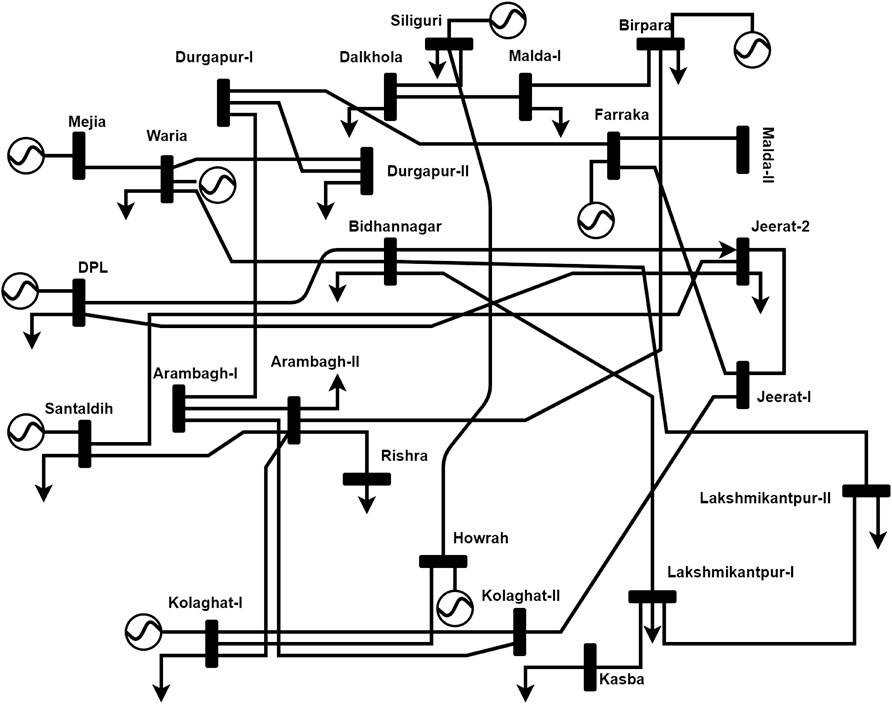
FIGURE 9. Grid connections in West Bengal (India) [17].
The number of repeaters needed for a dedicated-wired SCN depends on the distance between the PMU and the PDC. This distance is calculated in kilometers using the Haversine formula.
where ϕ1, ϕ2, and φ1, φ2 are latitudes and longitudes of the locations, R is the radius of the earth in kilometers. Subsequently, the optimal number of PMUs needed to completely observe this grid are determined using the multi-objective GA. This algorithm has been implemented using MATLAB software. Also, the location of the PDC is determined for maximizing the operational resiliency of the SCNs over an operational time period of 5 years or 43,800 h. No component redundancy is considered for the determination of the PMU location. The parameters of the multi-objective GA are set as: population size is 500, Pareto fraction is 0.35, and the maximum generations is 1000. The Pareto front for the optimization is shown in Figure 10. The results are reported in Table 3.
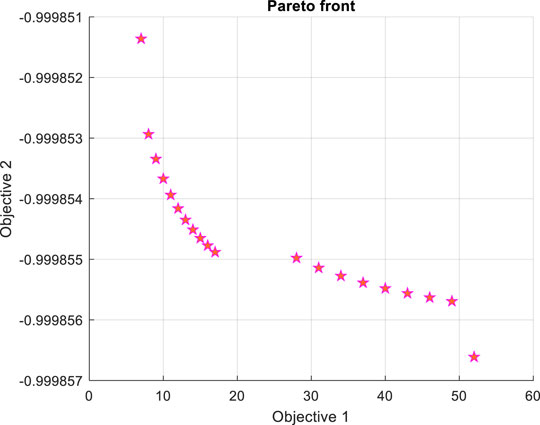
FIGURE 10. Pareto front for multi-objective GA.
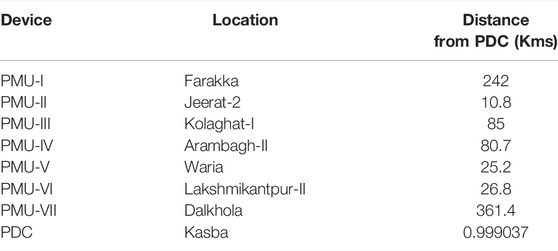
TABLE 3. Optimum location PMUs and the PDC.
The same locations for the PMUs and the PDC are used for calculating the resilience metric for shared-wired and shared hybrid topology. The three topologies are compared in terms of resilience in Figure 11.
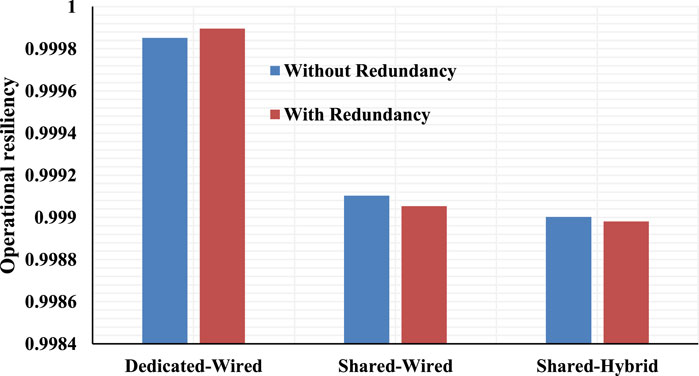
FIGURE 11. Operational resilience metric for the three topologies for the operational time of 5 years.
The results shown in Figure 11 indicate that adding redundancy improves the operational resilience metric for the dedicated-wired topology. In the case of shared-wired and shared hybrid, redundancy decreases the resilience. Also, it is observed that the operational resilience of shared-wired topology and shared-hybrid topology is lower than that of the dedicated-wired topology. The passive components used for the design of the dedicated-wired networks have lower failure rates than the active components used for the design of the shared topologies as seen in Table 1. This is further justified by the high number of failures of the components used for designing the shared topologies shown in Table 2. Moreover, this should be accepted with a bit of caution. The shared topologies provide alternative paths for data communication in the event of the failure of intermediate routers. However, the overall delay increases, and the performance of the network degrades. The proposed metric only considers the hardware performance, and a more pragmatic result can be achieved by incorporating a means for software failures. Next, the effect of operational time on the resilience of the SCNs is plotted in Figure 12.
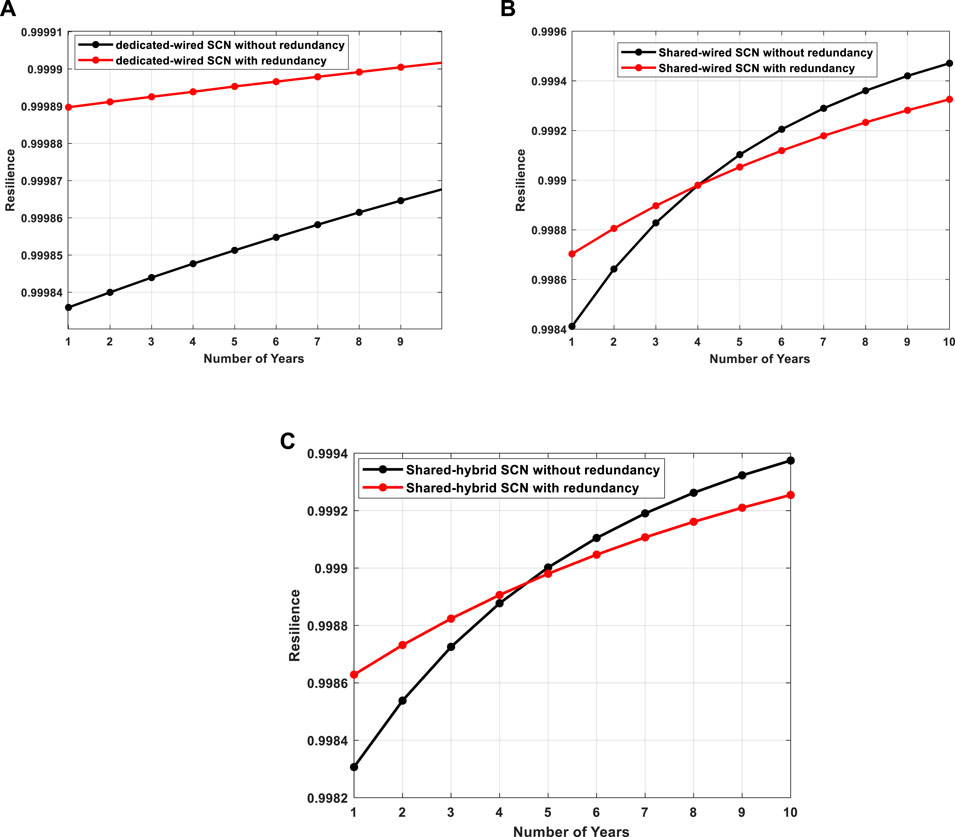
FIGURE 12. Operational resilience metric as a function of operational time for (A) Dedicated-wired (B) Shared-wired (C) Shared-hybrid topology.
The resilience of the system increases as the operational time increases for all the topologies. However, in the case of shared topologies, the resilience of a network with component redundancy is lower than the network without redundancy, when the operational time increases beyond 5 years. When the operational time is less than 5 years, redundancy increases the resilience of the SCN. The reduction in the resiliency after the inclusion of redundant components is because of the operational time parameter present in the resilience metric. When the operational time is taken as 20 million years, the failure frequency of the components used for shared topologies decrease by half when redundancy is used whereas for dedicated networks, redundancy decreases the failure frequency by a factor of 20. Thus, for dedicated networks redundancy increases the resiliency, whereas for shared topologies the operational time plays an important role in the network resiliency as failure frequency has reduced only by a factor of two for operational time of 20 million years. When the WAMS is planned with a shared topology for its SCN, if the operational time is more than 5 years, component redundancy is not necessary. With dedicated-wired topology, using redundancy improves the network’s operational resilience.
Conclusion
SCN is an essential component of the WAMS, and its resilience is necessary. In this work, an approach has been presented to analyze the network resilience considering hardware failures in three different topologies. The resilience metric has been derived and was demonstrated with the case study of a practical power grid of India. The PMUs were optimally placed, and their SCNs were analyzed for resilience. The resilience of dedicated-wired networks was the highest, and component redundancy further improved the resilience. Shared networks can be employed without redundancy if the operational time of the network is less than 5 years. The paper presents a general approach for analysing network resilience based on hardware failures. The software failures in terms of data packets lost should be incorporated to get a refined estimate of network resilience, which will be considered in future work. Also, the effect of cyber-attacks on network resilience will be considered in future work.
Data Availability Statement
The original contributions presented in the study are included in the article/Supplementary Material, further inquiries can be directed to the corresponding author.
Author Contributions
All authors listed have made a substantial, direct, and intellectual contribution to the work and approved it for publication.
Conflict of Interest
The authors declare that the research was conducted in the absence of any commercial or financial relationships that could be construed as a potential conflict of interest.
Publisher’s Note
All claims expressed in this article are solely those of the authors and do not necessarily represent those of their affiliated organizations, or those of the publisher, the editors and the reviewers. Any product that may be evaluated in this article, or claim that may be made by its manufacturer, is not guaranteed or endorsed by the publisher.
References
Appasani, B., Jha, A. V., and Mishra, S. K. (2021). Communication Infrastructure for Situational Awareness Enhancement in WAMS with Optimal PMU Placement. Prot. Control. Mod. Power Syst. 6 (9), 1–12. doi:10.1186/s41601-021-00189-9
Appasani, B., and Mohanta, D. K. (2018). Co-Optimal Placement of PMUs and Their Communication Infrastructure for Minimization of Propagation Delay in the WAMS. IEEE Trans. Ind. Inf. 14 (5), 2120–2132. doi:10.1109/tii.2018.2799659
Appasani, B., and Mohanta, D. K. (2017). Optimal Placement of Synchrophasor Sensors for Risk Hedging in a Smart Grid. IEEE Sensors J. 17 (23), 7857–7865. doi:10.1109/jsen.2017.2742524
Arab, A., Khodaei, A., Zhu Han, Z., and Khator, S. K. (2015). Proactive Recovery of Electric Power Assets for Resiliency Enhancement. IEEE Access 3, 99–109. doi:10.1109/ACCESS.2015.2404215
B B Smart Worx (2022). Secure, Rugged Embedded Wi-Fi Modules. Available at: http://192.237.147.184/pdf/library/WLNN-xx-P551_Eth.DualBandWiFiModules_4417ds.pdf (accessed: Jan 11, 2022).
Beg Mohammadi, M., Hooshmand, R.-A., and Haghighatdar Fesharaki, F. (2016). A New Approach for Optimal Placement of PMUs and Their Required Communication Infrastructure in Order to Minimize the Cost of the WAMS. IEEE Trans. Smart Grid 7 (1), 84–93. doi:10.1109/TSG.2015.2404855
Bhusal, N., Abdelmalak, M., Kamruzzaman, M., and Benidris, M. (2020). Power System Resilience: Current Practices, Challenges, and Future Directions. IEEE Access 8, 18064–18086. doi:10.1109/ACCESS.2020.2968586
Bobba, R. B., Dagle, J., Heine, E., Khurana, H., Sanders, W. H., Sauer, P., et al. (2012). Enhancing Grid Measurements: Wide Area Measurement Systems, NASPInet, and Security. IEEE Power Energ. Mag. 10 (1), 67–73. doi:10.1109/mpe.2011.943133
Cisco System (2022). Cisco Aironet 1300 Series Outdoor Access Point/Bridge, Cdn. Available at: https://www.cisco.com/c/en/us/support/docs/wireless/aironet-1200-series/21480-350power-21480.html?dtid=osscdc000283#powerinjectoraa (Accessed: Jan 11, 2022).
De La Ree, J., Centeno, V., Thorp, J. S., and Phadke, A. G. (2010). Synchronized Phasor Measurement Applications in Power Systems. IEEE Trans. Smart Grid 1 (1), 20–27. doi:10.1109/tsg.2010.2044815
Fan, H., Wang, H., Xia, S., Li, X., Xu, P., and Gao, Y. (2021). Review of Modeling and Simulation Methods for Cyber Physical Power System. Front. Energ. Res. 9, 166. doi:10.3389/fenrg.2021.642997
Garifi, K., Johnson, E. S., Arguello, B., and Pierre, B. J. (2022). Transmission Grid Resiliency Investment Optimization Model with SOCP Recovery Planning. IEEE Trans. Power Syst. 37 (1), 26–37. doi:10.1109/TPWRS.2021.3091538
Ghosh, D., Ghose, T., and Mohanta, D. K. (2013). Reliability Analysis of Geographic Information System (GIS) Aided Optimal Phasor Measurement Unit Location for Smart Grid Operation. Proc. Inst. Mech. Eng. O: J. Risk Reliability.
Gungor, V. C., Sahin, D., Kocak, T., Ergut, S., Buccella, C., Cecati, C., et al. (2011). Smart Grid Technologies: Communication Technologies and Standards. IEEE Trans. Ind. Inf. 7 (4), 529–539. doi:10.1109/tii.2011.2166794
Hoefling, M., Florian, H., and Michel, M. (2015). Enabling Resilient Smart Grid Communication over the Information-Centric C-DAX Middleware. Int. Conf. Workshops Networked Syst. (Netsys) Cottbus, 1–8. doi:10.1109/netsys.2015.7089080
Jha, A. V., Appasani, B., Ghazali, A. N., and Bizon, N. (2021b). A Comprehensive Risk Assessment Framework for Synchrophasor Communication Networks in a Smart Grid Cyber Physical System with a Case Study. Energies 14 (12), 3428. doi:10.3390/en14123428
Jha, A. V., Appasani, B., Ghazali, A. N., Pattanayak, P., Gurjar, D. S., Kabalci, E., et al. (2021d). Smart Grid Cyber-Physical Systems: Communication Technologies, Standards and Challenges. Wireless Netw. 27 (4), 2595–2613. doi:10.1007/s11276-021-02579-1
Jha, A. V., Appasani, B., and Ghazali, A. N. (2019). “Performance Evaluation of Routing Protocols in Synchrophasor Communication Networks,” in International Conference on Information Technology (ICIT), Bhubaneswar, India, December 19–21, 2019, 132–136. doi:10.1109/ICIT48102.2019.00030
Jha, A. V., Ghazali, A. N., Appasani, B., and Mohanta, D. K. (2021c). “Risk Identification and Risk Assessment of Communication Networks in Smart Grid Cyber-Physical Systems,” in Smart Grid Cyber-Physical Systems. Security in Cyber-Physical Systems: Foundations and Applications. Editors A. I. Awad, S. Furnell, M. Paprzycki, and S. K. Sharma, 217–253. doi:10.1007/978-3-030-67361-1_8
Jha, A. V., Ghazali, A. N., Appasani, B., Ravariu, C., and Srinivasulu, A. (2021a). Reliability Analysis of Smart Grid Networks Incorporating Hardware Failures and Packet Loss. Rev. Roum. Sci. Tech. El 65 (3), 245–252.
Khan, F., Rehman, A. U., Arif, M., Aftab, M., and Jadoon, B. K. (2016). “A Survey of Communication Technologies for Smart Grid Connectivity,” in 2016 International Conference on Computing, Electronic and Electrical Engineering (ICE Cube), Quetta, Pakistan, April 11–12, 2016, 256–261. doi:10.1109/ICECUBE.2016.7495234
Lo Cascio, E., Girardin, L., Ma, Z., and Maréchal, F. (2021). How Smart Is the Grid? Front. Energ. Res. 9 (9), 326. doi:10.3389/fenrg.2021.637447
Murthy, C., Roy, D. S., and Mohanta, D. K. (2015). Reliability Evaluation of Phasor Measurement Unit: A System of Systems Approach. Electric Power Components Syst. 43 (4), 437–448. doi:10.1080/15325008.2014.989378
Murthy, C., Varma, K. A., Roy, D. S., and Mohanta, D. K. (2014). Reliability Evaluation of Phasor Measurement Unit Using Type-2 Fuzzy Set Theory. IEEE Syst. J. 8 (4), 1302–1309. doi:10.1109/jsyst.2014.2309191
Oggerino, C. (2001). High Availability Network Fundamentals. Indianapolis, United States: Cisco Press.
Pandey, S., Chanda, S., Srivastava, A. K., and Hovsapian, R. O. (2020). Resiliency-Driven Proactive Distribution System Reconfiguration with Synchrophasor Data. IEEE Trans. Power Syst. 35 (4), 2748–2758. doi:10.1109/TPWRS.2020.2968611
Phadke, A. G., and Thorp, J. S. (2008). Phasor Measurement Units and Phasor Data Concentrators. Synchronized Phasor Measurements Its Appl. 5, 93–105. doi:10.1007/978-0-387-76537-2_5
Phadke, G., and Thorp, J. (2017). Synchronized Phasor Measurements and Their Applications. 2nd edn.USA: Springer.
Shittu, E., Tibrewala, A., Kalla, S., and Wang, X. (2021). Meta-Analysis of the Strategies for Self-Healing and Resilience in Power Systems. Adv. Appl. Energ. 4, 100036. doi:10.1016/j.adapen.2021.100036
Singh, V. K., Vaughan, E., and Rivera, J. (2020). SHARP-net: Platform for Self-Healing and Attack Resilient PMU Networks. IEEE Power & Energy Society Innovative Smart Grid Technologies Conference ISGT, 1–5.
Sonal, , and Ghosh, D. (2021). Novel Trends in Resilience Assessment of a Distribution System Using Synchrophasor Application: A Literature Review. Int. Trans. Electr. Energ. Syst. 31 (8), e12934. doi:10.1002/2050-7038.12934
Usman, M. U., and Faruque, M. O. (2019). Applications of Synchrophasor Technologies in Power Systems. J. Mod. Power Syst. Clean. Energ. 7 (2), 211–226. doi:10.1007/s40565-018-0455-8
Wang, Y., Li, W., and Lu, J. (2009). Reliability Analysis of Phasor Measurement Unit Using Hierarchical Markov Modeling. Electric Power Components Syst. 37 (5), 517–532. doi:10.1080/15325000802599361
Keywords: phasor measurement unit, Monte-Carlo simulation, communication, genetic algorithm, resilency
Citation: Appasani B, Jha AV, Swain K, Cherukuri M and Mohanta DK (2022) Resiliency Estimation of Synchrophasor Communication Networks in a Wide Area Measurement System. Front. Energy Res. 10:854676. doi: 10.3389/fenrg.2022.854676
Received: 14 January 2022; Accepted: 10 March 2022;
Published: 04 April 2022.
Edited by:
Robert Eriksson, Royal Institute of Technology, SwedenReviewed by:
Karl Svensson, Linköping University, SwedenTin Rabuzin, Royal Institute of Technology, Sweden
Muhammad Shoaib Almas, Hitachi Energy, Sweden
Copyright © 2022 Appasani, Jha, Swain, Cherukuri and Mohanta. This is an open-access article distributed under the terms of the Creative Commons Attribution License (CC BY). The use, distribution or reproduction in other forums is permitted, provided the original author(s) and the copyright owner(s) are credited and that the original publication in this journal is cited, in accordance with accepted academic practice. No use, distribution or reproduction is permitted which does not comply with these terms.
*Correspondence: Dusmanta Kumar Mohanta, ZGttb2hhbnRhQGJpdG1lc3JhLmFjLmlu
†These authors have contributed equally to this work and share first authorship
‡These authors have contributed equally to this work
§These authors share senior authorship