 Minglei Shan
 Yu Yang
 Xuefen Kan
 Fangyong Shu
 Qingbang Han
- 1Jiangsu Key Laboratory of Power Transmission and Distribution Equipment Technology, Hohai University, Changzhou, China
- 2College of Computer and Information, Hohai University, Nanjing, China
The internal temperature distribution and evolution in cavitation bubble can be investigated numerically by a thermal lattice Boltzmann method. The simulation results are consistent with the calculational results of the Rayleigh-Plesset equation and the temperature equation when the cavitation bubble collapses in an infinite liquid medium and satisfy Laplace’s law. In this work, a cavitation bubble collapsing near a solid wall is explored to investigate the characteristics and effects of the bubble temperature. The progress of the bubble temperature can be clearly captured from a two-dimensional temperature field. The results show that the bubble temperature can reach extremely high values during both its first and its second collapse. The change of the bubble temperature is highly related to the jet velocity and the liquid pressure. Furthermore, the effects on the bubble temperature of the offset parameters, the initial driving pressure and the initial bubble radius are also studied. The present findings are meaningful for the research of thermodynamics of cavitation.
Introduction
Cavitation is usually associated with a decrease in the operational efficiency of device, surface destruction of bodies operating under cavitation conditions (Chahine and Hsiao, 2015). However, the current research on cavitation has achieved the transformation from cavitation damage to rational utilization. For example, cavitation cleaning technology is used to clean the surface of cracks, ultrasonic cleaning technology of glasses, and the use of cavitation bubbles as a transport tool for drugs to deliver drugs to the surface of diseased tissue (Ohl et al., 2006; Verhaagen and Fernández Rivas, 2016; Meullemiestre et al., 2017). The main mechanism of cavitation damage was generally considered to be the effect of micro jets and shock waves (Brennen, 2005; Mason, 2016). In addition to the mechanical mechanism, the thermal effect produced by cavitation is also important in causing material cavitation damage because of the high temperature achieved when the bubble collapses (Suslick et al., 2011; Yusof et al., 2016).
However, there is no definite conclusion about the internal temperature of the bubble because the high temperature in the process of rapid collapse is local and transient. Nowotny (Nowotny, 1942) and Gavranek et al. (Gavranek et al., 1960) observed that the high temperature of the bubble in the final stage of collapse will reduce the strength of metal and can melt a metal surface. Also, because of the fluid medium, the rates of heating and cooling can be more than 1100 K/s (Suslick and Flannigan, 2008), making it difficult to directly measure bubble temperature. Many efforts, both calculations and experiments, have been devoted to investigating the bubble temperature and its effects (Tomita and Shima, 1986; Wang et al., 2001; Cervone et al., 2005; Fujikawa et al., 2006; Dular and Coutier-Delgosha, 2013). However, the cavitation bubble temperatures obtained by theory and by experiment are quite different, so it is not yet possible to from a definite conclusion. In addition, experiments still have not revealed the internal mechanism of the temperature change and distribution in a bubble, numerical simulation methods have become a powerful way to better understand.
The lattice Boltzmann method (LBM), a mesoscopic numerical approach, has been applied to complex multiphase flow fields (Gonnella et al., 2007; Dong et al., 2009; Safari et al., 2010; Gan et al., 2015). The LBM is easy to implement and parallelize, and has clear physical background and high computational efficiency. As one of them, the pseudopotential Shan-Chen (SC) lattice Boltzmann (LB) model has been widely used by the LB community. The most remarkable feature of the SC LB model approach is that the phase separation automatically without interface tracking or interface capturing via an interparticle potential. The first thermal LBM based on the SC model may be credited to Zhang and Chen (Zhang and Chen, 2003). Later, Házi and Márkus (Házi and Márkus, 2008; Márkus and Házi, 2011), Biferale et al. (Biferale et al., 2012; Biferale et al., 2013), and Gong et al. (Gong and Cheng, 2012; Liu and Cheng, 2013) also proposed thermal LB models. The common feature of these models is to solve the thermal LB equation with temperature distribution function to restore the Navier-Stokes-level macroscopic temperature equation. The target temperature equation is a convection-diffusion equation including the source term. Then, based on the above studies, Li et al. (Li et al., 2017) revised the existing thermal model to eliminate the discrete effect of the source term in the target temperature equation, and proposed an improved thermal multi-relaxation-time (MRT) LB model at the same time.
Based on this, Shan et al. (Shan et al., 2016; Shan et al., 2017; Yang et al., 2020; Yang et al., 2021) adopted the above-mentioned thermal MRT LBM to simulate the collapse of the cavitation bubble near the solid wall. The temperature change and dynamic behavior of the bubble were well captured. Previous studies focused on the stage after the cavitation bubble collapsed, but did not deeply analyze the characteristics and effects of the time-dependent bubble temperature. However, both driving pressure and bubble radius affect the temperature in the bubble. An increase of the equilibrium bubble radius will gradually reduce the temperature in the bubble, while an increase of the driving pressure will gradually increase its temperature (Flannigan and Suslick, 2005; Huai et al., 2011). Therefore, the mechanism and effect of the bubble temperature deserve further study.
In this work, an improved thermal MRT LBM is used to investigate cavitation bubble temperature evolution when cavitation bubble collapses near a wall. The basic numerical model is formulated in Section Numerical Model. The validation of Laplace’s law and the Rayleigh-Plesst equation are described in Section Model Validation. Numerical simulations of the bubble collapse near solid wall are presented in Section Numerical Results, which also includes further analysis and discussion. Finally, Section Conclusion gives brief conclusions.
Numerical Model
The fluid field can be described by density distribution functions. Based on MRT collision operator, the extended LB equation of the density distribution function with external force term can be given as (He et al., 1999; Lallemand and Luo, 2000)
where
where c is the lattice constant, which equal to
where
where
The collision process of momentum space can be transformed from Eq. 1 into
where
The Streaming Process is Shown as
where
where the fluid-fluid interactive force is
where
where
where
For the D2Q9 lattice, Li et al.’s (Li et al., 2012; Li et al., 2013) forcing scheme can be given by
The adjustable coefficient
Now turns to solving the temperature equation, the target temperature equation is written as (Guo et al., 2002; Li et al., 2016)
where the thermal diffusivity is
The discrete equation of temperature distribution function can be given by
where
Eq. 15 can be converted as follows
where
Q is the source term in the momentum space, which is shown as
where
The streaming process of temperature function is similar to Eq. 7
where
Model Validation
Laplace’s Law
Laplace’s law states that in the case of cavitation bubbles, the pressure difference between inside and outside the bubble is inversely proportional to the bubble radius, which is shown as
where
where
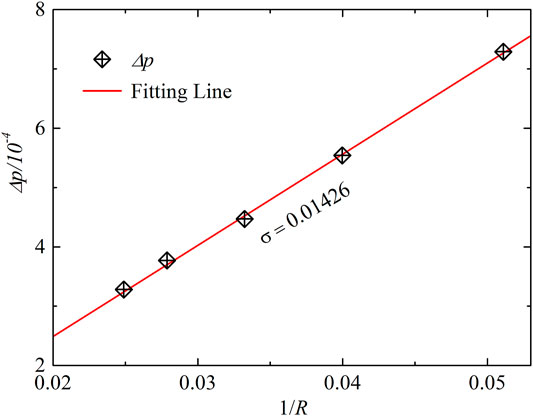
FIGURE 1. Validation of Laplace’s law.
Validation of Rayleigh-Plesset Equation and Temperature Equation
As is well known, the bubble dynamics equation in a viscous fluid—i.e., the R–P equation—is (Brennen, 1973)
where
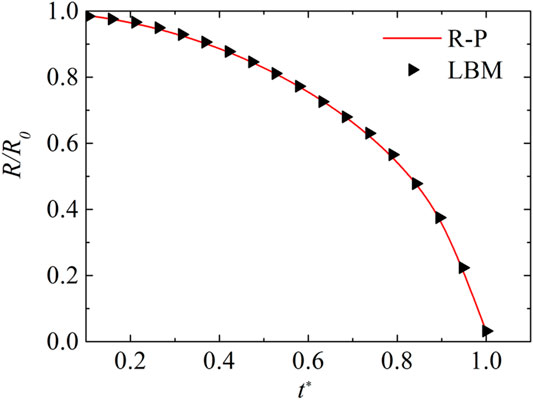
FIGURE 2. Evolution curve of collapsed bubble radius.
The temperature formula of the cavitation bubble, deduced from the R–P equation, is
where
The current theoretical results show that the maximum collapse temperature of the bubble is infinite. What prevents such a runaway increase is heat dissipation, viscous dissipation and other uncontrollable factors in experiments or numerical simulations. As shown in Figure 3, the simulation results closely track the theoretical solution results, supporting the reliability of the present model. The thermal LB model can therefore be used to predict and analyze the collapse of cavitation bubble near solid wall.
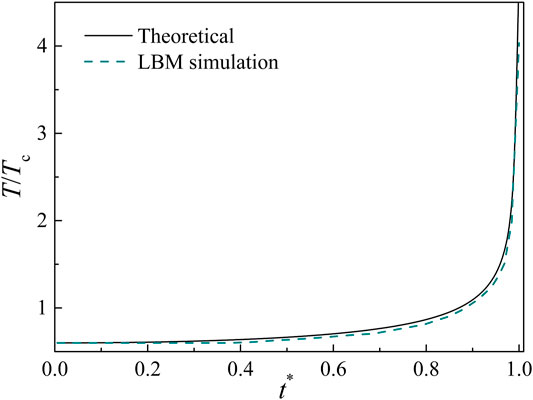
FIGURE 3. Comparative calculation of the cavitation bubble temperature vs. time.
Numerical Results
Model Establishment
As illustrated in Figure 4, numerical simulation is carried out in the two-dimensional x-y plane, and the computational domain lx × ly. The nonslip boundary scheme (Mohamad, 2017) is applied at the wall that is defined at y = 0 and periodic boundaries are utilized in the horizontal direction. The top of the computational domain is set as an open boundary, and the anti-bounce-back approach is applied. In our simulation, the initial radius of the bubble is R0, b denotes the distance from the center of the bubble to the solid wall, and
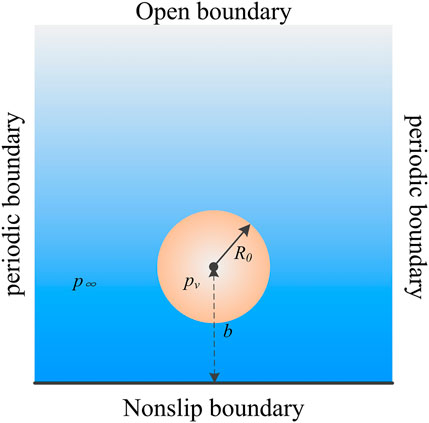
FIGURE 4. Computational domain.
Bubble Profile and Grid Independent Validation
Figure 5 shows the comparison between the current bubble profile and the results of an underwater pulsed discharge experiments published in the literature (Shan et al., 2019). Due to the difference in the size of the cavitation bubbles in the experimental study and numerical simulation, their collapse time cannot be directly compared and needs to be normalized. Comparing the Figures 5A,B, it can be found that the morphological evolution process of the bubble is consistent, and the dimensionless time obtained after normalization is the same. The result verifies the correctness of the LBM numerical experiment from the appearance change of the bubble.
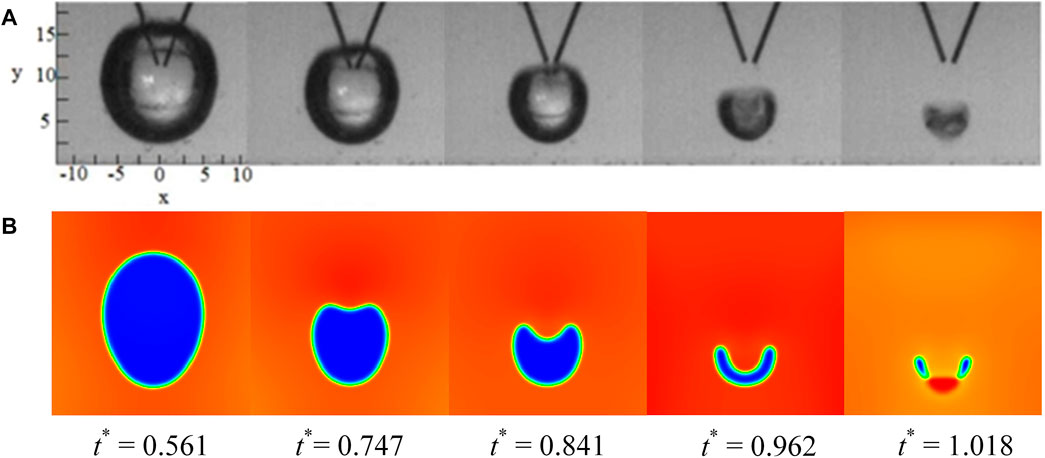
FIGURE 5. Comparison of the bubble profile with experimental results (λ = 1.2). (A) the morphological change diagram of cavitation bubble near solid wall collapse under high-voltage discharge-induced bubble experiment; (B) the phase diagram of cavitation bubble near solid wall collapse obtained by LBM simulation.
In addition, in order to make a more accurate comparison and prove the symmetry of the collapse of cavitation bubble near the solid wall, the grid independence verification is carried out in this section. First the coordinates of the bubble surface need to be obtained. The criterion for the interface between the vapor and the liquid is that the density of the interface point is equal to
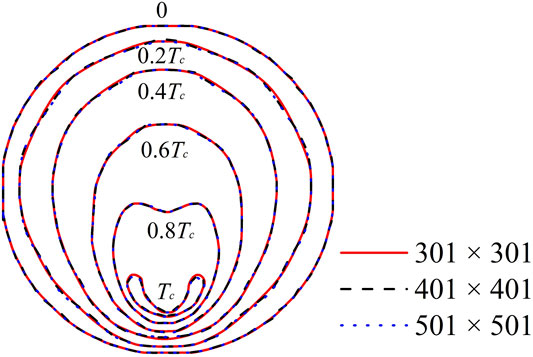
FIGURE 6. Validation of grid independent (λ = 1.2).
Collapse Evolution Process of Cavitation Bubble Near a Wall
Figure 7 shows the evolution of the temperature, pressure and fluid velocity fields of a single cavitation bubble collapse near the solid wall (prior to complete collapse). Due to the left-right symmetry of the entire system, in the evolution result image, the left side is the pressure field and the fluid velocity field, and the right side is the temperature field. As shown in Figures 7A,B, the spherical cavitation bubble is deformed into an elongated bubble in the direction perpendicular to the solid wall. The fluid velocity above the bubble is relatively high, which leads to a higher temperature in the liquid area and the area above the bubble. The near-wall fluid velocity is lower, causing the temperature in the bottom area of the bubble to decrease. As can be seen from Figures 7C,D, the micro-jet formed above the bubble causes local liquid pressure fluctuations and makes the local fluid particles vibrate rapidly. A thermal boundary layer forms at the bubble surface. Figure 7E shows the first collapse of the bubble, where the micro-jet impinges on the bottom edge of the bubble and the bubble temperature rises instantaneously. After the first collapse, a shock wave is emitted toward the solid wall and forms a hot spot on the wall, as has been discussed in Refs. (Yang et al., 2020) and (Yang et al., 2021). As shown in Figure 7F, the bubble becomes toroidal and its internal initial temperature is low. Then the toroidal bubble collapses rapidly under the driving action of the micro-jet, that is, the second collapse of the bubble. It can be seen from the time steps of Figure 7F-(i) that the second collapse of the bubble is very fast. The toroidal bubble temperature increases sharply and reaches a maximum when the bubble collapses completely.
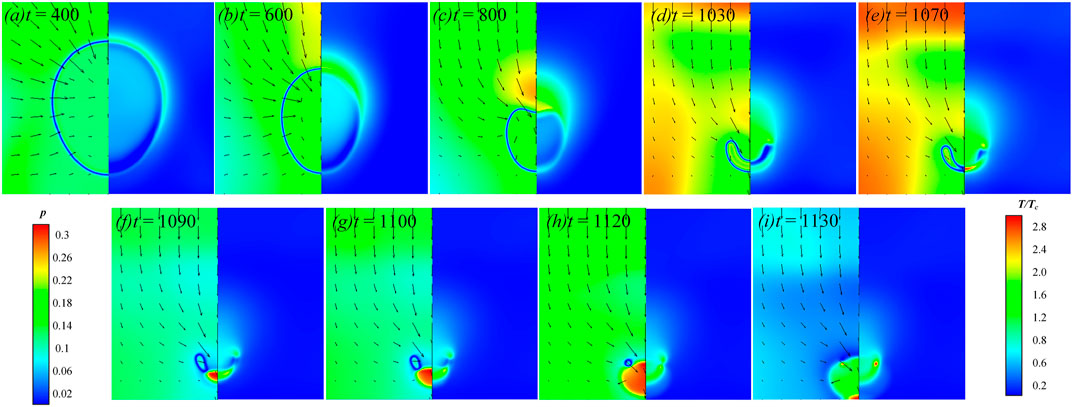
FIGURE 7. Temperature, pressure, and velocity field evolutions of cavitation bubble (R0 = 80, λ = 1.2, and Δp = 0.0853). (A) Temperature (right), pressure, and velocity field (left) of cavitation bubble collapse near a wall at t = 400 ts; (B) Temperature (right), pressure, and velocity field (left) of cavitation bubble collapse near a wall at t = 600 ts; (C) Temperature (right), pressure, and velocity field (left) of cavitation bubble collapse near a wall at t = 800ts; (D) Temperature (right), pressure, and velocity field (left) of cavitation bubble collapse near a wall at t = 1030 ts; (E) Temperature (right), pressure, and velocity field (left) of cavitation bubble collapse near a wall at t = 1070 ts; (F) Temperature (right), pressure, and velocity field (left) of cavitation bubble collapse near a wall at t = 1090 ts; (G) Temperature (right), pressure, and velocity field (left) of cavitation bubble collapse near a wall at t = 1100ts; (H) Temperature (right), pressure, and velocity field (left) of cavitation bubble collapse near a wall at t = 1120 ts; (I) Temperature (right), pressure, and velocity field (left) of cavitation bubble collapse near a wall at t = 1130 ts.
From previous work, we know that the bubble temperature affected by the nondimensional offset parameter λ, initial pressure difference Δp and initial bubble radius R0. In order to understand the evolution results of the bubble temperature, the following sections discuss and analyze the above-mentioned factors in detail.
Analysis of Different Offset Parameters
In this section, the effect of the different offset parameters on the bubble temperature will be discussed. Since the temperature distribution in the bubble is not uniform, we take a certain point inside the bubble as the temperature measurement point. For example, when λ = 1.2, as shown in Figure 8A, the coordinates of the measurement point are (201, 27). This is a point located at the bottom of the bubble on the vertical bisector of the x axis. For other values of λ, the temperature measurement point can be obtained by the same way. Figure 9 shows the bubble temperature curves with offset parameters of 1.2, 1.4 and 1.6. In order to explain the changes of the bubble temperature more clearly, the maximum jet velocity of the perpendicular bisectors of the x axis under three offset parameters is also shown in Figure 8. The initial conditions and parameter settings of the three cases are the same. In Figure 9A, the bubble temperature decreases slightly during the bubble shrinkage stage, which is caused by the lower pressure of the bottom liquid and lower velocity. With the formation of the micro jet, the maximum jet velocity accelerates gradually, and the bubble temperature also increases. Then, the jet velocity decreases after reaching its maximum, which is impeded by the deforming bubble. Meantime, the bubble temperature drops briefly and rises sharply at the first collapse. In Figure 9B, the trend of the bubble temperature curve is similar to that of Figure 9A, and the jet velocity decreases slightly before the first collapse. The maximum bubble temperature is higher than in Figure 9A. However, as shown in Figure 9C, the jet velocity keeps increasing in the early stages of the collapse, and the acceleration of the final stage of the collapse decreases. The bubble temperature increases as λ increases and reaches the greatest value when λ = 1.6. It can be inferred that the larger is λ, the higher is the maximum bubble temperature. In addition, we find that the cavitation bubble will become toroidal when λ = 1.2 after the first collapse. The bubble collapses directly without becoming toroidal when λ = 1.4 or 1.6 (i.e., when it is farther from the wall). As shown in Figure 8B, the coordinates of the temperature measurement point of the toroidal bubble are (183, 39). Figure 10 shows the evolution of the toroidal bubble temperature and the maximum jet velocity around the bubble from the second collapse to complete collapse. Due to the driving effect of the jet and the water hammer effect, the jet velocity increases rapidly, and the toroidal bubble collapses and produces high temperature almost instantaneously.
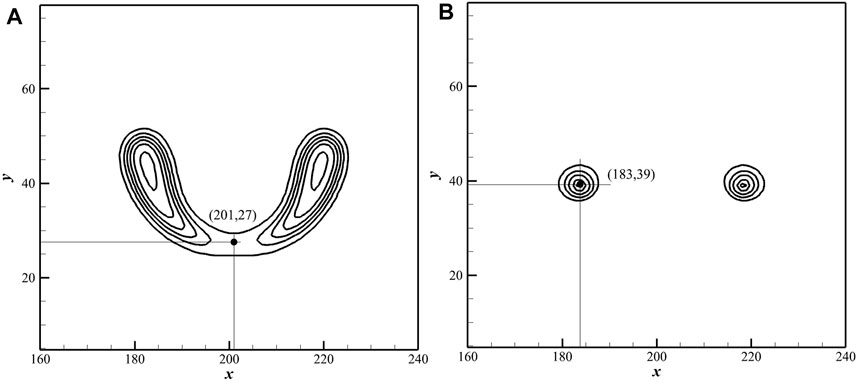
FIGURE 8. (A) Coordinate of the temperature measurement point during the first collapse; (B) Coordinate of the temperature measurement point during the second collapse.
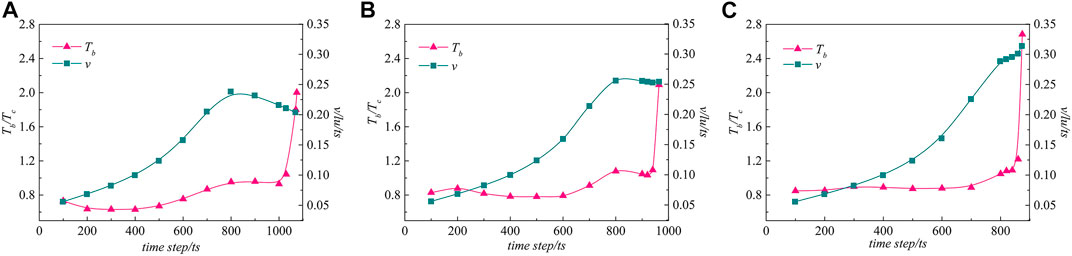
FIGURE 9. (A) Bubble temperature and maximum jet velocity vs. time for different offset parameters at λ = 1.2; (B) Bubble temperature and maximum jet velocity vs. time for different offset parameters at λ = 1.4; (C) Bubble temperature and maximum jet velocity vs. time for different offset parameters at λ = 1.6.
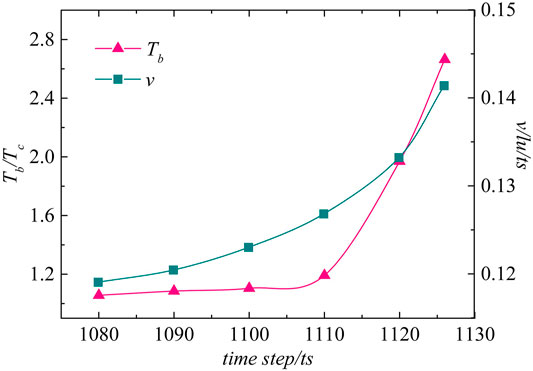
FIGURE 10. Bubble temperature vs. time during the second collapse.
Analysis of Different Driving Pressures and Bubble Radii
In this section, the influences of the initial driving pressure and bubble radius are studied. Because the collapse time is different for different Δp and different initial radius R0, the time step is normalized in the following section for comparison. Figure 11 shows the bubble temperature vs. time during the first collapse for three different values of initial Δp. The result shows that there is no obvious dependence of temperature on Δp at the bubble contraction stage. As Δp increases, the bubble temperature increases gradually. Then the bubble temperature drops briefly, as shown in more detail in Figure 9A, the bubble temperature is related to the jet velocity. Due to the impeding effect of the bubble, the jet velocity decreases briefly, causing the bubble temperature to drop. One may note that, the smaller Δp, the more significant the temperature drop. When the bubble collapses for the first time, its temperature increases dramatically. For Δp = 0.0897, the bubble temperature rises fastest and to the greatest value. It can be concluded that the large pressure difference has large potential energy, which releases more energy when collapsing leading to a higher temperature. The bubble becomes toroidal after the first collapse in all three cases. Figure 12 shows the time-dependence of the toroidal bubble temperature. The initial toroidal temperature is low; it increases gradually as the bubble collapses and eventually reaches a maximum. The collapse temperature is almost the same as that of the three Δp. It can be inferred that the pressure difference has little effect on the toroidal bubble temperature during the second collapse.

FIGURE 11. Bubble temperature vs. time for different values of Δp during the first collapse.
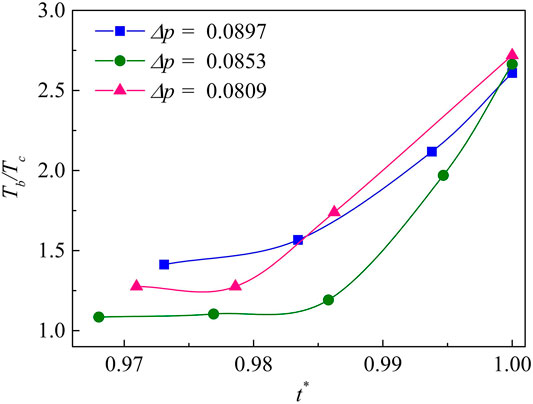
FIGURE 12. Bubble temperature vs. time for different values of Δp during the second collapse.
The evolutions of the bubble temperature during the cavitation bubble collapse with initial radii of 80, 85 and 90 and with an initial driving pressure Δp = 0.0853 are shown in Figure 13. It can be seen that the bubble temperature rises gradually after a brief cooling. When R0 = 90, the larger value, the bubble temperature drops significantly. The bubble temperature then increases sharply when the bubble collapses for the first time. The larger the bubble radius, the greater is the internal energy, and the more energy is released when the bubble collapses, which leads to higher bubble temperature.
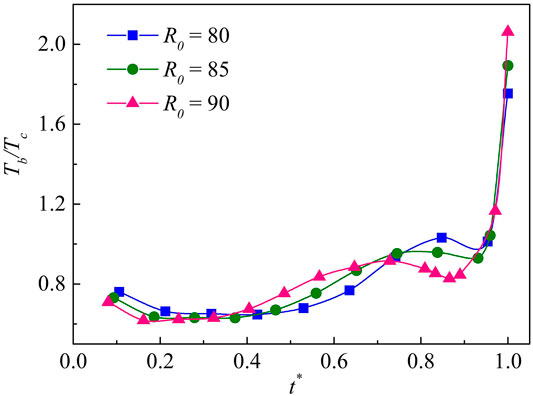
FIGURE 13. Bubble temperature vs. time during the first collapse for several values of R0.
The bubble becomes toroidal after the first collapse. In Figure 14, the bubble temperature of the newly formed toroidal bubble is the lowest among these three examples when R0 = 90, but for the value of R0 the final temperature is the highest, with the most drastic bubble temperature change. For larger initial radius, the maximum bubble temperature is therefore higher at the second collapse.
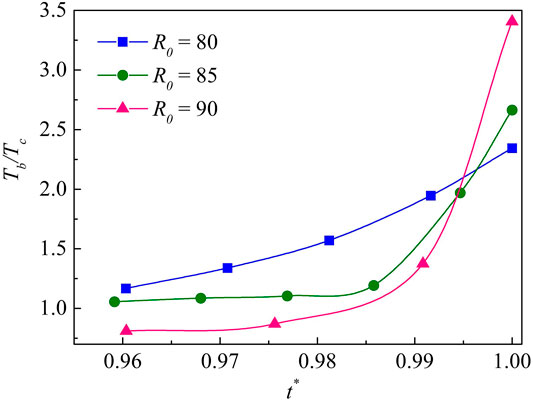
FIGURE 14. Toroidal temperature vs. time during the second collapse for several values of R0.
Conclusion
In this paper, the validation of the Laplace’s law, R-P equation and temperature equation are verified, and the simulation results of cavitation bubble collapse near the wall are consistent with the experimental results. Using a thermal multiphase lattice Boltzmann model with liquid-vapor phase change, we have numerically investigated the temperature evolution characteristics of a cavitation bubble collapsing near the wall. The main findings and conclusion are summarized as follows.
1) The temperature distribution in the bubble varies with the external liquid pressure and velocity. At the initial stage of the bubble collapse, the temperature in the upper region of the bubble increases due to greater jet velocity and pressure in this region. At the same time, the temperature in the bottom region of the bubble decreases because the jet velocity and pressure field near the wall are low. The simulation results show that the bubble temperature is highly dependent on the jet velocity and the pressure field.
2) The offset parameter affects the change of temperature inside the bubble. The results show that the bubble hit by a jet generates high temperature almost instantly. The larger is λ, the higher is maximum bubble temperature. When λ is smaller—for example, when λ = 1.2—the bubble becomes toroidal after the first collapse, and high temperature is generated in the bubble due to the driving effect of pressure and water hammer effect when the toroidal bubble collapses completely.
3) The initial driving pressure and initial bubble radius also have an effect on the bubble temperature. 1) During the first collapse, the larger the initial Δp, the greater is bubble temperature. A large pressure difference has large potential energy, which causes the bubble to release more energy when it collapses, thus increasing the bubble temperature. The second collapse, of the toroidal bubble, is mainly governed by the water hammer effect and the jet rebound effect. The initial driving pressure Δp has little effect on the toroidal bubble. 2) The greater the initial bubble radius, the higher is the bubble temperature. Large bubble contains large internal energy, and will release more energy when the bubble collapses, resulting in higher bubble temperature.
We believe that the present simulations are useful for understanding the internal mechanisms of the cavitation bubble temperature and its effects. Moreover, the investigation of the temperature evolution and distribution in the bubble provide insights to assists in the further research and applications on the thermodynamics of cavitation bubbles.
Data Availability Statement
The original contributions presented in the study are included in the article/Supplementary Material, further inquiries can be directed to the corresponding author.
Author Contributions
All authors contributed extensively to this work. YY performed the simulation, data analysis, and wrote the paper. MS conceived, supervised and revised the manuscript the project the study. XK and FS drew the figures and revised the manuscript. MS and QH directed the study, supervised the project.
Funding
This work is supported by National Natural Science Foundation of China (Grant No. 11874140), State Key Laboratory of Acoustics, and Chinese Academy of Sciences (Grant No. SKLA201913), National Key Research and Development Program of China (Grant No. 2016YFC0401600).
Conflict of Interest
The authors declare that the research was conducted in the absence of any commercial or financial relationships that could be construed as a potential conflict of interest.
Publisher’s Note
All claims expressed in this article are solely those of the authors and do not necessarily represent those of their affiliated organizations, or those of the publisher, the editors and the reviewers. Any product that may be evaluated in this article, or claim that may be made by its manufacturer, is not guaranteed or endorsed by the publisher.
References
Biferale, L., Perlekar, P., Sbragaglia, M., and Toschi, F. (2012). Convection in Multiphase Fluid Flows Using Lattice Boltzmann Methods. Phys. Rev. Lett. 108, 104502. doi:10.1103/PhysRevLett.108.104502
Biferale, L., Perlekar, P., Sbragaglia, M., and Toschi, F. (2013). Simulations of Boiling Systems Using a Lattice Boltzmann Method. Commun. Comput. Phys. 13, 696–705. doi:10.4208/cicp.321011.020212s
Brennen, C. (1973). The Dynamic Behavior and Compliance of a Stream of Cavitating Bubbles. J. Fluids Eng. 95, 533–541. doi:10.1115/1.3447067
Cervone, A., Testa, R., Bramanti, C., Rapposelli, E., and d'Agostino, L. (2005). Thermal Effects on Cavitation Instabilities in Helical Inducers. J. Propulsion Power 21, 893–899. doi:10.2514/1.12582
Chahine, G. L., and Hsiao, C.-T. (2015). Modelling Cavitation Erosion Using Fluid-Material Interaction Simulations. Interf. Focus. 5, 20150016. doi:10.1098/rsfs.2015.0016
Chopard, B., Falcone, J. L., and Latt, J. (2009). The Lattice Boltzmann Advection-Diffusion Model Revisited. Eur. Phys. J. Spec. Top. 171, 245–249. doi:10.1140/epjst/e2009-01035-5
Dong, Z., Li, W., and Song, Y. (2009). Lattice Boltzmann Simulation of Growth and Deformation for a Rising Vapor Bubble through Superheated Liquid. Numer. Heat Transfer, A: Appl. 55, 381–400. doi:10.1080/10407780902720718
Dular, M., and Coutier-Delgosha, O. (2013). Thermodynamic Effects during Growth and Collapse of a Single Cavitation Bubble. J. Fluid Mech. 736, 44–66. doi:10.1017/jfm.2013.525
Flannigan, D. J., and Suslick, K. S. (2005). Plasma Formation and Temperature Measurement during Single-Bubble Cavitation. Nature 434, 52–55. doi:10.1038/nature03361
Fujikawa, S., Okuda, M., Akamatsu, T., and Goto, T. (2006). Non-equilibrium Vapour Condensation on a Shock-Tube Endwall behind a Reflected Shock Wave. J. Fluid Mech. 183, 293–324. doi:10.1017/S0022112087002647
Gan, Y., Xu, A., Zhang, G., and Succi, S. (2015). Discrete Boltzmann Modeling of Multiphase Flows: Hydrodynamic and Thermodynamic Non-equilibrium Effects. Soft Matter 11, 5336–5345. doi:10.1039/c5sm01125f
Gavranek, V. V., Bol'shutkin, D. N., and Zel'dovich, V. I. (1960). Thermal and Mechanical Action of a Cavitation Zone on the Surface of a Metal. Fiz. Metal Metalloved 10, 262–268.
Gong, S., and Cheng, P. (2012). A Lattice Boltzmann Method for Simulation of Liquid-Vapor Phase-Change Heat Transfer. Int. J. Heat Mass Transfer 55, 4923–4927. doi:10.1016/j.ijheatmasstransfer.2012.04.037
Gonnella, G., Lamura, A., and Sofonea, V. (2007). Lattice Boltzmann Simulation of thermal Nonideal Fluids. Phys. Rev. E 76, 036703. doi:10.1103/PhysRevE.76.036703
Guo, Z., Shi, B., and Zheng, C. (2002). A Coupled Lattice BGK Model for the Boussinesq Equations. Int. J. Numer. Meth. Fluids 39, 325–342. doi:10.1002/fld.337
Házi, G., and Márkus, A. (2008). Modeling Heat Transfer in Supercritical Fluid Using the Lattice Boltzmann Method. Phys. Rev. E 77, 026305. doi:10.1103/PhysRevE.77.026305
He, X., Chen, S., and Doolen, G. D. (1998). A Novel thermal Model for the Lattice Boltzmann Method in Incompressible Limit. J. Comput. Phys. 146, 282–300. doi:10.1006/jcph.1998.6057
He, X., Chen, S., and Zhang, R. (1999). A Lattice Boltzmann Scheme for Incompressible Multiphase Flow and its Application in Simulation of Rayleigh-Taylor Instability. J. Comput. Phys. 152, 642–663. doi:10.1006/jcph.1999.6257
Huai, X., Yan, R., Cai, J., and Li, X. (2011). Dynamic Analysis on Temperature Evolution inside a Single Bubble Due to Hydrodynamic Cavitation under Turbulence. Chin. Sci. Bull. 56, 947–955. doi:10.1360/972010-1722
Lallemand, P., and Luo, L.-S. (2000). Theory of the Lattice Boltzmann Method: Dispersion, Dissipation, Isotropy, Galilean Invariance, and Stability. Phys. Rev. E 61, 6546–6562. doi:10.1103/PhysRevE.61.6546
Li, Q., Luo, K. H., Kang, Q. J., He, Y. L., Chen, Q., and Liu, Q. (2016). Lattice Boltzmann Methods for Multiphase Flow and Phase-Change Heat Transfer. Prog. Energ. Combustion Sci. 52, 62–105. doi:10.1016/j.pecs.2015.10.001
Li, Q., Luo, K. H., and Li, X. J. (2012). Forcing Scheme in Pseudopotential Lattice Boltzmann Model for Multiphase Flows. Phys. Rev. E 86, 016709. doi:10.1103/PhysRevE.86.016709
Li, Q., Luo, K. H., and Li, X. J. (2013). Lattice Boltzmann Modeling of Multiphase Flows at Large Density Ratio with an Improved Pseudopotential Model. Phys. Rev. E 87, 053301. doi:10.1103/PhysRevE.87.053301
Li, Q., Zhou, P., and Yan, H. J. (2017). Improved thermal Lattice Boltzmann Model for Simulation of Liquid-Vapor Phase Change. Phys. Rev. E 96, 063303. doi:10.1103/PhysRevE.96.063303
Liu, X., and Cheng, P. (2013). Lattice Boltzmann Simulation of Steady Laminar Film Condensation on a Vertical Hydrophilic Subcooled Flat Plate. Int. J. Heat Mass Transfer 62, 507–514. doi:10.1016/j.ijheatmasstransfer.2013.03.002
Márkus, A., and Házi, G. (2011). Simulation of Evaporation by an Extension of the Pseudopotential Lattice Boltzmann Method: a Quantitative Analysis. Phys. Rev. E 83, 046705. doi:10.1103/PhysRevE.83.046705
Mason, T. J. (2016). Ultrasonic Cleaning: an Historical Perspective. Ultrason. Sonochem. 29, 519–523. doi:10.1016/j.ultsonch.2015.05.004
Meullemiestre, A., Breil, C., Abert-Vian, M., and Chemat, F. (2017). Manothermosonication as a Useful Tool for Lipid Extraction from Oleaginous Microorganisms. Ultrason. Sonochem. 37, 216–221. doi:10.1016/j.ultsonch.2017.01.014
Ohl, C.-D., Arora, M., Dijkink, R., Janve, V., and Lohse, D. (2006). Surface Cleaning from Laser-Induced Cavitation Bubbles. Appl. Phys. Lett. 89, 074102–0741023. doi:10.1063/1.2337506
Safari, H., Rahimian, M. H., and Krafczyk, M. (2010). Extended Lattice Boltzmann Method for Numerical Simulation of thermal Phase Change in Two-phase Fluid Flow. Phys. Rev. E 88, 036707. doi:10.1103/PhysRevE.88.013304
Sbragaglia, M., Benzi, R., Biferale, L., Succi, S., Sugiyama, K., and Toschi, F. (2007). Generalized Lattice Boltzmann Method with Multirange Pseudopotential. Phys. Rev. E 75, 026702. doi:10.1103/PhysRevE.75.026702
Shan, M.-L., Zhu, C.-P., Yao, C., Yin, C., and Jiang, X.-Y. (2016). Pseudopotential Multi-Relaxation-Time Lattice Boltzmann Model for Cavitation Bubble Collapse with High Density Ratio. Chin. Phys. B 25, 104701. doi:10.1088/1674-1056/25/10/104701
Shan, M., Chen, B., Yao, C., Han, Q., Zhu, C., and Yang, Y. (2019). Electric Characteristic and Cavitation Bubble Dynamics Using Underwater Pulsed Discharge. Plasma Sci. Technol. 21, 074002. doi:10.1088/2058-6272/ab0b62
Shan, M., Yang, Y., Peng, H., Han, Q., and Zhu, C. (2017). Modeling of Collapsing Cavitation Bubble Near Solid wall by 3D Pseudopotential Multi-Relaxation-Time Lattice Boltzmann Method. Proc. Inst. Mech. Eng. C: J. Mech. Eng. Sci. 232, 445–456. doi:10.1177/0954406217740167
Shan, X. (2006). Analysis and Reduction of the Spurious Current in a Class of Multiphase Lattice Boltzmann Models. Phys. Rev. E 73, 047701. doi:10.1103/PhysRevE.73.047701
Shan, X. (2008). Pressure Tensor Calculation in a Class of Nonideal Gas Lattice Boltzmann Models. Phys. Rev. E 77, 066702. doi:10.1103/PhysRevE.77.066702
Suslick, K. S., Eddingsaas, N. C., Flannigan, D. J., Hopkins, S. D., and Xu, H. (2011). Extreme Conditions during Multibubble Cavitation: Sonoluminescence as a Spectroscopic Probe. Ultrason. Sonochem. 18, 842–846. doi:10.1016/j.ultsonch.2010.12.012
Suslick, K. S., and Flannigan, D. J. (2008). Inside a Collapsing Bubble: Sonoluminescence and the Conditions during Cavitation. Annu. Rev. Phys. Chem. 59, 659–683. doi:10.1146/annurev.physchem.59.032607.093739
Tomita, Y., and Shima, A. (1986). Mechanisms of Impulsive Pressure Generation and Damage Pit Formation by Bubble Collapse. J. Fluid Mech. 169, 535–564. doi:10.1017/S0022112086000745
Verhaagen, B., and Fernández Rivas, D. (2016). Measuring Cavitation and its Cleaning Effect. Ultrason. Sonochem. 29, 619–628. doi:10.1016/j.ultsonch.2015.03.009
Wang, Z. C., Zhang, Y., and Zhang, X. Q. (2001). The thermal Effect during Cavitation Erosion. Chin. Mater. Res. 15, 287–290.
Yang, Y., Shan, M.-L., Han, Q.-B., and Kan, X.-F. (2021). Effect of Non-condensable Gas on a Collapsing Cavitation Bubble Near Solid wall Investigated by Multicomponent thermal MRT-LBM*. Chin. Phys. B 30, 024701. doi:10.1088/1674-1056/abbbf8
Yang, Y., Shan, M., Kan, X., Shangguan, Y., and Han, Q. (2020). Thermodynamic of Collapsing Cavitation Bubble Investigated by Pseudopotential and thermal MRT-LBM. Ultrason. Sonochem. 62, 104873. doi:10.1016/j.ultsonch.2019.104873
Yuan, P., and Schaefer, L. (2006). Equations of State in a Lattice Boltzmann Model. Phys. Fluids 18, 042101. doi:10.1063/1.2187070
Yusof, N. S. M., Babgi, B., Alghamdi, Y., Aksu, M., Madhavan, J., and Ashokkumar, M. (2016). Physical and Chemical Effects of Acoustic Cavitation in Selected Ultrasonic Cleaning Applications. Ultrason. Sonochem. 29, 568–576. doi:10.1016/j.ultsonch.2015.06.013
Keywords: bubble temperature, collapse, lattice Boltzmann method, cavitation, solid wall
Citation: Shan M, Yang Y, Kan X, Shu F and Han Q (2022) Numerical Investigations on Temperature Distribution and Evolution of Cavitation Bubble Collapsed Near Solid Wall. Front. Energy Res. 10:853478. doi: 10.3389/fenrg.2022.853478
Received: 13 January 2022; Accepted: 03 March 2022;
Published: 08 April 2022.
Edited by:
Mostafa S. Shadloo, Institut National des Sciences Appliquées de Rouen, FranceReviewed by:
Morteza Ghorbani, Sabancı University, TurkeyHaibo Huang, University of Science and Technology of China, China
Copyright © 2022 Shan, Yang, Kan, Shu and Han. This is an open-access article distributed under the terms of the Creative Commons Attribution License (CC BY). The use, distribution or reproduction in other forums is permitted, provided the original author(s) and the copyright owner(s) are credited and that the original publication in this journal is cited, in accordance with accepted academic practice. No use, distribution or reproduction is permitted which does not comply with these terms.
*Correspondence: Minglei Shan, c2hhbm1pbmcyMDAzQDEyNi5jb20=