Abstract
The performance of the compressor is of great importance in developing advanced engine technology, and it dramatically influences the cycle efficiency and safety of the engine. The compressor bleed requires a part of the main flow extraction from the passage, and the removal of the airflow plays an essential role in the performance of the compressor. The influence of the constant suction and pulsed suction on the flow structures and the aerodynamic performance in a compressor cascade, and the control mechanisms are numerically studied using large eddy simulation. At a suction mass flow rate of 0.25% of the main flow rate, constant suction leads to a 9.36% reduction in Cpt, while pulsed suction gains 24% more benefit in Cpt reduction on the basis of the constant suction with an excitation frequency of 100 Hz. It indicates that the pulsed suction has more significant potential to control the loss generation in the compressor. Afterward, the flow field of the baseline, constant suction, and pulsed suction are compared to find out the flow control mechanisms of the constant suction and pulsed suction. Two different formation mechanisms of the passage vortex are found due to the excitation effect of the pulsed suction. Besides, the results of proper orthogonal decomposition and dynamic mode decomposition show that the pulsed suction can simplify and stabilize the compressor flow field, which could lead to a further benefit in Cpt.
Introduction
The compressor is one of the critical components of the engine, and it plays a crucial role in guaranteeing the cycle efficiency and safety of the engine. The compressor in the modern aeroengine is often designed with high loading to reduce the weight of the engine or increase the pressure before the burner. However, this may induce more serious flow separation within the compressor and further leads to the efficiency or stability loss of the compressor. A lot of work has been done on the flow field details in the high-loading compressor (Gbadebo et al., 2005; Gbadebo et al., 2008; Lei et al., 2008; Wei et al., 2013; Zambonini et al., 2017). Besides, the passive flow control methods, such as lean or sweep blade (Denton and Xu, 2002; Zhang et al., 2018), end-wall contouring (Heinichen et al., 2011; Sun et al., 2018; Sun et al., 2019), and vortex generator (Evans and Hodson, 2010), have been widely investigated to improve the compressor performance. Compared with the passive ones, the active flow control methods (Kerrebrock et al., 1997; Kerrebrock et al., 2008; Jabbal et al., 2013) can adjust according to the operating condition of the compressor; hence, they may be applied as more flexible in many cases, especially for some highly maneuverable aircraft.
The compressor suction, which was first proposed by Kerrebrock et al. (1997) and Kerrebrock et al. (2008) in an aspirated compressor, is one of the extensively used flow control methods. Afterward, the influence of the suction mass flow rate and the location (Leishman et al., 2007; Gummer et al., 2008) where the suction is installed on the performance of the compressor efficiency are investigated numerically or experimentally. The results indicate that the compressor suction is an efficient flow control method in managing the flow field where the flow separation exists. Compared with the steady flow control methods, the unsteady flow control methods, such as the synthetic jet (Zheng et al., 2005; Zheng et al., 2006; De Giorgi et al., 2012; Jabbal et al., 2013), pulsed jet (Seifert et al., 1993; Schatz and Thiele, 2001) and pulsed suction (PS) (Cerretelli and Kirtley, 2009; Hecklau et al., 2010; Hecklau et al., 2011a; Hecklau et al., 2011b; Zhang and Chen, 2021), are thought to have much more potential in alleviating the compressor flow separation and enhancing the compressor efficiency.
The compressor bleed system is an inevitable component of the aeroengine, and it bleeds air from the compressor to provide turbine cooling air, pressurize the cabin, and guarantee stage matching (Leishman et al., 2007). The removal of the air can enhance the compressor performance after a well-designed arrangement of the bleed configuration (Gummer et al., 2008). Based on the requirements of the compressor bleed and the application of the end-wall flow extraction, an experimental investigation has been performed by us (Zhang and Chen, 2021) to validate the effect of the PS control on a high-loading compressor cascade, and the results indicate that the PS has a better efficiency improvement than the constant suction (CS). Two reasons make the PS much more efficient, and one is that the PS has a larger suction momentum than CS when retaining the same suction flow rate, and the second is the introduction of the pulsed excitation that may create additional vortex structures, which can energize the boundary layer. However, the flow control mechanism of the PS in-depth has not been fully demonstrated yet due to the limitation of the test techniques.
A more detailed and higher-resolution result is required to study the vortex structures of the flow field under the influence of the CS and PS, as well as the controlling mechanism, and this can be achieved through the application of the large eddy simulation (LES) method (Tucker, 2011a; Tucker, 2011b). As the name indicates, the LES method can resolve the large-scale eddies (the size of eddies larger than the grid scale), while the remaining small-scale eddies are predicted through subgrid scale (SGS) models. Because of its advantage in high-resolution result resolving, the LES methods have been used in the works of Gao et al. (2015), Leggett et al. (2018), and Decaix et al. (2015) to find the mechanisms of the flow in depth. The LES is applied on a compressor cascade by Gao et al. (2015), and it is found that the unsteadiness of the compressor corner separation is contributed by an aperiodic shedding of the hairpin vortices. Therefore, to find out the flow field-controlling mechanism of the CS and PS, the LES method is thought to be a good choice.
Based on our former experimental work in Zhang and Chen (2021), the LES is used in this study to provide more detailed information on the flow structures. The comparison of the flow field details of the baseline, the CS, and PS configurations, as well as the flow control mechanism of the CS and PS, are the main scope of this paper. The article is organized into four sections. The first section is a brief comparison of the three configurations, followed by a detailed flow field analysis and the vortex structure description. Then the influences brought by the CS and PS are discussed. Finally, the flow field is decomposed with the help of proper orthogonal decomposition (POD) and dynamic mode decomposition (DMD) to shed more light on the mechanism of the PS and its advantage in compressor flow field controlling.
Numerical Method
An NACA65 blade profile is used to perform the investigation in the present article. Figure 1 shows the calculation model, and a detailed information is given in Table 1. The present blade profile has a 2D diffusion factor of 0.408. The inlet is extended one cx upstream to reduce the numerical effect of the inlet boundary, and the outlet is extended one and a half cx to allow full development of the wake. In order to reduce the computer resource and time cost, only one blade passage is simulated in the present investigation because of the periodicity of the compressor. In addition, according to the previous results (Zhang et al., 2018), the flow field in the upper half passage and lower half passage are the same at the present boundary condition; hence, only half of the blade passage is simulated.
FIGURE 1
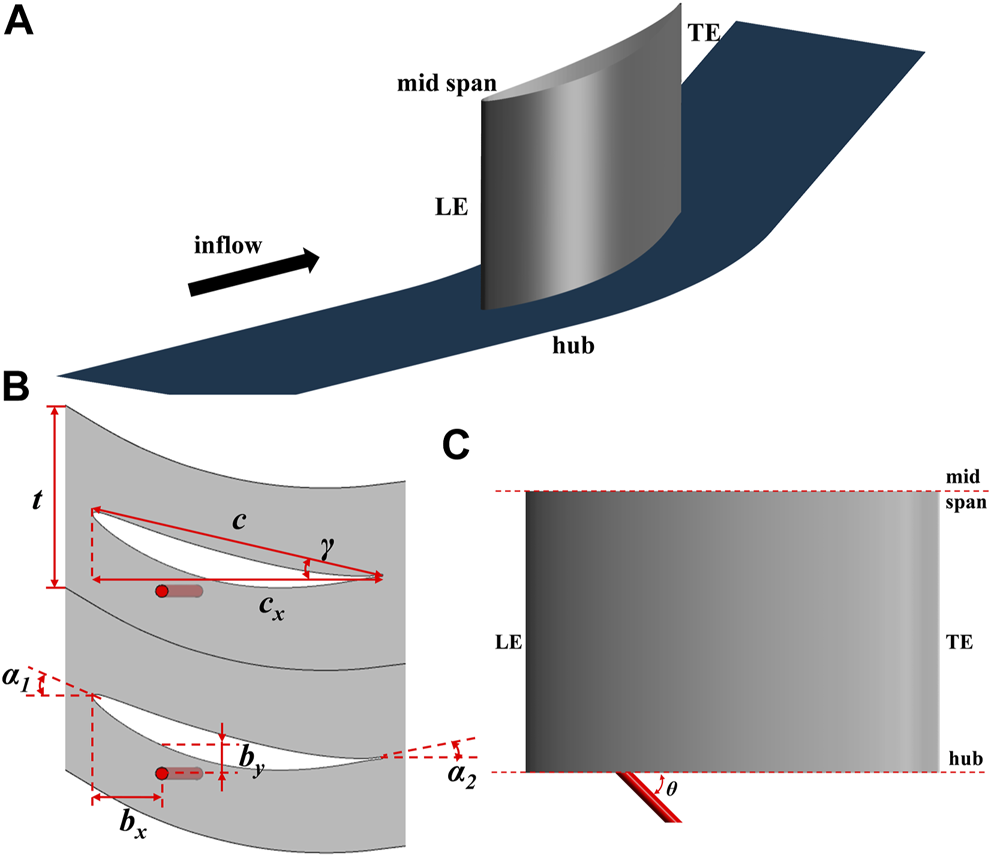
Schematic diagram of the calculation model. (A) Calculation model display; (B) the definition of the symbols; (C) the inclination angle define the hole.
TABLE 1
| Parameters | Values |
|---|---|
| c x | 117 mm |
| C | 120 mm |
| T | 74 mm |
| H | 160 mm |
| Γ | 12.4° |
| α 1 | 32.123° |
| α 2 | −7.877° |
| Θ | 45° |
| b x | 29.5 mm |
| b y | 11 mm |
Key geometric parameters of the model.
In this paper, three configurations are calculated, the baseline configuration, the CS configuration, and the PS configuration, and the calculation model is shown in Figures 1B, C. The suction hole with a diameter of 5 mm is located 25% cx downstream of the blade leading edge and 11 mm away from the blade suction surface, as shown in Figure 1B, and the suction hole position is decided based on our experimental investigation, which can be found in Zhang and Chen (2021). The suction hole has an inclination angle of 45° with the axial direction, as can be seen in Figure 1C. The suction mass flow rate is 0.25% of the main flow rate, and the PS configuration has an excitation frequency of 100 Hz, and the variation of the bleed flow rate along the time is displayed in Figure 2.
FIGURE 2
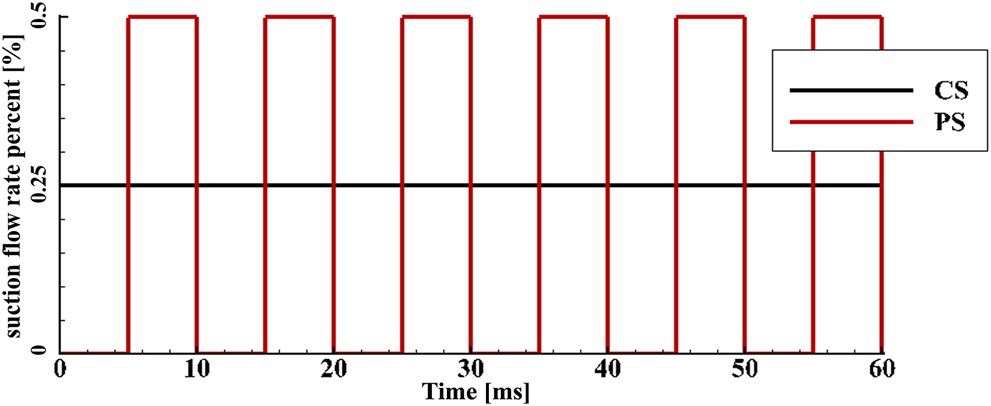
Variation of the bleed rate for the constant suction (CS) and pulsed suction (PS) configuration.
The mesh is generated in ANSYS ICEM CFD with an O4H topology, and the meshing scheme is displayed in Figure 3. The grid near the solid wall is refined, and the height of the first layer is 7 × 10⁻⁶ m (corresponding to the average value of y+ to be about 0.4). The maximum stream-wise and span-wise grid sizes are strictly controlled to meet the requirements of the calculation method, and the corresponding Δx+ and Δz+ are less than 30 and 20, respectively. Besides, in order to guarantee the precision of the data transfer between the suction hole grid and the main blade passage grid, the grid is refined with an O-type grid and the connection between them are fully matching. Finally, the quantity of the grid nodes is 64 million for the baseline configuration and 74 million for the CS and PS configurations.
FIGURE 3
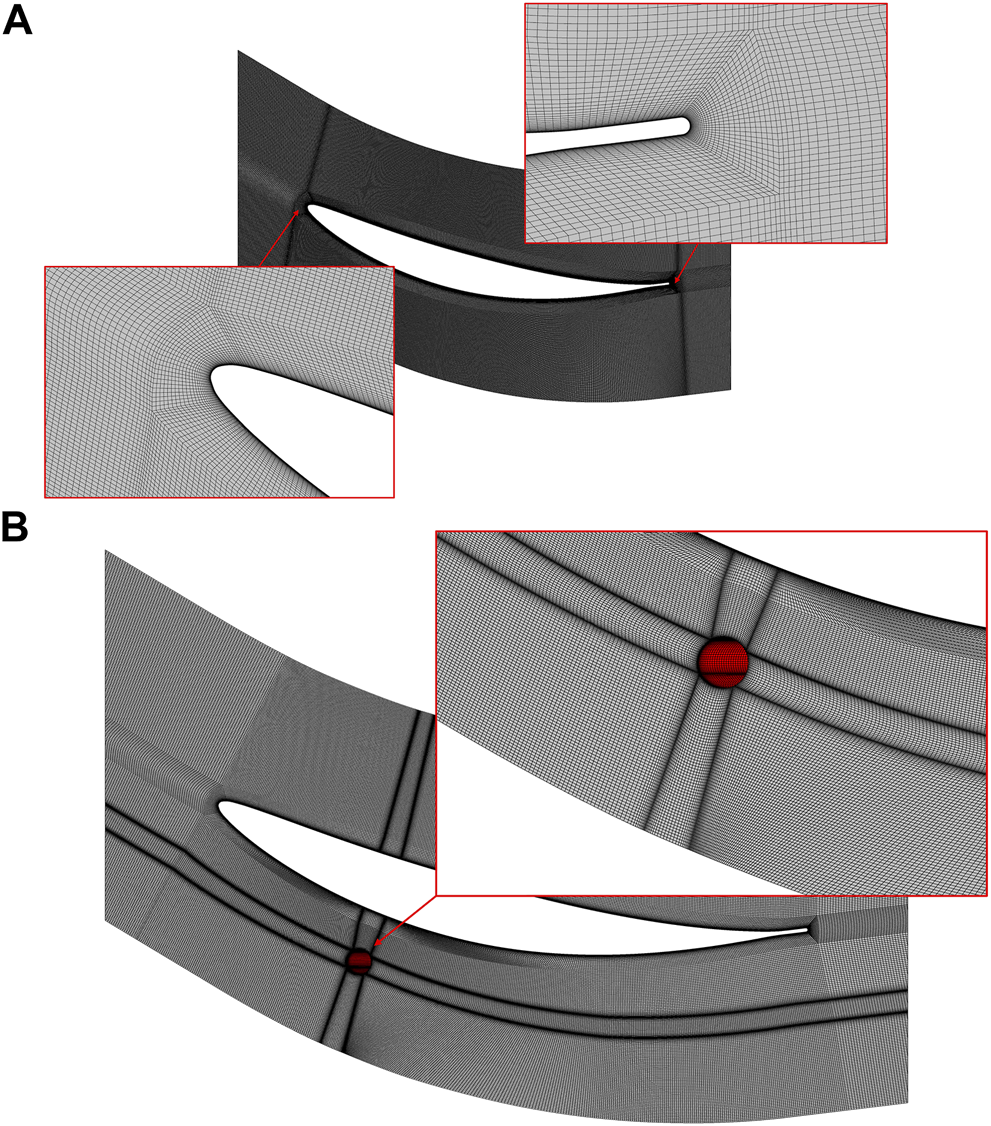
Grid scheme for the baseline, CS, and PS configurations. (A) Baseline. (B) CS and PS.
The finite-volume-based code ANSYS CFX is used in the present paper to perform the calculation. The second-order backward Euler method is applied as the transient scheme, and the advection scheme is high resolution. The total pressure and flow angle condition are specified at the inlet, and an inlet boundary layer is set. The Mach number at mainstream is 0.1, and the corresponding Reynolds number is about 260,000 based on the blade chord. Besides, the average static pressure condition is specified at the domain outlet. All walls in the calculation domain are no-slip and adiabatic, including the blade and hub. The symmetry condition is applied at mid-span, and two sides of the domain are periodic interface. In the present paper, the ability of the hole-type suction control method at a high-load state of the compressor is of great interest and worthy of more attention; hence, 8° of the incidence is used to investigate the flow control performance at the large incidence condition.
The LES method is used in this paper with the wall-adapting local eddy-viscosity (WALE) SGS model, which is developed by Nicoud and Ducros (1999) and extensively used in many works (Wei et al., 2013; Zambonini et al., 2017). A RANS resolution is obtained first with turbulence model of SST k-ω and transition model of γ-θ, to be the initial flow field of the LES calculation and compared with the results of LES and experiment data afterward. The LES time step is 1 × 10⁻⁵ s, corresponding to the Courant number of about 1, and the inner iteration subtime step is 4. The time duration of airflow from the blade leading edge to the trailing edge is defined as one flow-through time, and 10 flow-through times are required to clear the initial flow field effect, and another 10 flow-through times are needed to obtain the transient results. All the abovementioned processes require at least 240 h for one configuration running on 444 CPU cores to obtain the final results.
The comparison between RANS, LES, and the measurement data in Zhang and Chen (2021) are used to validate the reliability and feasibility of the calculation model in the present study, and the total pressure loss coefficient distribution along the span is displayed in Figure 4. The total pressure loss coefficient is defined in Eq. 1 as follows:where p0, p represent the total pressure and static pressure, respectively, and subscript 1 denotes the parameter of mainstream flow at the inlet. It is evident that the LES result is consistent with the experiment result, and it predicts a better trend of the loss distribution than the RANS one, especially in the region between 10% and 30% blade span where the large flow separation exists. This indicates that the LES used here is adequate to support the present investigation.
FIGURE 4
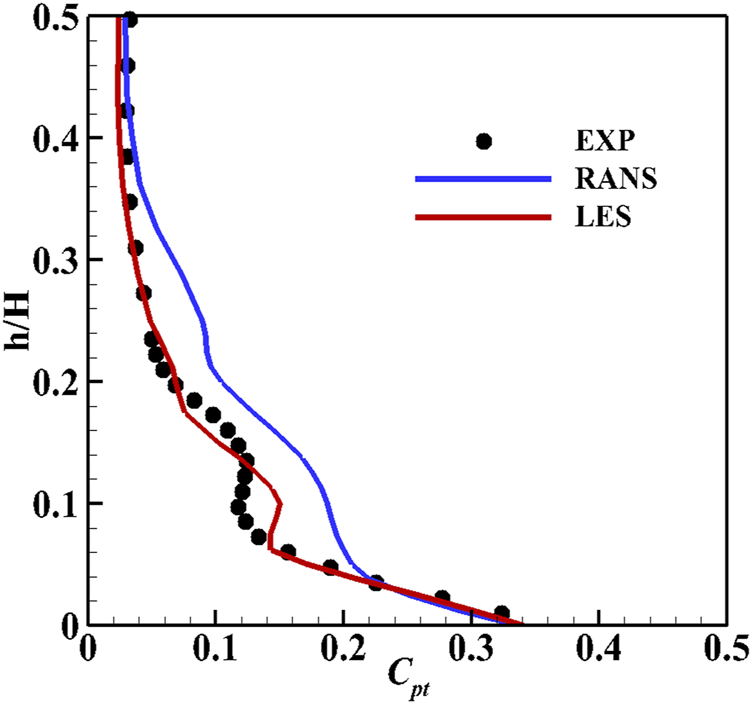
Comparison of Cpt distribution along the spanwise.
Results and Analysis
Overall Performance Comparison
The loss in the compressor is of great interest, and it determines the effectiveness of a flow control method. Therefore, the time-averaged total pressure loss at the plane 20% cx downstream the trailing edge of three configurations are compared in Figure 5. It can be seen that the CS and PS configurations reduce the Cpt by 9.36% and 11.61%, respectively, based on that of the baseline configuration. Compared with the CS, the PS has 24% more ability in reducing the Cpt of the compressor cascade. To have deep knowledge of the flow control mechanism of the PS, the detailed flow fields are compared and analyzed in the following part.
FIGURE 5
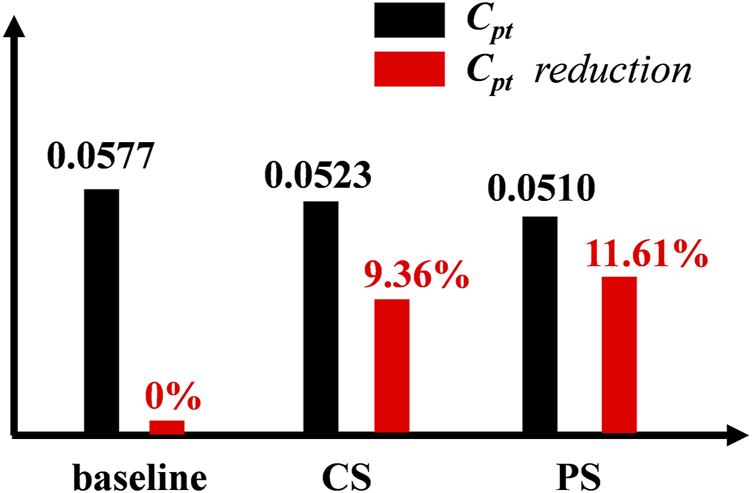
C pt and Cpt reduction percent for the baseline, CS, and PS.
The Q criterion derived from the second invariant of the velocity gradient tensor is used to identify the vortex structures in the compressor flow field, and the function used to calculate the Q value is given below (Hunt et al., 1988),where Ωij is an anti-symmetric tensor of the rotation rate, and Sij is a symmetric tensor of the strain rate. The Q is thought to be a balance between the rotation rate and strain rate of the control volume.
Figure 6 displays the vortex structures in the compressor cascade identified by the Q iso-surface and the loss contour on the plane 20% cx downstream of the blade trailing edge of the three configurations. In the baseline in Figure 6A, it is obvious that the passage vortex (PV) arises from the joint point of the suction leg of the horseshoe vortex (HSV) and the pressure one from the adjacent blade, and the PV rolls up and interacts with the vortex structures from the blade suction surface as flowing downstream and leading to further total pressure loss generation. The loss caused by the vortex interaction contributes a considerable part of the total loss, which can be inferred from the loss contour downstream the blade. In Figure 6B of the CS configuration, however, both the suction leg and pressure leg of the HSV are removed by the suction hole, and the arising of the PV is contributed by the remaining part of the transverse flow near the endwall. In this case, the size of the PV is significantly reduced compared with that of the baseline, and the total pressure loss attributed to the PV is decreased accordingly. Besides, the interaction between the PV and the separation flow from the blade suction surface is attenuated, and this leads to a further reduction in the Cpt. Therefore, the corner separation of the CS configuration is alleviated, and the loss downstream of the blade is reduced accordingly. As for the PS configuration in Figure 6C, in addition to the reduction in the PV size, the loss has a significant reduction compared with the CS configuration, which indicates that the PS has more significant potential in flow control of the compressor flow separation than the CS. In the following section, the detailed flow field of the three configurations will be analyzed and compared to clarify how the PS influences the compressor flow field and the controlling mechanism of the PS.
FIGURE 6
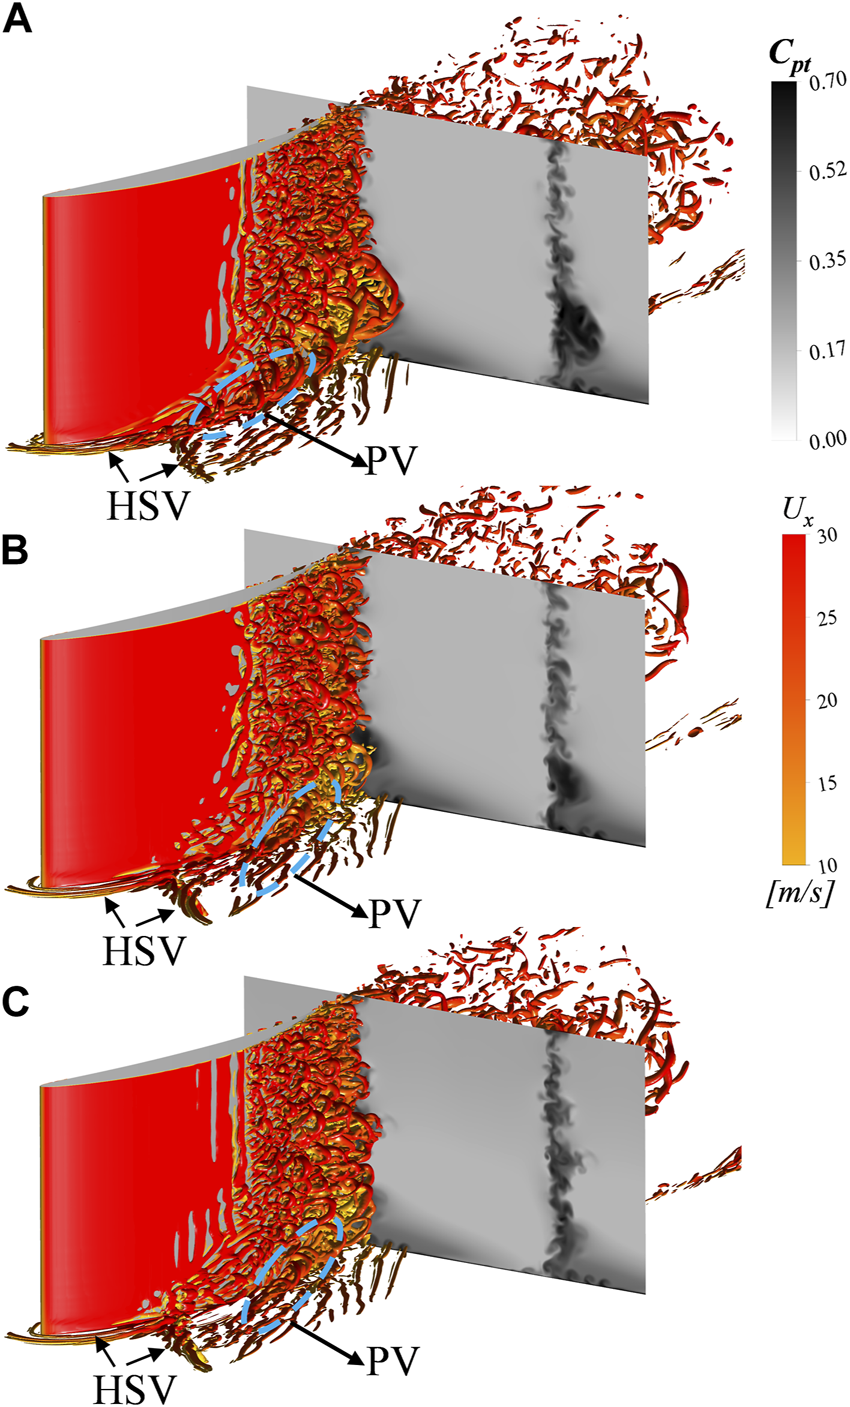
Vortex structures and loss contour on the plane 20% cx downstream of the trailing edge (Q = 5,000,000). (A) Baseline; (B) CS; (C) PS.
Control Mechanism of the Pulsed Suction
Figure 8 displays the top–down view of the instantaneous vortex structures at five different instantaneous times in a pulse periodicity, and the time definition is given in Figure 7; τ denotes the time duration of a pulse. When t = T in Figure 8A, the suction hole is in a state in which the previous pulse is ended and another pulse is prepared to start, and the size of the PV, as well as its interaction with the separated flow from the blade suction surface, is small under the influence of the previous pulse, as marked by the black rectangle in Figure 8A. When t = T + 1/4τ in Figure 8B, there is no flow bled into the suction hole, and in this case, the pressure leg of the HSV and the suction one converge near the position of the suction hole and give rise to the PV afterward. The PV interacts with the separated flow from the blade suction surface and induces more serious flow separation and higher total pressure loss. The PV and separated flow at the blade suction corner develop and entrain the ambient air into the vortices and result in higher loss as flowing downstream, as displayed in the rectangle colored blue in Figure 8C. When t = T + 3/4τ in Figure 8D, the pressure leg of the HSV, as well as the suction one, are bled into the suction hole, which postpones the arising of the PV. It can be observed that the vortex structures near the suction hole are greatly alleviated, and the vortex size spanwise and pitchwise are restricted; hence, the local flow field can be improved accordingly. In this case, the remaining part of the transverse flow near the endwall accumulates near the blade suction corner and gives rise to the PV, as is shown by the black dotted line. Compared with the position where the PV forms in Figure 8B, it is indicated that the formation of the PV is significantly moving downstream, which reduces the vortex structure size both spanwise and pitchwise, and the interaction between the PV and the separated flow from the blade suction surface is weakened; hence, the corresponding loss generated is reduced under the influence of the PS.
FIGURE 7
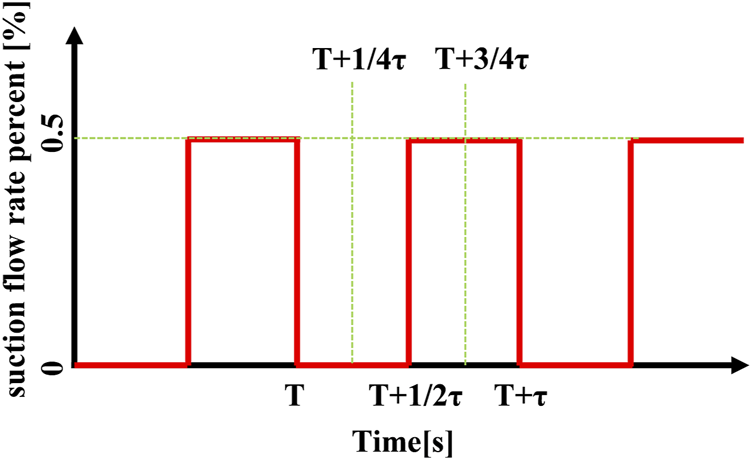
Time definition in a pulse periodicity.
FIGURE 8
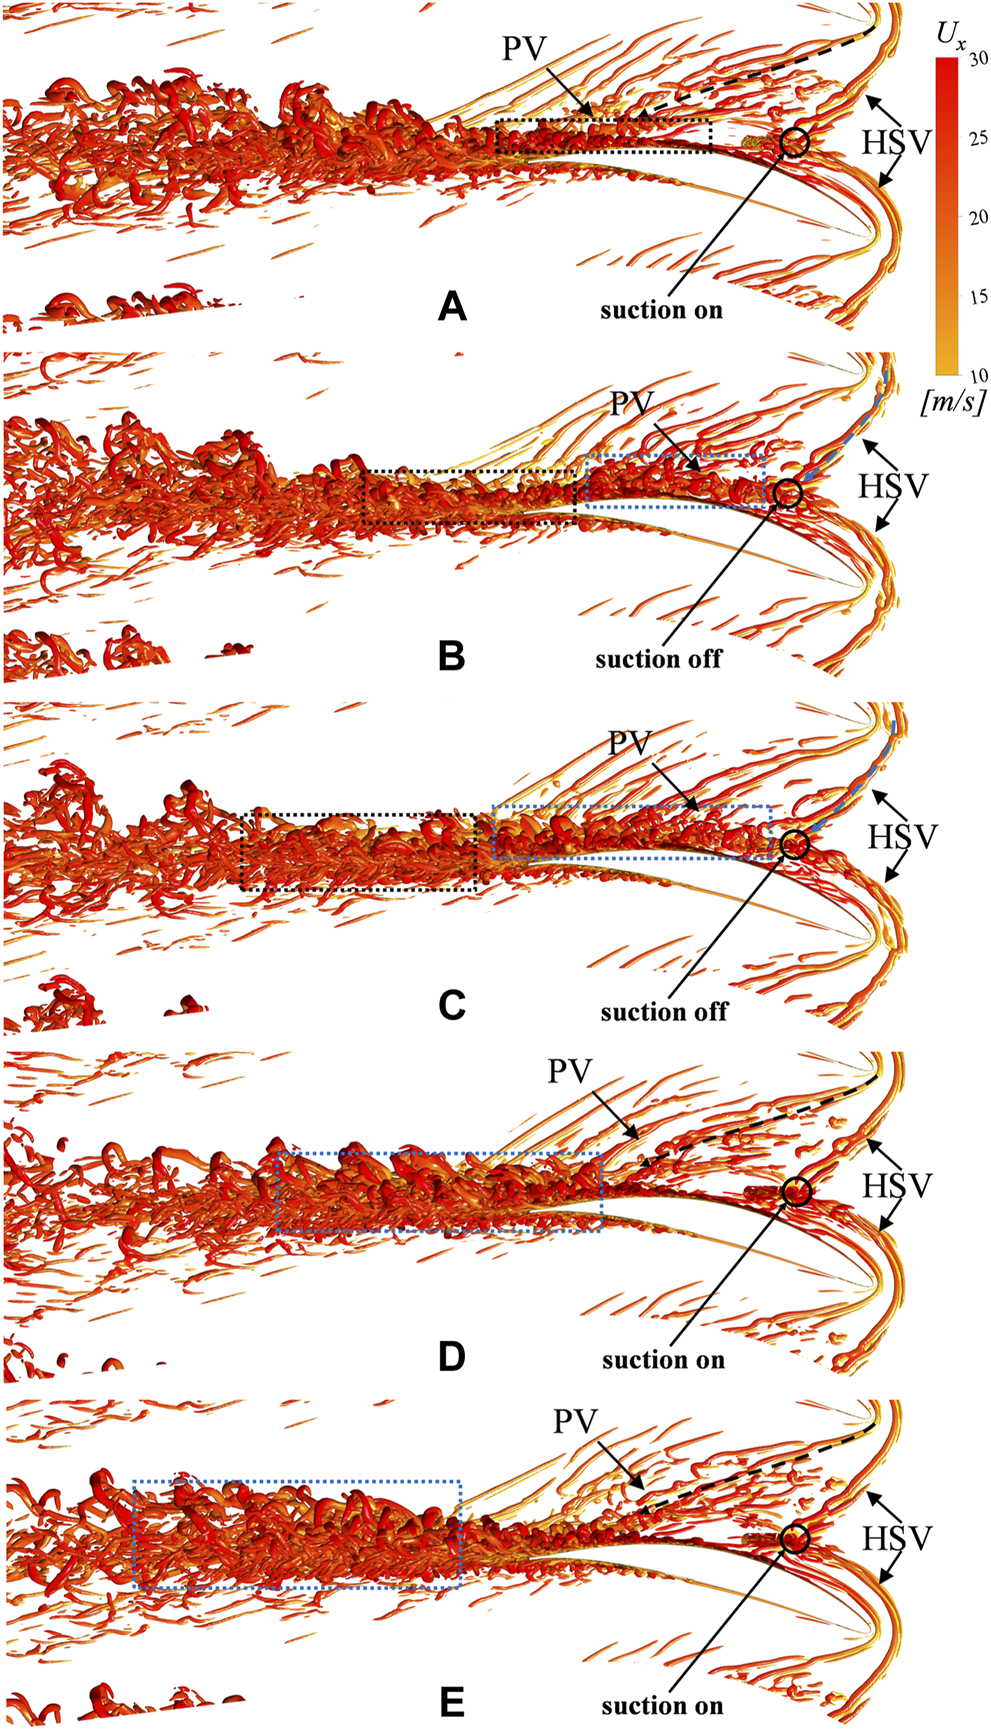
Top–down view of the instantaneous vortex structures for the PS configuration (Q = 5,000,000). (A) t = T; (B) t = T + 1/4τ(C) t = T + 1/2τ; (D) t = T + 3/4τ; (E) t = T + τ.
Figure 9 displays the evolution of the axial vorticity of the PS configuration, and the results at time T and T + 1/2τ are shown, corresponding to two different states of the suction hole in a pulse periodicity, and the contour of the Cpt can be seen in Figure 10. When t = T in Figure 9A, it can be known that the boundary layer near the endwall from the far upstream, as well as the transverse flow upstream of the suction hole, is removed by the suction hole; hence, the arising of the PV is interrupted. The formation of the PV, which is induced by the accumulation of the transverse flow near the endwall downstream of the suction hole, could be observed and indicated by the black curve. Combined with the contour of the loss evolution in Figure 10A, it can be known that less loss will be generated by the PV in this case, and its interaction with the blade suction surface flow separation will be attenuated accordingly, which contributes to the improvement of the compressor flow field. When t = T + τ in Figure 9B, the pressure leg of the HSV, colored red, and the suction leg of the HSV, colored blue, converge and give rising to the PV, as indicated by the black curve. The PV interacts with the blade suction surface flow at 60% cx downstream of the leading edge and breakdown, causing a high level of total pressure loss, as shown in Figure 10B.
FIGURE 9
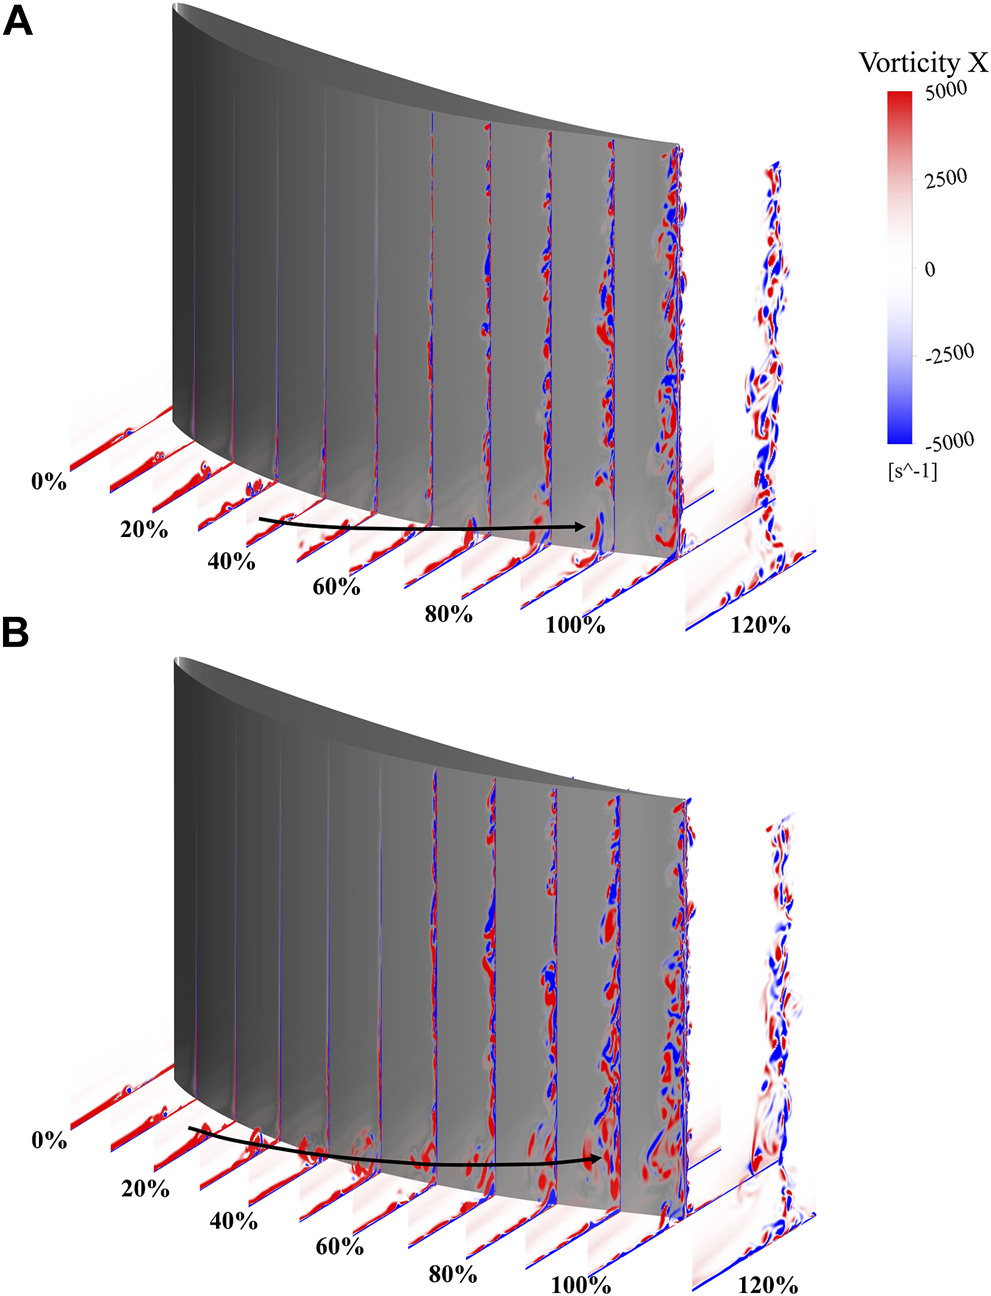
Evolution of the axial vorticity for the PS configuration. (A) t = T; (B) t = T + 1/2τ.
FIGURE 10
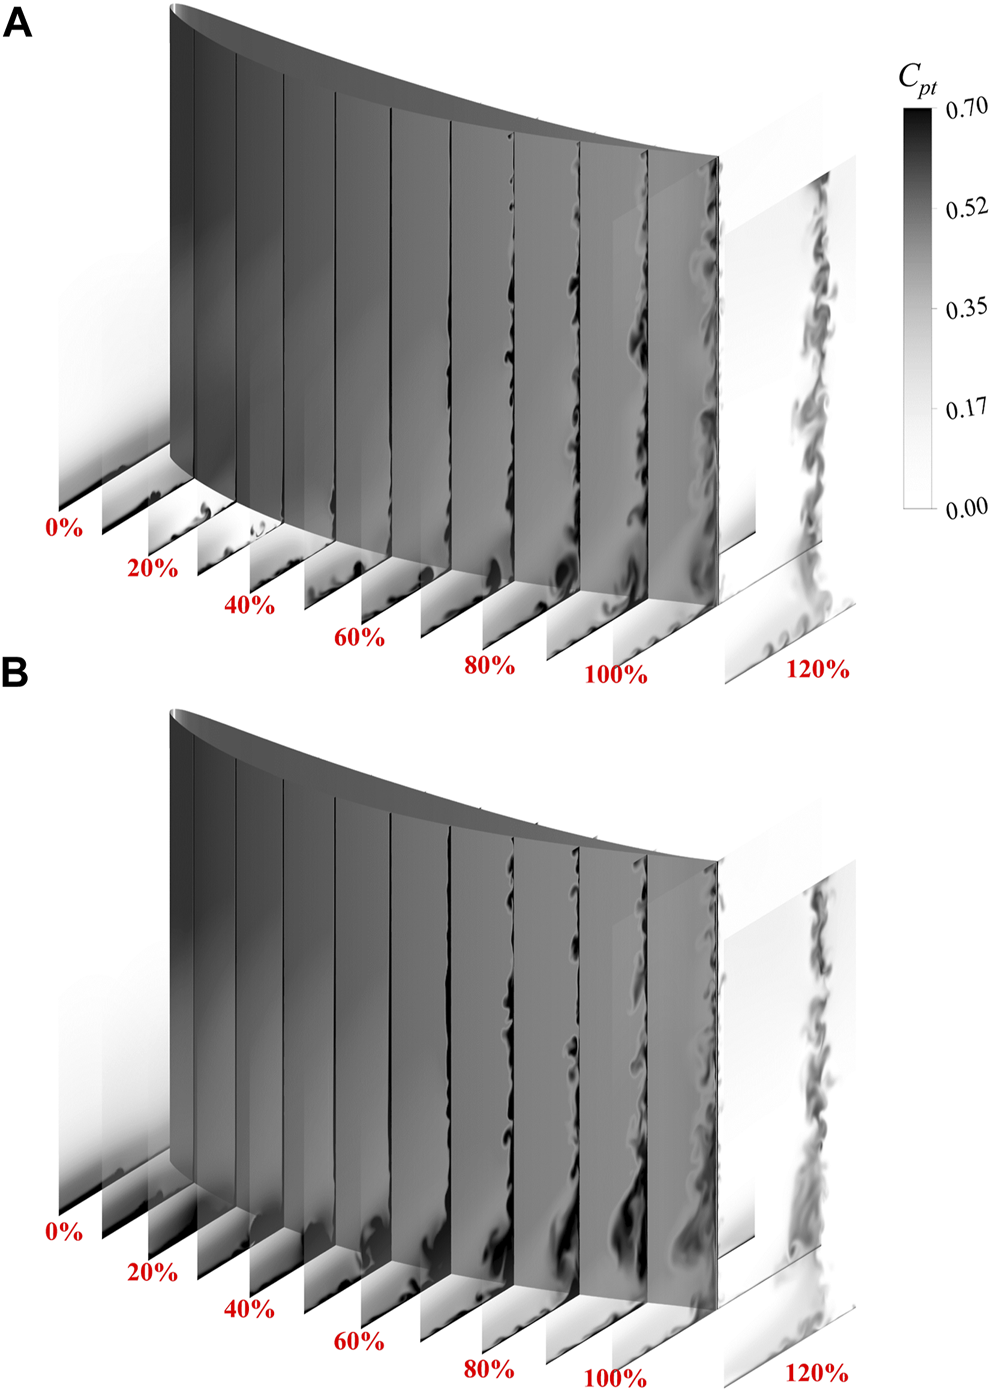
Evolution of the Cpt for the PS configuration. (A) t = T; (B) t = T + 1/2τ.
Figure 11 displays the three-dimensional instantaneous vortex structures in a pulse periodicity of the PS configuration. Combined with the analysis in Figure 8, it can be indicated that the compressor flow field is alternatively dominated by two different kinds of PV formation mechanisms under the influence of the PS. One of the PV formations is induced by the pressure leg and suction leg of the HSV, with large size, and results in a higher loss, as shown in Figures 11B, C. The other one is induced by the remaining part of the transverse flow near the endwall downstream of the suction hole, and due to the removal of most of the inlet boundary layer by the suction hole, the size of the PV is significantly reduced, and this leads to less loss. Though the suction hole can only affect the flow field near it, the formation mechanism of the PV downstream the suction hole is distinct, and in this way, the PS can have a more profound influence on the whole compressor flow field through the alternating transformation of two kinds of the PV formation mechanisms. Besides, the blade suction surface will be influenced by the periodic impingement of the PV, and the periodic perturbation of the PV will promote the momentum transport between the separated flow and the main flow, thus, leading to a further benefit in Cpt.
FIGURE 11
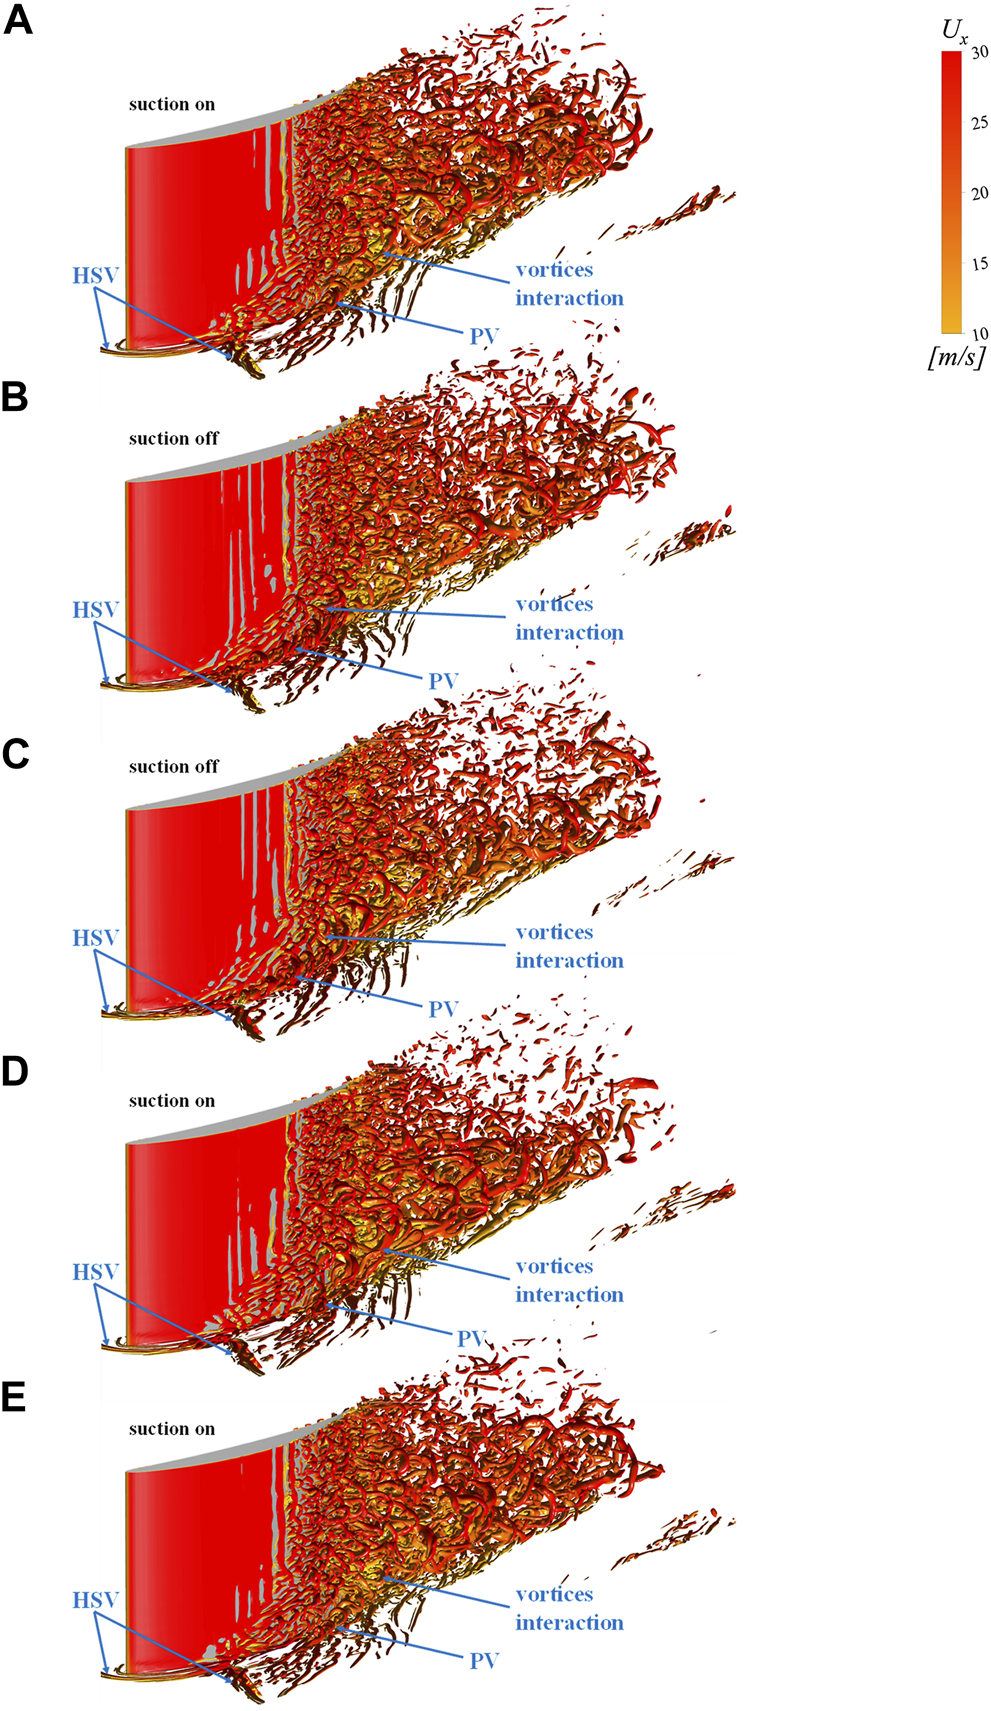
Instantaneous vortex structures for the PS configuration (Q = 5,000,000). (A) t = T; (B) t = T + 1/4τ(C) t = T + 1/2τ; (D) t = T + 3/4τ; (E) t = T + τ.
The instantaneous contour maps of the spanwise vorticity evolution of three configurations are given in Figure 12, and the contour maps at the plane at 5 mm away from the endwall are displayed. In the baseline in Figure 12A, the PV, which is derived from the convergence of the pressure leg (colored in red) and suction leg (colored in black) of the HSV, interacts with the flow on the blade suction surface at 55% cx downstream the blade leading edge at the plane 5 mm away from the endwall. The vortices breakdown and result in higher loss as it flows downstream afterward. For the CS configuration, however, the interaction of the PV and the blade suction surface flow moving downstream at 73% cx downstream the blade leading edge at the plane 5 mm away from the endwall. This indicates fewer vortex interactions and less loss generation compared with the baseline. For the PS configuration, there are two distinct flow patterns according to the opening or closing state of the suction hole, and one flow pattern is similar to that of the baseline, and the other one is similar to that of the CS configuration. These two flow patterns are alternately changed as the suction hole opens up and closes off, and this may transfer the excitation frequency of the suction hole to the whole compressor flow field, especially at the blade corner region where the PV and separated flow dominated, and reordered the local flow field; hence, the PS would have a better control performance than the CS at the same suction rate. To have better knowledge of the frequency information of the flow field, especially at the corner separated flow region, the fast Fourier transform (FFT) is applied to the local velocity at point A (marked in Figure 13A), and the results are shown in Figure 13. Figure 13 shows the power spectral density (PSD) distribution along with the frequency of three configurations, and it can be seen that the baseline, as shown in Figure 13B, has a dominant frequency of 85 Hz, and the PSD in this frequency is no more than 1,200 W/Hz. In Figure 13C of CS configuration, the dominant frequency was replaced by 1,172 Hz with a lower PSD of about 700 W/Hz. In PS configuration in Figure 13D, however, there are two frequencies (97.6 and 109.9 Hz) with large PSD, which means these two frequencies dominate the local flow field, and combined with the frequency of the PS, it can be inferred that the PS can reorder the flow field even at far downstream the suction hole through managing two kinds of the PV formation.
FIGURE 12
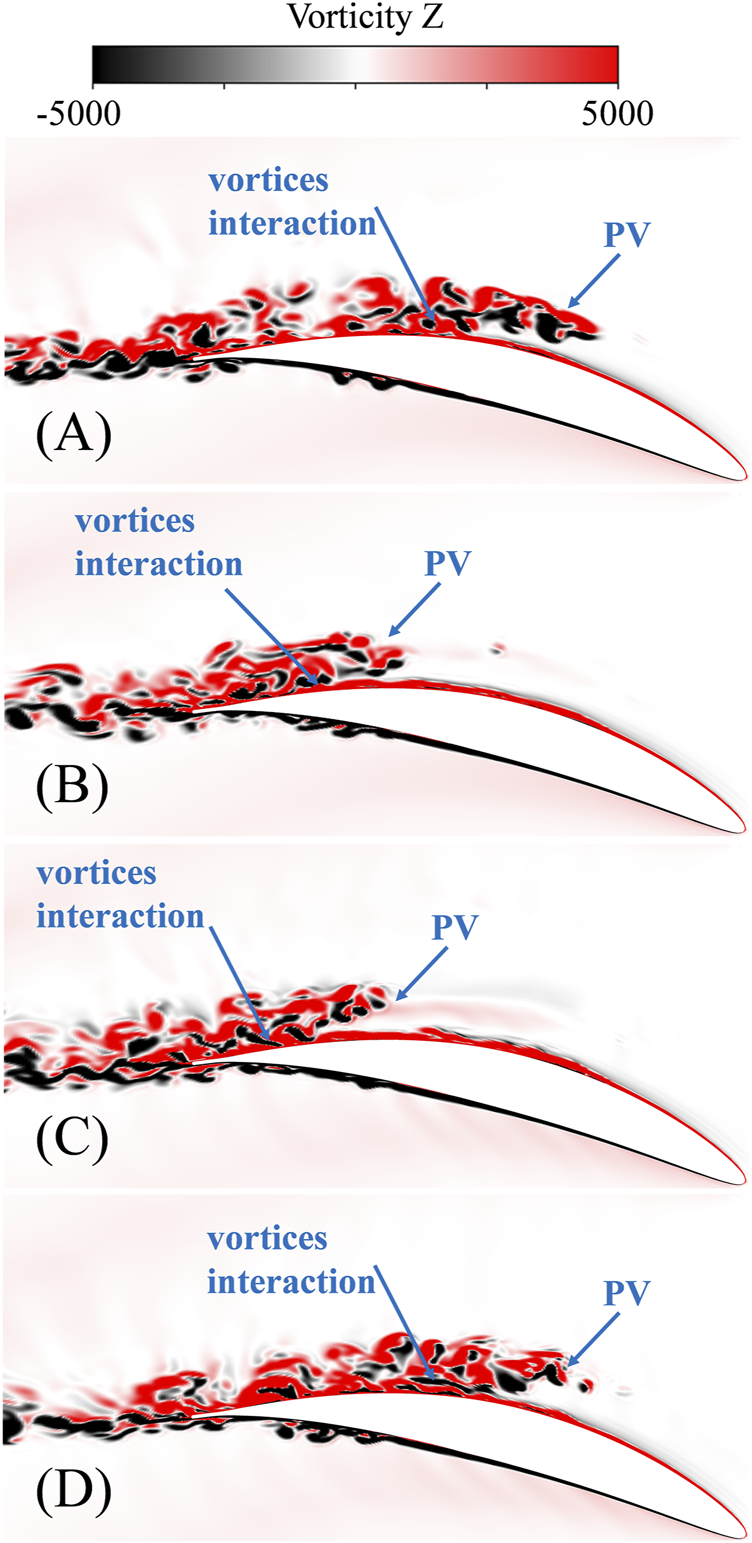
Instantaneous vorticity contour map in spanwise at plane 5 mm away from the endwall. (A) Baseline; (B) CS (C) PS, t = T + 1/2τ; (D) PS, t = T + τ.
FIGURE 13
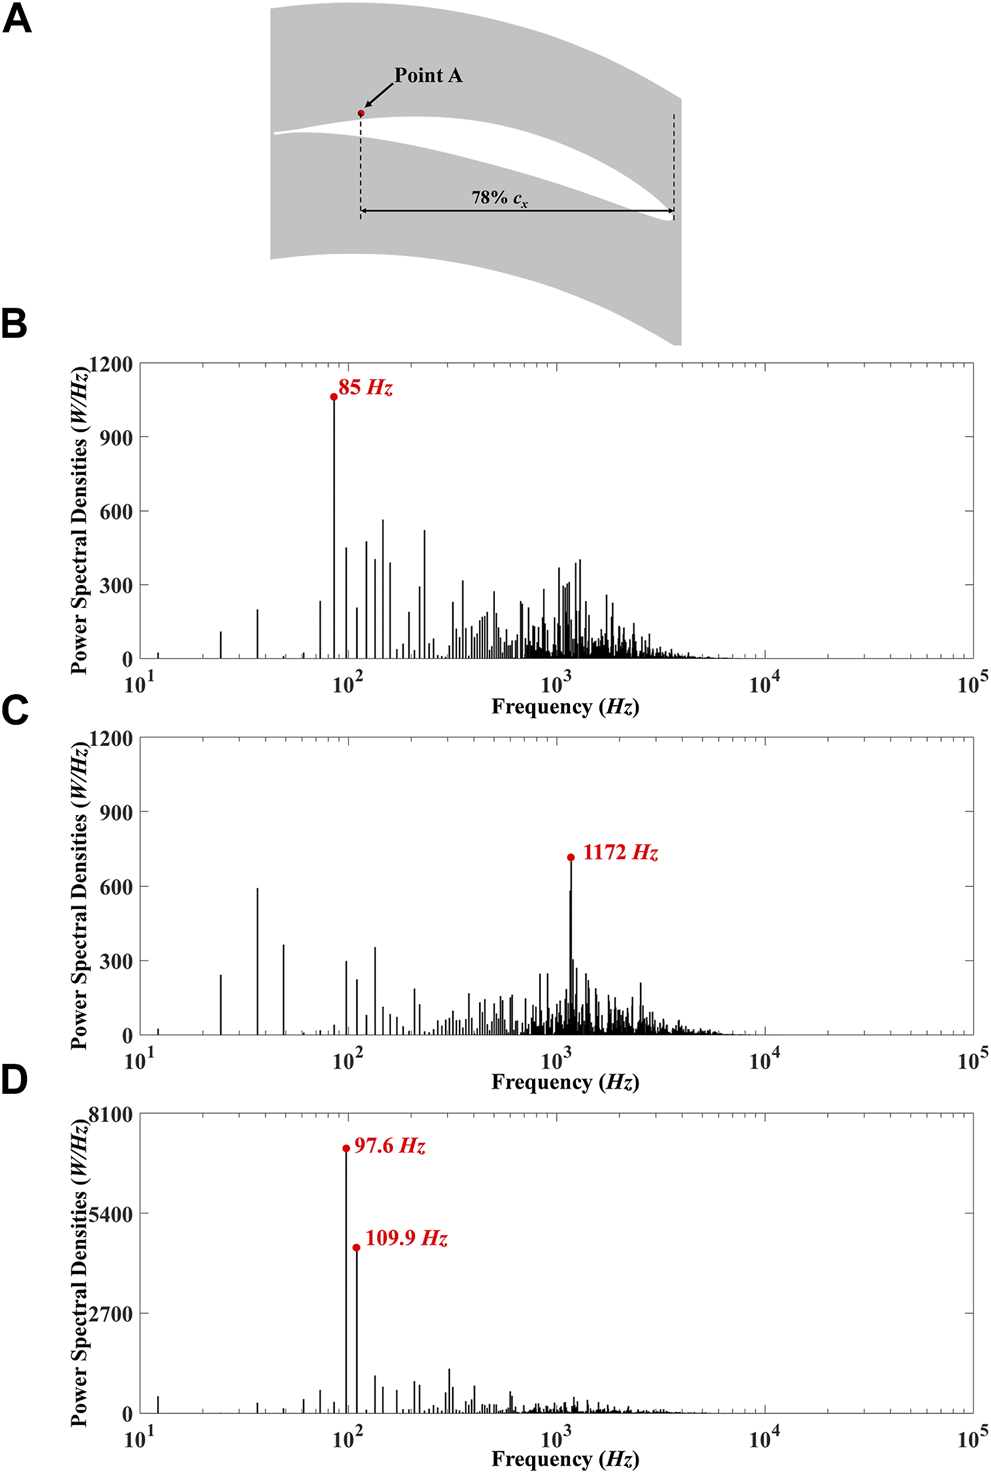
Power spectral density distributions along with frequency. (A) Monitor point definition; (B) baseline, (C) CS, (D) PS.
Proper Orthogonal Decomposition and Dynamic Mode Decomposition Analysis
The POD method can decompose the main flow structure in the flow field according to the proportion of the energy, and it not only helps in analyzing a specific mode structure independently but also removes the minor structures through reconstructing the flow field with the first few modes. The POD is based on the snapshots of the instantaneous results in this paper, and the data proceeding process is listed as follows, and detailed information can be found in
Shi et al. (2019).
(1) The decomposition of the variables and reorder.
and
X(x)represent the transient and time-averaged velocity, and
X’(x,t)is the variation value.
Xidenotes the velocity vector at
ti, and
Xis the velocity matrix.
(2) Build a covariance matrix R with the velocity matrix X.
(3) Solve the eigenvalues λ and eigenvector V of the covariance matrix R.
(4) Solve the basis vectors of the flow field.
(5) Reconstruct the flow field.
where
αjis the time coefficient of the mode j.
The interaction between the PV and the separated flow from the blade suction surface can be obviously observed on the spanwise plane 10 mm away from the endwall; therefore, the axial velocity of the spanwise plane 10 mm away from the endwall is extracted to perform the POD. Figure 14 shows the energy captured of the POD modes and the contour map of the first five orders of modes for the CS and PS configurations. Compared with the energy captured of the two configurations in Figure 14A, it can be seen that the PS increases the energy percent of the low-order modes, which indicates that the flow structures represented by the low-order modes have more ability to dominate the local flow field; hence, the flow field becomes simpler than that of the CS configurations. Besides, compared with the CS configuration in Figure 14B, it can be seen that the scale of the flow structures of the PS configuration in Figure 14C is larger, and the flow structures represented by the modes are much simpler compared with that of the CS configuration. Besides, it can be inferred that the CS only decreases the size of the vortex structures while keeping the disorder of the flow field unchanged. The PS, however, could also reorder the compressor flow field and make the flow field simpler, which could lead to a further reduction in the Cpt.
FIGURE 14
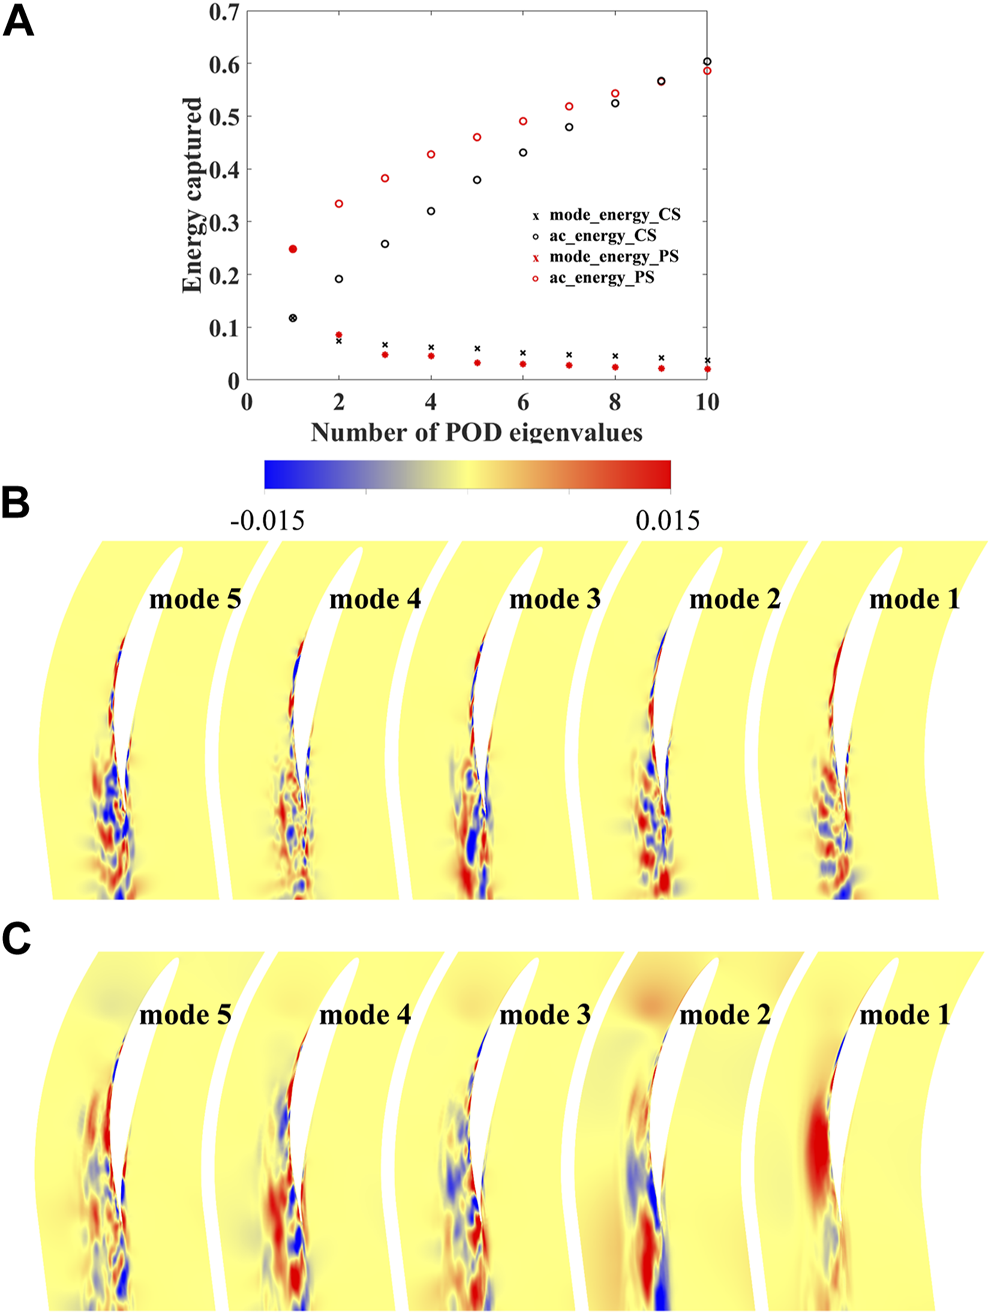
Energy captured of the proper orthogonal decomposition (POD) modes and the contour map of the first five order modes. (A) Energy captured of the POD modes; (B) CS; (C) PS.
The DMD is a method that decomposes the flow field into different dynamic modes with distinct frequencies, and the stability of the modes, as well as the flow structures they represent, can be analyzed according to the eigenvalues. Unlike the POD method, the DMD can decompose the flow field from the order of time, and the calculation process is listed as follows (detailed information can be found in
Schmid, 2010):
(1) Define velocity matrix X and Y.
where
Xand
Yare the velocity matrix consisting of velocity data at different snapshots.
(2) Singular value decomposition of the velocity matrix X.
and
Vare the singular value decomposition basis vectors of the
Xand
Scontaining the information of the singular value.
(3) Calculate the approximation matrix using the vectors U, S, and V achieved from the last step.
The matrix
Ais a transformation matrix that can achieve
Yfrom
X, and
is an approximation of
A.
(4) Solve the eigenvectors and eigenvalues of the matrix .
and
Λare the eigenvectors and eigenvalues, respectively.
(5) Calculate the DMD modes
ϕ is the matrix that contains the DMD modes.
The axial velocity of the spanwise plane 10 mm away from the endwall is extracted to perform the DMD. Figure 15 is the frequency spectra and the energy distribution for the CS and PS configurations, and the abscissa is the frequency calculated from the image part of the continuous-time eigenvalues, and the ordinate is the growth or decay rate (positive indicates unstable characteristics and negative indicates stable characteristics) of the characteristics represented by the modes for Figures 15A,B. The modes are divided into stable and unstable ones according to the DMD eigenvalues, and if the real part of the eigenvalue is positive, the corresponding flow structures represented by the mode is unstable, and vice versa. It can be known from Figure 15A that some modes (especially the low-frequency ones) of the CS configuration are unstable (concentrated on the low frequency modes), presented as the positive value of the growth rate. For the PS configuration in Figure 15B, however, all the modes are stable, which indicates the flow field can be stabilized under the effect of the pulsed excitation. For example, the boundary layer on the blade suction surface will be much easier to separate from the solid wall under the influence of a small fluctuation if the flow is in an unstable state. For the same reason, the results of DMD with stable modes, such as the PS results, will lead to less flow separation and a reduction in Cpt. From the energy distribution at each mode in Figures 15C,D, it can be observed that three dominant modes occupied most of the energy in the PS configuration, and the effect of other modes are weakened. The frequencies of the dominant modes are 1,107, 2,097, and 98.9 Hz, respectively, and all these frequencies correspond to the excitation frequency and its frequency multiplication of the excitation frequency. It can be inferred that the flow field in the PS configuration is reordered and stabilized compared with that of the CS configuration; hence, the compressor performance could be improved, and the loss generation is reduced accordingly.
FIGURE 15

Frequency spectra and the energy distribution of the CS and PS configurations. (A) Frequency spectra for the CS configuration; (B) frequency spectra for the PS configuration; (C) energy distribution for the CS configuration; (D) energy distribution for the PS configuration.
Conclusion
Based on the actual application of the bleed in aeroengine, and considering the removal of the airflow from the blade passage, an LES study of the effectiveness of the PS method for the compressor flow separation control was conducted herein. Three configurations (the baseline, CS, and PS) were used, and their flow details, including the vortex structures identified by the
Qcriterion, the
Cpt,, and the evolution of the vorticity and loss were displayed. Afterward, the POD and DMD methods were applied to analyze the flow field on the order of space and time, respectively. The following conclusions are drawn from the current investigation.
(1) At a suction flow rate of 0.25% of the main flow rate, the CS reduces Cpt by 9.36% based on the baseline, while the PS gains 24% more benefit on the basis of the CS and leads to a reduction in Cpt by 11.61% with an excitation frequency of 100 Hz, which indicates that the PS has more significant potential in reducing the total pressure loss in the compressor cascade.
(2) For the CS configuration, the reduction in the loss benefits from the reduction in the PV size in the compressor cascade. The formation of the PV is contributed by the transverse flow near the endwall at the existence of the suction hole, and the size of the PV is decreased due to the removal of the HSV. The interaction between the PV and the separation flow from the blade suction surface is postponed and attenuated; hence, the loss generation is reduced accordingly.
(3) For the PS configuration, two different PV formation mechanisms are found in the compressor cascade. The PV either arising from the HSV or contributed by the transverse flow near the endwall alternately forms, and the frequency is approximately equal to the excitation frequency according to the FFT results. The periodic perturbation of the PV promotes the momentum transport between the separated flow and the main flow, thus, leading to a further benefit in Cpt.
(4) The PS not only reduces the size of the PV but also simplifies and stabilizes the compressor flow field by introducing an excitation frequency. Compared with the CS, the proportion of energy occupied by each POD mode is transferred to lower-order modes, and the flow structures represented by lower-order POD modes become simpler in PS configuration. All DMD modes in the PS configuration are stable, which could contribute to a further loss reduction.
Statements
Data availability statement
The original contributions presented in the study are included in the article/supplementary material, Further inquiries can be directed to the corresponding author.
Author contributions
YG and SC provided the research ideas and wrote the original manuscript. YG and CZ carried out all the calculation work. YG, SC, and SW were responsible for the revision of this paper.
Funding
This work is supported by the National Natural Science Foundation of China (Grant Nos. 52076052 and 51776048) and National Science and Technology Major Project of China (Grant Nos. Y2019-VIII-0013-0174).
Conflict of interest
The authors declare that the research was conducted in the absence of any commercial or financial relationships that could be construed as a potential conflict of interest.
Publisher’s note
All claims expressed in this article are solely those of the authors and do not necessarily represent those of their affiliated organizations, or those of the publisher, the editors, and the reviewers. Any product that may be evaluated in this article, or claim that may be made by its manufacturer, is not guaranteed nor endorsed by the publisher.
Nomenclature
- c
chord
- cx
axial chord
- t
pitch
- α1
inlet metal angle
- α2
outlet metal angle
- x
axial direction
- y
pitch direction
- z
span direction
- U
velocity
- ω
vorticity
- τ
pulse periodicity
- p0
total pressure
- p
static pressure
- ρ
density
- i
incidence
- θ
inclination angle
- γ
stagger angle
- H
span height
- LE
leading edge
- TE
trailing edge
- PV
passage vortex
- HSV
horseshoe vortex
- BL
baseline
- CS
constant suction
- PS
pulsed suction.
References
1
Cerretelli C. Kirtley K. (2009). Boundary Layer Separation Control with Fluidic Oscillators. ASME J. Turbomach.131, 041001. 10.1115/1.3066242
2
De Giorgi M. G. Traficante S. De Luca C. Bello D. Ficarella A. (2012). “Active Flow Control Techniques on a Stator Compressor Cascade: A Comparison between Synthetic Jet and Plasma Actuators,” in ASME Turbo Expo 2012: Turbine Technical Conference and Exposition, Copenhagen, Denmark, June 11–15, 2012. ASME Paper. GT-2012-69535. 10.1115/GT2012-69535
3
Decaix J. Balarac G. Dreyer M. Farhat M. Münch C. (2015). RANS and LES Computations of the Tip-Leakage Vortex for Different gap Widths. J. Turbulence16, 309–341. 10.1080/14685248.2014.984068
4
Denton J. D. Xu L. (2002). “The Effects of Lean and Sweep on Transonic Fan Performance,” in ASME Turbo Expo 2002: Power for Land, Sea, and Air, Amsterdam, The Netherlands, June 3–6, 2002. ASME Paper GT2002-30327. 10.1115/GT2002-30327
5
Evans S. Hodson H. Hynes T. Wakelam C. Hiller S.-J. (2010). Controlling Separation on a Simulated Compressor Blade Using Vortex-Generator Jets. J. Propulsion Power26, 819–827. 10.2514/1.45518
6
Gao F. Ma W. Zambonini G. Boudet J. Ottavy X. Lu L. et al (2015). Large-Eddy Simulation of 3-D Corner Separation in a Linear Compressor cascade. Phys. Fluids27, 085105. 10.1063/1.4928246
7
Gbadebo S. A. Cumpsty N. A. Hynes T. P. (2008). Control of Three-Dimensional Separations in Axial Compressors by Tailored Boundary Layer Suction. ASME J. Turbomach.130, 2179–2194. 10.1115/1.2749294
8
Gbadebo S. A. Cumpsty N. A. Hynes T. P. (2005). Three-Dimensional Separations in Axial Compressors. ASME J. Turbomach.127, 331–339. 10.1115/1.1811093
9
Gümmer V. Goller M. Swoboda M. (2008). Numerical Investigation of End wall Boundary Layer Removal on Highly Loaded Axial Compressor Blade Rows. ASME J. Turbomach.130, 011015. 10.1115/1.2749297
10
Hecklau M. Van Rennings R. Zander V. Nitsche W. Huppertz A. Swoboda M. (2011a). Particle Image Velocimetry of Active Flow Control on a Compressor cascade. Exp. Fluids50, 799–811. 10.1007/s00348-010-0895-z
11
Hecklau M. Wiederhold O. Zander V. King R. Nitsche W. Huppertz A. et al (2011b). Active Separation Control with Pulsed Jets in a Critically Loaded Compressor Cascade. AIAA J.49, 1729–1739. 10.2514/1.J050931
12
Hecklau M. Zander V. Peltzer I. Nitsche W. Huppertz A. Swoboda M. (2010). “Experimental AFC Approaches on a Highly Loaded Compressor cascade,” in Active Flow Control Ⅱ. Editor KingR (Berlin, Heidelberg: Springer-Verlag Berlin Heidelberg), 171–186. 10.1007/978-3-642-11735-0_12
13
Heinichen F. Gümmer V. Plas A. Schiffer H.-P. (2011). Numerical Investigation of the Influence of Non-axisymmetric Hub Contouring on the Performance of a Shrouded Axial Compressor Stator. CEAS Aeronaut. J.2, 89–98. 10.1007/s13272-011-0007-7
14
Hunt V. D. Wray A. A. Moin P. (1988). Eddies, Streams, and Convergence Zones in Turbulent Flows. Washington D.C: Studying Turbulence Using Numerical Simulation Databases-I1, 193–232. 10.1007/978-1-4613-1063-1_7
15
Jabbal M. Liddle S. Potts J. Crowther W. (2013). Development of Design Methodology for a Synthetic Jet Actuator Array for Flow Separation Control Applications. Proc. Inst. Mech. Eng. G: J. Aerospace Eng.227, 110–124. 10.1177/0954410011428256
16
Kerrebrock J. L. Epstein A. H. Merchant A. A. Guenette G. R. Parker D. Onnee J.-F. et al (2008). Design and Test of an Aspirated Counter-Rotating Fan. ASME J. Turbomach.130, 021004. 10.1115/1.2776951
17
Kerrebrock J. L. Reijnen D. P. Ziminsky W. S. Smilg L. M. (1997). “Aspirated Compressors,” in International Gas Turbine and Aeroengine Congress and Exposition Conference, Orlando, FL, June 2–5, 1997. 10.1115/97-GT-525
18
Leggett J. Priebe S. Shabbir A. Michelassi V. Sandberg R. Richardson E. (2018). Loss Prediction in an Axial Compressor cascade at Off-Design Incidences with Free Stream Disturbances Using Large Eddy Simulation. ASME J. Turbomach.140, 071005. 10.1115/1.4039807
19
Lei V.-M. Spakovszky Z. S. Greitzer E. M. (2008). A Criterion for Axial Compressor Hub-Corner Stall. ASME J. Turbomach.130, 031006. 10.1115/1.2775492
20
Leishman B. A. Cumpsty N. A. Denton J. D. (2007). Effects of Bleed Rate and Endwall Location on the Aerodynamic Behavior of a Circular Hole Bleed Off-Take. ASME J. Turbomach.129, 645–658. 10.1115/1.2752191
21
Nicoud F. Ducros F. (1999). Subgrid-Scale Stress Modelling Based on the Square of the Velocity Gradient Tensor. Flow, Turbul. Combust.62, 183–200. 10.1023/A:1009995426001
22
Schatz M. Thiele F. (2001). “Numerical Study of High-Lift Flow with Separation Control by Periodic Excitation,” in 39th aerospace sciences meeting and exhibit, Reno, NV, January 8–11, 2001. AIAA-2001-0296. 10.2514/6.2001-296
23
Schmid P. J. (2010). Dynamic Mode Decomposition of Numerical and Experimental Data. J. Fluid Mech.656, 5–28. 10.1017/S0022112010001217
24
Seifert A. Bachar T. Koss D. Shepshelovich M. Wygnanski I. (1993). Oscillatory Blowing: A Tool to Delay Boundary-Layer Separation. AIAA J.31, 2052–2060. 10.2514/3.49121
25
Shi L. Ma H. Wang L. (2019). Analysis of Different POD Processing Methods for SPIV-Measurements in Compressor cascade Tip Leakage Flow. Energies12, 1021. 10.3390/en12061021
26
Sun S. Chen S. Liu W. Gong Y. Wang S. (2018). Effect of Axisymmetric Endwall Contouring on the High-Load Low-Reaction Transonic Compressor Rotor with a Substantial Meridian Contraction. Aerospace Sci. Technol.81, 78–87. 10.1016/j.ast.2018.08.001
27
Sun S. Wang S. Chen S. Tao C. Cai L. Chen J. (2019). The Impact of Various Forward Sweep Angles on the Performance of an Ultra-High-Load Low-Reaction Transonic Compressor Rotor. Appl. Therm. Eng.150, 953–966. 10.1016/j.applthermaleng.2019.01.045
28
Tucker P. G. (2011a). Computation of Unsteady Turbomachinery Flows: Part 1-Progress and Challenges. Prog. Aerospace Sci.47, 522–545. 10.1016/j.paerosci.2011.06.004
29
Tucker P. G. (2011b). Computation of Unsteady Turbomachinery Flows: Part 2-LES and Hybrids. Prog. Aerospace Sci.47, 546–569. 10.1016/j.paerosci.2011.07.002
30
Wei M. Xavier O. Lipeng L. Francis L. (2013). Intermittent Corner Separation in a Linear Compressor cascade. Exp. Fluids54, 1546. 10.1007/s00348-013-1546-y
31
Zambonini G. Ottavy X. Kriegseis J. (2017). Corner Separation Dynamics in a Linear Compressor cascade. J. Fluids Eng.139, 061101. 10.1115/1.4035876
32
Zhang H. Chen S. Gong Y. Wang S. Wang Z. (2018). Combined Application of Negative Bowed Blades and Unsteady Pulsed Holed Suction in a High-Load Compressor in Terms of Aerodynamic Performance and Energy Efficiency. Appl. Therm. Eng.144, 291–304. 10.1016/j.applthermaleng.2018.08.046
33
Zhang H. Chen S. (2021). Pulsed Suction Control in a Highly Loaded Compressor Cascade with Low Suction Flowrates. ASME J. Turbomach.143 (6), 1–39. 10.1115/1.4050112
34
Zheng X.-Q. Zhou X.-B. Zhou S. (2005). Investigation on a Type of Flow Control to Weaken Unsteady Separated Flows by Unsteady Excitation in Axial Flow Compressors. ASME J. Turbomach.127, 489–496. 10.1115/1.1860572
35
Zheng X. Zhou S. Hou A. Jiang Z. Ling D. (2006). Separation Control Using Synthetic Vortex Generator Jets in Axial Compressor Cascade. Acta Mech. Sin.22, 521–527. 10.1007/s10409-006-0042-5
Summary
Keywords
axial compressor, flow control, constant suction, pulsed suction, large eddy simulation
Citation
Gong Y, Chen S, Zeng C and Wang S (2022) Active Flow Control Based Bleed in an Axial Compressor Cascade Using Large Eddy Simulation. Front. Energy Res. 10:853280. doi: 10.3389/fenrg.2022.853280
Received
12 January 2022
Accepted
07 February 2022
Published
15 March 2022
Volume
10 - 2022
Edited by
Xiao Liu, Harbin Engineering University, China
Reviewed by
Zhiyuan Cao, Northwestern Polytechnical University, China
Shijun Sun, Beijing Institute of Technology, China
Updates
Copyright
© 2022 Gong, Chen, Zeng and Wang.
This is an open-access article distributed under the terms of the Creative Commons Attribution License (CC BY). The use, distribution or reproduction in other forums is permitted, provided the original author(s) and the copyright owner(s) are credited and that the original publication in this journal is cited, in accordance with accepted academic practice. No use, distribution or reproduction is permitted which does not comply with these terms.
*Correspondence: Shaowen Chen, cswemail@hit.edu.cn
This article was submitted to Advanced Clean Fuel Technologies, a section of the journal Frontiers in Energy Research
Disclaimer
All claims expressed in this article are solely those of the authors and do not necessarily represent those of their affiliated organizations, or those of the publisher, the editors and the reviewers. Any product that may be evaluated in this article or claim that may be made by its manufacturer is not guaranteed or endorsed by the publisher.