 Wenyong Wang
 Qunhai Huo
 Ningyu Zhang
 Jianfu Ni
 Jinda Zhu3
95% of researchers rate our articles as excellent or good
Learn more about the work of our research integrity team to safeguard the quality of each article we publish.
Find out more
ORIGINAL RESEARCH article
Front. Energy Res. , 31 March 2022
Sec. Smart Grids
Volume 10 - 2022 | https://doi.org/10.3389/fenrg.2022.852509
This article is part of the Research Topic Edge Computation and Digital Distribution Networks View all 8 articles
With the high-proportion accession of renewable energy and randomness of the load side in the new energy power system, unbalanced feeder power and heavy overload of the transformer caused by massive access of highly uncertain source loads become more and more serious. In order to solve the aforementioned problems, a honeycomb topology of the multi-station integrated system is proposed. The soft open point (SOP) is used as the key integrated equipment of the internal unit of a multi-station integrated system. The honeycomb grid structure is composed of flexible nodes, and the multi-station integrated system is composed of multi-network flexible interconnection. Based on the characteristics of the regional resource endowment, hydrogen energy flow is deeply coupled in parts of honeycomb grids. In order to improve the reliability and flexibility of the multi-station integrated unit, the structure of the new multi-station integrated unit, the power balance constraints on the unit, and the switching process of SOP control mode are studied. At the same time, the hydrogen electricity coupling structure and the coordinated control strategy of hydrogen electricity conversion are proposed to solve the problem of deep application of hydrogen energy. Finally, the effectiveness of the proposed multi-station integrated system is verified by using three simulation models.
With the development of energy reform, the development of high-proportion renewable energy accession and high-proportion power electronic equipment application, and supply side randomness and demand side randomness in power system is accelerated (Ding et al., 2020). With the increasing plug and play loads connected to the power grid and the increasing proportion of distributed power generation and electric vehicles, the operation of the traditional power grid is faced with a series of problems, such as feeder power imbalance, heavy overload of transformer, difficulty in capacity expansion of transmission, and distribution network (Liu et al., 2020; Sarantakos et al., 2021). Meanwhile, the conflict between the randomness of large-scale clean energy and the demand for power quality of new electrical equipment has intensified (Mudaliyar and Mishra 2021; Sun et al., 2021; Yang et al., 2021). Therefore, it is urgent to upgrade the network structure of the existing power grid to solve the aforementioned problems.
In recent years, researchers have proposed many solutions, among which multi-station integration is an important direction (Zhang et al., 2019; Xincong et al., 2020; Zhang et al., 2020; Li et al., 2021). Multi-station integration is “a system that integrates multiple functional stations related to energy and information communication adjacent to geographical locations such as distributed renewable energy power station, electric vehicle charging station, energy storage power station, data center, and 5G base station.” At present, the research on the multi-station integrated system is still in its infancy. The problem of solving the integration of four functional stations through mixed integer linear programing (MILP), namely, fast charging stations, plug-in electric vehicles, renewable energy, and energy storage systems is analyzed (Moradzadeh and Abdelaziz 2020); the low-cost operation problem of the integration of three functional stations of electric bus charging stations, photovoltaic, and battery integrated energy storage system is studied (Zhuang and Liang 2021); a multi-index comprehensive evaluation method based on the analytic hierarchy process and risk entropy weight is proposed (Zhu et al., 2022), which verifies that the proposed comprehensive evaluation method can objectively and comprehensively evaluate the operation of the multi-station integrated energy system and assist it to optimize the operation mode and strategy; A day-ahead optimal operation model of the multi-station integration system is proposed (Zhu et al., 2021), which can improve the operation economy of integration station, while reducing carbon emissions and ensuring power supply reliability. A multi-station integrated duopoly profit distribution mechanism based on the Stackelberg model is constructed (Xie et al., 2021). Most of the existing studies on the multi-station integration are simple and nearly a combination of multiple functional stations, focusing on research scenarios, coordination and optimization, but the research depth of integration and integration between the functional stations is insufficient. The topology design does not fully consider the high-quality power supply and consumption demand of the functional stations. There are still deficiencies in the power flow mutual assistance of multi-functional stations in the system, and the complementary characteristics between the multiple functional stations are not fully brought into play. Compared with other energy storage methods, hydrogen energy storage has obvious advantages in large-scale and long-term energy storage. However, the overall conversion efficiency of “electricity to hydrogen to electricity” is low, and the application scenario and efficient conversion mode of distributed generation hydrogen production are not clear.
The optimal operation of SOP in the distribution networks can not only solve feeder imbalance but also improve the penetration of distributed generation and realize the flexible operation of the distribution network (Ji et al., 2019; Li et al., 2019; Chen et al., 2020; Sun et al., 2020; Wang et al., 2020). To solve the aforementioned problems, a new honeycomb multi-station integrated system, which integrates various functional stations through SOP, is proposed, and a mesh-flexible interconnected multi-station integrated system centered on flexible nodes is established. Taking the micro-energy network as the basic unit of the multi-station integrated system, the integration of electric energy flow and hydrogen energy flow is realized in the unit. The new multi-station integration unit structure, power to balance constraint, and control mode switching of SOP are presented. At the same time, the hydrogen electric coupling structure and coordinated control strategy are proposed to realize the deep application of hydrogen electric coupling. Finally, three simulation examples verify the effectiveness and superiority in the honeycomb topology based on SOP. The major contributions of this study are as follows:
(1) Based on the honeycomb distribution network, a honeycomb multi-station integrated topology is proposed, which integrates various functional stations through SOP. The system stability and networking flexibility are improved, and the consumption of renewable energy is promoted.
(2) Considering hydrogen energy as a flexible resource, the flow and conversion of hydrogen-electric energy in the honeycomb distribution network are analyzed. Then, the coordinated control strategy of hydrogen electric coupling power is proposed, which provides a solution for the deep coupling problem of “electricity–energy flow” and “hydrogen–energy flow.”
(3) Three simulation examples verify that the proposed honeycomb multi-station integrated system can effectively improve the stability of the system and promote the consumption of renewable energy.
This article continues the idea of the honeycomb power grid (Wang et al., 2018; Jiang et al., 2019) and proposes a flexible interconnected hydrogen electric coupling distribution grid structure, as shown in Figure 1. In the honeycomb topology, a multi-station integrated unit is established with the flexible node as the central area, and multiple units form a ring network structure through the interconnection of the honeycomb power flow. The multi-station integrated unit can adopt AC, DC, or AC/DC hybrid power distributed mode, which has a series of advantages, such as high power supply reliability, flexible power distributed mode, convenient access to new energy, and so on. As an important core energy station, hydrogen energy is deeply integrated with the honeycomb power grid. At the same time, energy storage power station and hydrogen energy station participate in the coordinated operation of the whole energy grid system as flexible resources. The reliability analysis of this topology is shown in Supplementary Appendix SA1.
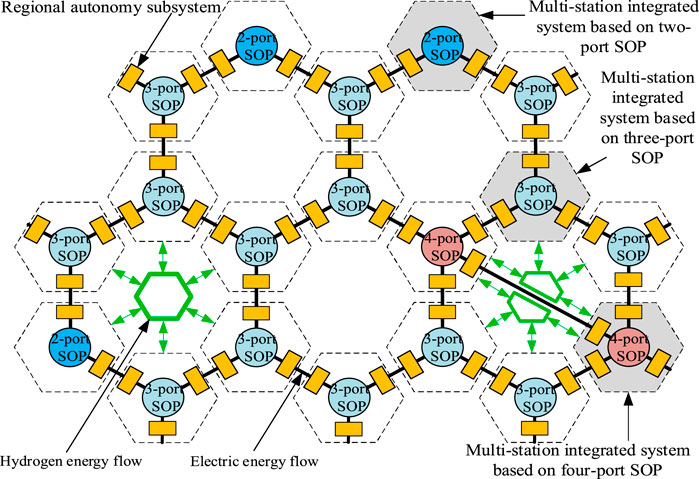
FIGURE 1. Schematic diagram of honeycomb grid topology.
The honeycomb multi-station integrated system based on SOP has the following characteristics:
(1) It has high compatibility and can access various types of distributed power and AC/DC loads, which is conducive to the upgrading of the existing power grid.
(2) Each multi-station integrated unit is a relatively independent autonomous system. The basic self-balance of supply and demand in the unit to the greatest extent can be realized, and the power can be freely exchanged with adjacent units through flexible equipment.
(3) The networking mode is flexible and can adapt to the characteristics of various load types of power grid in the future, which can be connected separately by AC or DC or by mixed AC and DC.
(4) The power supply reliability is high. When the system has small disturbance, there are more power sources that can provide power support for the fault side than the traditional power grid. Large disturbance in the traditional power grid will lead to large-area power failure, while the honeycomb power grid only needs to isolate the fault area.
(5) The ability to absorb renewable energy is strong, which can avoid the voltage fluctuation caused by the randomness and indirectness of renewable energy power generation, and the local absorption and grid connection collection of renewable energy reduce the long-distance transmission of electric energy.
With the rapid development of new energy, the current power system energy flow has gradually expanded on one-way flow to two-way flow, and from single energy access to the power grid to multi-state access to the power grid. The power system is changing from single energy carrier to multi energy carrier, which brings great challenges to the operation of the distribution system. The renewable utilization rate of the electrolytic water hydrogen production device at a larger time scale should be improved. The “green hydrogen” technology of hydrogen production of renewable energy to deal with the volatility and consumption of wind power and photovoltaic power generation has become an important path for high-efficiency consumption of renewable energy. It has become an important research topic to maximize the local utilization of renewable energy through hydrogen electric coupling technology.
Based on SOP, wind power station, photovoltaic power station, energy storage power station, hydrogen production station, hydrogen gas turbine, and electric vehicle, this study couples the electric energy flow and hydrogen energy flow through the multi-station integrated system. The schematic diagram of the internal hydrogen electric energy flow and conversion is shown in Figure 2. The honeycomb multi-station integrated system converts the new energy that cannot be absorbed by the power grid or cannot be easily used by the power grid into the hydrogen energy storage through “hydrogen energy flow” so as to provide hydrogen for fuel cell electric vehicles and gas engines and realize 100% local absorption of new energy.
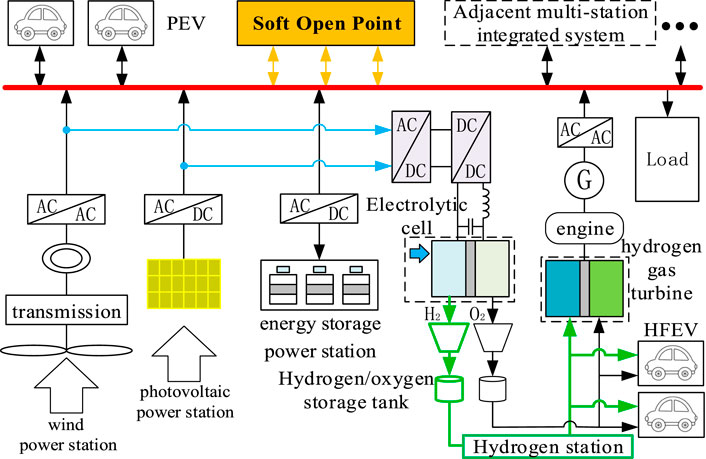
FIGURE 2. Schematic diagram of internal hydrogen/electric energy flowed and conversion.
As an important part of the honeycomb multi-station integrated hydrogen electric coupling system, wind power station and photovoltaic power station provide local energy for the load. When the electric energy generated by the wind power station and photovoltaic power station system is surplus, the surplus electric energy is first obtained by electrolyzing water in the hydrogen production station and stored in the hydrogen storage tank, and then stored in the energy storage power station. If the electric energy generated by the power generation system is insufficient to meet the power demand of users, energy will be supplied by the auxiliary power generation system of gas turbine and energy storage power station. If the user load cannot be met, the load demand of the system can be met through the mutual assistance of power flow of adjacent multi-station integrated units.
As the key equipment of the multi-station integrated system, the three-port SOP highly integrates multiple functional stations (distributed renewable energy power station, electric vehicle charging station, energy storage power station, hydrogen energy station, etc.) in the multi-station integrated unit, as shown in Figure 3.
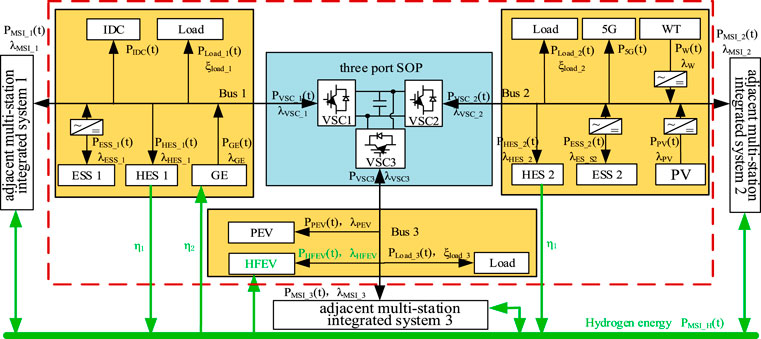
FIGURE 3. Multi-station integrated subsystem based on the three-port SOP.
In practical engineering application, hydrogen energy can be reasonably allocated according to local resources, and electric energy can form various distribution structures such as “three-station integration” and “five-station integration” according to the actual characteristics of the existing power grid. The multi-station integrated unit has the structural characteristics of diversification, replication, and expansion.
The SOP has different control modes according to different operating states of the system. The switching of SOPs’ control mode in this study is shown in Table 1.
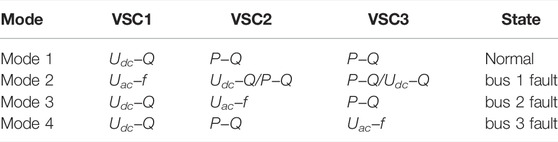
TABLE 1. Three-port SOP control mode.
In case of the feeder fault, the port on the fault side needs to switch to Uac−f control mode to ensure the continuous power operation of the important loads. If the port on the fault side is in the Udc−Q control mode, the non-fault port needs to be switched to the Udc−Q control mode. After the feeder fault is eliminated, the control mode is switched to the normal operation state. When switching to the control mode, it is necessary to consider the control mode switching strategy to avoid the transient impact of the converter output current, resulting in oscillation and impact on the operation stated switching of the multi-station integrated unit.
The switching control method of controller state tracking and introducing inertia link is adopted. The controller block diagram is shown in Figure 4. (The control strategy in the figure takes VSC1 as an example.)
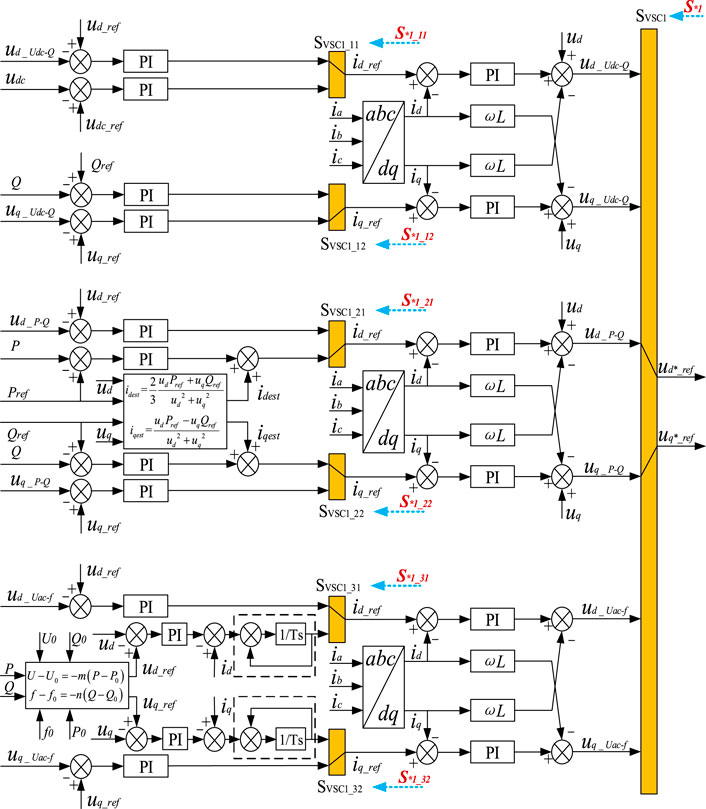
FIGURE 4. SOP control mode.
The controller state tracking is to take ud and uq of the current control mode as the input signals of the system, and ud and uq of the other control modes track ud*_ref and uq*_ref in real time, respectively, so as to ensure that the output voltage can match when the converter is switched from one working mode to another, and reduce the oscillation or overshoot caused by the system operation mode switching. Finally, the smooth switching of the three port SOP working mode can be realized. At the same time, the inertia link is introduced into the controller, which can increase or decrease the hysteresis of iref during system switching, so as to suppress the impact caused by the sudden change of iref, and make the reference current of the inner loop gradually adjust to the required value of the constant voltage and constant frequency. In addition, the power flowed to transfer command and logic switch switching command of the SOP controller are provided by the control center of the multi-station integration system, so as to coordinate with other functional stations.
In order to realize the stable operation of the multi-station fusion unit, this section gives the power model of each functional station in the multi-station fusion unit. The model contains many integer variables to indicate the operational state of resources and many continuous variables, such as the power flow variables.
The output power function of the photovoltaic is as follows:
In the formula, PSTC is the output power of photovoltaic panels under standard conditions; kc is the temperature coefficient; TPV is the actual temperature of the photovoltaic panels; Tref is the standard ambient temperature; Ar is the area of the photovoltaic panel; and ηPV is the efficiency of the photovoltaic panels.
The output power function of the wind turbine is as follows:
In the formula,
Assuming that the maximum charging power of the energy storage device is equal to the maximum discharge power, it is satisfied in the charging and discharging process:
In the formula, PESS,max and PESS,min represent the upper and lower limits of charge and discharge power for the energy storage devices, respectively.
The charge state at the end of discharge is equal to the initial charge state.
In the formula, SOCi and SOC(i-1) are the charge state of battery energy storage at time i and i-1, respectively; ηc and ηd are the charging efficiency and discharging efficiency of the battery energy storage, respectively.
To simplify the analysis, IDC and 5G are treated as the constant power models.
The hydrogen–electric conversion device consists of three parts: electrolytic cell, hydrogen storage tank, and hydrogen gas engine.
The output power of the electrolyzer can be expressed as follows:
In the formula, PGE(t) is the input power of the cell and ηGE is the working efficiency of the electrolyzer.
The output power of the hydrogen gas engine can be expressed as follows:
where Ptank-HES (t) is the input power of the hydrogen gas engine and ηHES is the efficiency of the hydrogen gas engine.
A hydrogen storage tank is used to store hydrogen produced by the electrolytic water. It can also provide hydrogen for the hydrogen gas engine and improve system flexibility. The mathematical model of the energy storage can be expressed as follows:
where Etank(t) is the energy stored in the hydrogen storage tank at time t, Etank (t-1) is the energy stored in the hydrogen storage tank at time t-1, ηtank is the working efficiency of the hydrogen storage tank, and ηGE_DC/DC and ηHES_DC/DC are the working efficiency of DC/DC at the port side of the electrolyzer and hydrogen gas engine, respectively.
The maximum output power of the electrolytic cell and the maximum output power of the hydrogen gas engine are limited by their capacity and the remaining storage energy of the hydrogen storage tank, which are expressed as follows:
where CGE and CHES are the capacities of the electrolyzer and hydrogen gas engine, respectively; Etank_min and Etank_max are the lower and upper limits of the storage energy of the hydrogen storage tank, respectively.
In the multi-station integrated unit shown in Figure 3, PMSI(t), PIDC(t), PVSC(t), Pload(t), P5G(t), PESS(t), PHES(t), PGE(t), PPV(t), PPEV(t), and PHFEV(t), respectively, represent the exchange power between the multi-station integrated system and the adjacent multi-station integrated system at t time, the load power of the data center, the input/output power of each port of SOP, the power of the conventional switchable load, the load power of the 5G base station, the charge/discharge power of the energy storage power station, the power consumed by hydrogen production in the hydrogen energy station, the output power of the gas engine, the output power of the photovoltaic power station, charge/discharge power of the pure electric vehicle, and the absorbed power of the hydrogen fuel electric vehicle; ξload1/2/3 is the load-shedding rate of conventional load; λMSI、λVSC、λESS、λHES、λGE、λPV、λPEV、and λHFEV are 0/1 variable, which can be expressed as follows:
The power models on the three feeders of SOP can be expressed as follows:
In eq. 23, M1 represents the number of pure electric vehicles and M2 represents the number of hydrogen-fueled electric vehicles. In this article, the feeder line loss and power electronic converter loss are ignored.
The multi-station integrated system should also meet the hydrogen energy power conservation:
Among them, α represents the energy conversion rate of electric hydrogen production; β represents the utilization rate of hydrogen energy, that is, the remaining hydrogen energy in the hydrogen pipeline can be expressed as (1-β)[λHES_1PHES_1(t)+λHES_2PHES_2(t)].
SOP should meet the active power balance constraint. Compared with the system loss, the active power loss of VSCi is very small and can be ignored in the optimization process. The active power emitted or absorbed meets the following equation:
Substituting Eqs 21–24 into Eq. 25, the power model of the multi-station integrated system can be obtained as follows:
At the same time, each functional station involved in the multi-station integrated system also needs to meet its corresponding operation constraints.
Considering the actual dynamic response delay characteristics of the electrolytic cell and gas engine, when the pressure pH2 of the hydrogen storage tank is within the normal range, both the electrolytic cell and gas engine can realize power transfer according to their respective power reference values and aiming at balancing the power difference between the supply and demand. At this time, the main function of the energy storage power station is to stabilize the slow dynamic response process when the power of the electrolytic cell and gas engine changes by its good transient performance. The power coordination control strategy flow of the honeycomb multi-station integrated hydrogen electric coupling system is shown in Figure 5.
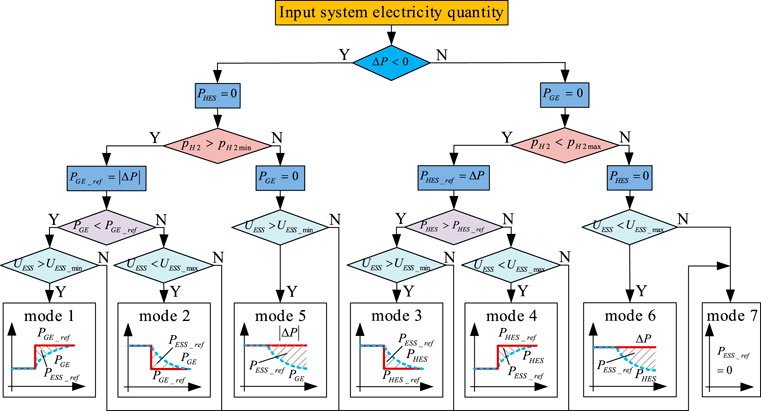
FIGURE 5. Flowchart of the system power coordination control strategy.
When the PV/wind output is less than the load demand (ΔP < 0) and the pressure pH2 of the hydrogen storage tank is within the normal range, the hydrogen production station is shut down (PHES = 0), and the gas turbine is used as the auxiliary power supply (PGE_ref = |ΔP|). If the electric field energy reserve of the energy storage power station is sufficient at this time (UESS > UESS_min), the energy storage power station will release energy to make up for the power shortage of the dynamic process of the gas engine (mode 1). If the energy storage power station is not full at this time (UESS < UESS_max), the energy storage power station will absorb the residual energy of the system to stabilize the residual power in the dynamic process of the gas engine (mode 2).
When the PV/wind output is greater than the load demand (ΔP > 0), the pressure pH2 of the hydrogen storage tank is within the normal range. At this time, the gas turbine is shut down (PHES = 0), and the hydrogen production station converts the residual energy of the system into hydrogen and stores it in the hydrogen storage tank (PHES_ref = ΔP). If the electric field energy reserve of the energy storage power station is sufficient at this time (UESS > UESS_min), the energy storage power station will release energy to make up for the power shortage of the dynamic process of the gas engine (mode 3). If the energy storage power station is not full at this time (UESS < UESS_max), the energy storage power station will absorb the system residual energy to balance the residual power in the dynamic process of the hydrogen production station (mode 4).
When the PV/wind output is less than the load demand (ΔP < 0), the pressure pH2 of the hydrogen storage tank is within the abnormal range. At this time, the hydrogen production station is shut down (PHES = 0), and the gas engine is shut down (PGE = 0). If the electric field energy reserve of the energy storage power station is sufficient (UESS > UESS_min), the energy storage power station will release energy to balance the power shortage of the system (mode 5). If the energy storage power station is not full at this time (UESS < UESS_max), the energy storage power station will absorb the residual power of the system (mode 6). If the aforementioned mode conditions cannot be met, the energy storage plant will also shut down (PESS_ref = 0) (mode 7).
In order to verify the feasibility of the proposed multi-station integrated system topology and control strategy, a simulation model of the hydrogen electric coupling multi-station integrated system based on three-port SOP is built in Matlab/Simulink environment, and its specific dynamic response characteristics are tested and analyzed.
VSCi (i = 1,2,3) under the normal operation of the three-port SOP is controlled by Udc−Q, P−Q, and P−Q, respectively. Setting 1.0 s to start the three-port SOP, the control center provides control instructions. The power flow control response curve of starting SOP is shown in Figure 6.

FIGURE 6. Power flow control response curve.
In Figure 6, after a short period of power flow adjustment in SOP, the power of bus 1, bus 2, and bus 3 will soon reach equilibrium. Through the application of SOP to the multi-station integrated system, the power flow regulation between the distributed networks can be easily realized, which can provide important support for the further coordinated operation of the multi-station integrated system.
It is assumed that the active loads of the three ports after ignoring the internal self-balancing part of the micro-grid are 100, 100, and 160 kW, respectively. The feeder load balancing is the control target, and the power flowing into the DC side of SOP is positive. During the normal operation, the active power of the three ports is 20, 20, and 40 kW, respectively.
(1) At 0.2 s, 90-kw load is input to bus 2. After the regulation of SOP, the active power of the three ports is 50, −40, and −10 kW, respectively. At 0.4 s, 60-kW load is cut off in bus 3. After the regulation of SOP, the active power of the three ports is 30, −60, and 30 kW, respectively. Figure 7 shows the system load on/off simulation waveform.
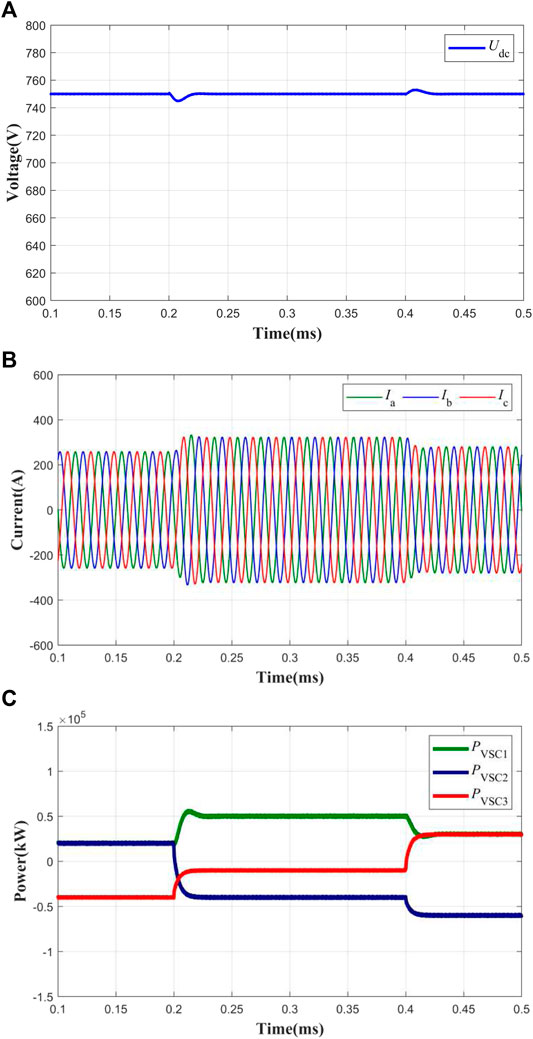
FIGURE 7. Simulation waveform of the load on/off. (A) SOP Bus voltage at dc side. (B) Three phase current of Ia, Ib, Ic (Bus1 as an example). (C) Active power of VSC1, VSC2, VSC3.
The load on/off simulation waveform in Figure 7 shows that when the load is input or removed, the SOP can realize the rapid power flow transfer in the system, and the multi-station integration unit can reach a stable operation state within 20 ms.
(2) When it is set at 0.3 s, the upper power grid connected to bus 3 fails and the 100-kW load is cut off. At this time, VSC3 is switched from P−Q control to Uac−f control. Figure 8 shows the simulation waveform of load voltage on the fault side.

FIGURE 8. Simulation waveform of the load voltage at the fault side.
This example verifies the effectiveness of the SOP control mode switching strategy. It can be seen from the simulation waveform in Figure 8 that under the action of SOP smooth switching control, when the power grid fails, the feeder voltage at the fault side can quickly recover and stabilize, and the uninterrupted and stable power supply of power loss load in the multi-station integration unit can be realized. At the same time, the feeder voltage on the fault side also quickly reaches a stable state. From this, we can conclude that the power flowed transfer and rapid power supply recovery of the multi-station integration unit can be realized through the power regulation of SOP, so as to ensure the flexibility and stability of the system operation. In addition, regulating the multi-station integration unit through SOP can provide basic guarantee of the coordination and interaction among the multiple functional stations.
This example analysis adopts the typical scenario of the multi-station integration system, as shown in Figure 9, which includes the three-port SOP, renewable energy power stations A1-A3, sensitive load B0, conventional loads B1-B3, bus 1-4, energy storage power station E1, hydrogen production station H1, hydrogen gas turbine G1, and hydrogen storage station.
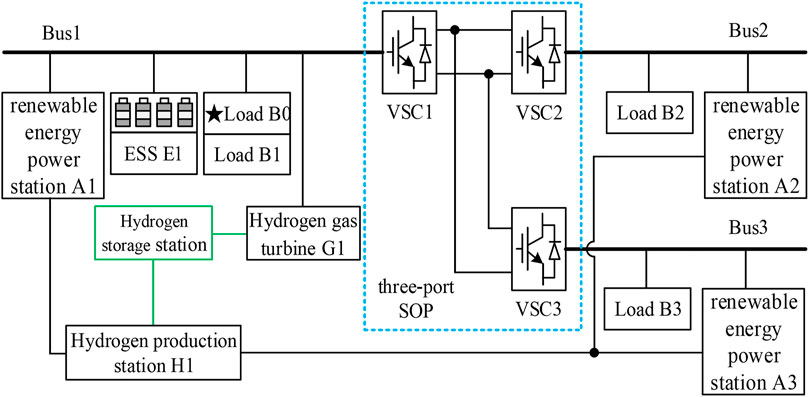
FIGURE 9. Case of scenario.
During the normal operation of bus 1-3, the functional stations are in independent operation or partially coupled operation, and the energy utilization efficiency is not high. In case of power grid failure, the existing equipment on the line is relied on to provide a short-term power support. After bus 1-3 are interconnected with SOP and hydrogen electric coupling equipment is added, one-way flow of energy to multi-directional flow can be changed, and the single station operation switches to the multi-station coordinated operation. In this example, 100% new energy generation is considered, and the power loss of power equipment and lines is ignored. Based on the one operation day, the operation conditions of three bus 1-3 are given, respectively, as shown in Figures 10–12.
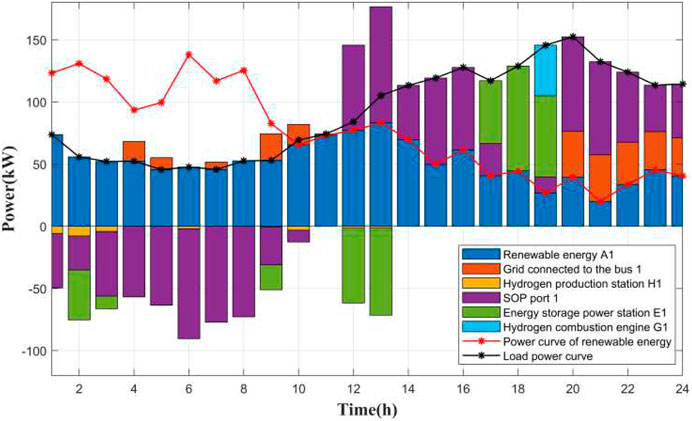
FIGURE 10. Operation of bus 1.
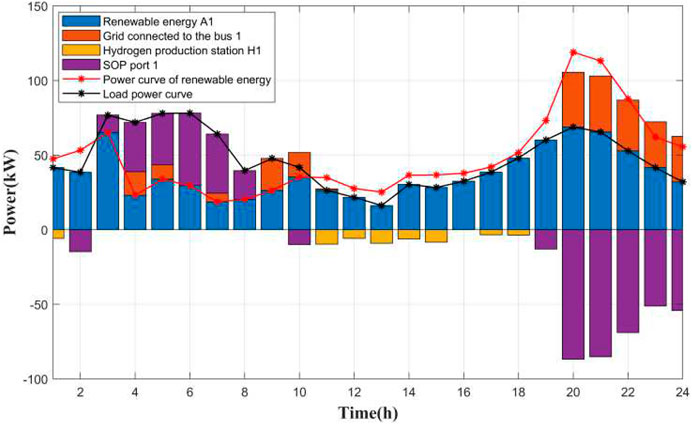
FIGURE 11. Operation of bus 2.

FIGURE 12. Operation of bus 3.
The daily power consumption loaded power curve of the load B0-B3 is shown in Supplementary Appendix SA2. The daily output curve of A1-A3 renewable energy powered station is shown in Supplementary Appendix SA3. The minimum transferable power of SOP port is set to 10 kW. When the power is less than 10 kW and cannot be transferred, it is absorbed through H1 of the hydrogen production station. Bus 1 grid becomes faulty from 17:00 to 19:00. The example scenario is analyzed as follows:
During the period from 01:00 to 13:00, the power generation of renewable energy in the system is greater than the load. The maximum consumption of renewable energy is realized through the power flow transfer of SOP, and the excess power is stored in the energy storage power station E1 or the energy that cannot be consumed is made into hydrogen through the hydrogen production station H1 for storage. During the period from 14:00 to 16:00, the energy storage power station E1 reaches its charged state, and the excess energy is completely consumed by the hydrogen production station H1. During the period from 17:00 to 19:00, due to the power grid failure of bus 1, the power support is first provided by the discharge of energy storage power station E1. At 19:00, the power of the energy storage power station is insufficient, and the hydrogen combustion gassed engine G1 burns hydrogen to supplement the power. During the period from 20:00 to 24:00, the renewable energy power generation of the system is less than the load. Bus 1-3 provide power through the power grid and makes up for the insufficient power of the system through the power flow transfer of SOP.
Through the example analysis, the integration of renewable energy power stations, energy storage power stations, flexible switching stations, hydrogen production stations and other functional stations, and the deep coupling of electric energy flow and hydrogen energy flow through the multi-station integrated system can achieve 100% consumption of new energy. By participating in the coordinated operation of the whole energy network system as a flexible resource together with the hydrogen energy station, the power supply timed and system power supply reliability of sensitive loads can be improved, and the comprehensive utilization rate of system resources can also be improved.
Aiming at the operation flexibility and reliability requirements of the renewable energy power system with double high and double random characteristics, a honeycomb multi-station integrated system composed of SOP is proposed. The multi-station integrated unit structure, power to balance constraint, and SOP control mode switching are studied. At the same time, the hydrogen electric coupling structure and coordinated control strategy are also presented. The flexibility and reliability of the multi-station integrated system is verified through the three simulation examples. The proposed multi-station integrated system can not only adapt to the development trend of the power grid in the future but also has a series of advantages, such as simple structure, easy replication and expansion, reliable power supply, economic operation, flexible control, and so on. Through the in-depth application of the honeycomb topology and SOP, the multi-station integrated system can improve the comprehensive performance of the distribution network, the consumption capacity of distributed generation, and the reliability of the system power supplies.
The research content of this article is expected to promote the practical application process of multi-station integrated technology in the future power grid and accelerate the popularization and application of multi-station integrated technology in the future intelligent distributed network.
The original contributions presented in the study are included in the article/Supplementary Material, further inquiries can be directed to the corresponding author.
WW: conceptualization, methodology, and writing—original draft. QH: software and methodology; NZ: methodology; JN, JZ, and ZY: validation; and TW: supervision.
This work is supported by the National Key R&D Program of China (No.2021YFB2601604) and the Strategic Priority Research Program of the Chinese Academy of Sciences (XDA21050304).
Author JN, JZ, ZY were employed by NARI Technology Co.,Ltd.
The remaining authors declare that the research was conducted in the absence of any commercial or financial relationships that could be construed as a potential conflict of interest.
All claims expressed in this article are solely those of the authors and do not necessarily represent those of their affiliated organizations, or those of the publisher, the editors and the reviewers. Any product that may be evaluated in this article, or claim that may be made by its manufacturer, is not guaranteed or endorsed by the publisher.
The Supplementary Material for this article can be found online at: https://www.frontiersin.org/articles/10.3389/fenrg.2022.852509/full#supplementary-material
Chen, Y., Sun, J., Zha, X., Yang, Y., and Xu, F. (2020). A Novel Node Flexibility Evaluation Method of Active Distribution Network for SNOP Integration. IEEE J. Emerging Selected Top. Circuits Syst. 11 (1), 188–198. doi:10.1109/JETCAS.2020.3039535
Ding, T., Wang, Z., Jia, W., Chen, B., Chen, C., and Shahidehpour, M. (2020). Multiperiod Distribution System Restoration with Routing Repair Crews, Mobile Electric Vehicles, and Soft-Open-Point Networked Microgrids. IEEE Trans. Smart Grid 11 (6), 4795–4808. doi:10.1109/tsg.2020.3001952
Ji, H., Wang, C., Li, P., Ding, F., and Wu, J. (2019). Robust Operation of Soft Open Points in Active Distribution Networks with High Penetration of Photovoltaic Integration. IEEE Trans. Sustain. Energ. 10 (1), 280–289. doi:10.1109/tste.2018.2833545
Jiang, D., Xu, N., Jiang, C., Hu, L., and Zhu, B. (2019). Conception, Key Technology and Prospect of Honeycomb-Shape Active Distribution Network. Automation Electric Power Syst. 43 (17), 1–11. doi:10.7500/AEPS20180730017
Li, J., Zhang, Z., Cai, H., Zhang, L., and Huang, X. (2021). “Construction Method of “Multi-Station Integration” Operation System Based on Ubiquitous Power Internet of Things,” in 2021 International Conference on Artificial Intelligence and Smart Systems (ICAIS), 1343–1346. doi:10.1109/ICAIS50930.2021.9395800
Li, P., Ji, H., Wang, C., Zhao, J., Song, G., Ding, F., et al. (2019). Optimal Operation of Soft Open Points in Active Distribution Networks under Three-Phase Unbalanced Conditions. IEEE Trans. Smart Grid 10 (1), 380–391. doi:10.1109/tsg.2017.2739999
Liu, W., Fu, M., Yang, M., Yang, Y., Wang, L., Wang, R., et al. (2020). A Bi-Level Interval Robust Optimization Model for Service Restoration in Flexible Distribution Networks. IEEE Trans. Power Syst. 36 (3), 1843–1855. doi:10.1109/TPWRS.2020.3038400
Moradzadeh, M., and Abdelaziz, M. M. A. (2020). A New MILP Formulation for Renewables and Energy Storage Integration in Fast Charging Stations. IEEE Trans. Transp. Electrific. 6 (1), 181–198. doi:10.1109/tte.2020.2974179
Mudaliyar, S., and Mishra, S. (2021). Real-Time Coordinated Control of Low-Voltage DC Distribution Network with Soft Opening Point. IEEE Trans. Power Electron. 36 (6), 7123–7137. doi:10.1109/tpel.2020.3037020
Sarantakos, I., Zografou-Barredo, N.-M., Huo, D., and Greenwood, D. (2021). A Reliability-Based Method to Quantify the Capacity Value of Soft Open Points in Distribution Networks. IEEE Trans. Power Syst. 36 (6), 5032–5043. doi:10.1109/tpwrs.2021.3071088
Sun, F., Ma, J., Yu, M., and Wei, W. (2020). Optimized Two-Time Scale Robust Dispatching Method for the Multi-Terminal Soft Open Point in Unbalanced Active Distribution Networks. IEEE Trans. Sustain. Energ. 12 (1), 587–598. doi:10.1109/TSTE.2020.3013386
Sun, F., Ma, J., Yu, M., and Wei, W. (2021). Optimized Two-Time Scale Robust Dispatching Method for the Multi-Terminal Soft Open Point in Unbalanced Active Distribution Networks. IEEE Trans. Sustain. Energ. 12 (1), 587–598. doi:10.1109/tste.2020.3013386
Wang, C., Peng, L., and Yu, H. (2018). Development and Characteristic Analysis of Flexibility in Smart Distribution Network. Automation Electric Power Syst. 42 (10), 13–21. doi:10.7500/AEPS20171012002
Wang, J., Zhou, N., Chung, C. Y., and Wang, Q. (2020). Coordinated Planning of Converter-Based DG Units and Soft Open Points Incorporating Active Management in Unbalanced Distribution Networks. IEEE Trans. Sustain. Energ. 11 (3), 2015–2027. doi:10.1109/tste.2019.2950168
Xie, Z., Tang, H., Han, X., Zhang, C., and Sun, Y. (2021). Duopoly Benefit Distribution Mechanism Under Multi-Station Integration Based on Stackelberg Model. Power Syst. Technol. 45 (10), 4009–4015. doi:10.1109/APPEEC48164.2020.9220407
Xincong, L., Mingze, Z., and Cheng, Q. (2020). “Location Evaluation of Multi-Station Integration Based on AHP-Fuzzy Comprehensive Evaluation Method,” in 2020 12th IEEE PES Asia-Pacific Power and Energy Engineering Conference (APPEEC), 1–5. doi:10.1109/APPEEC48164.2020.9220407
Yang, X., Xu, C., Zhang, Y., Yao, W., Wen, J., and Cheng, S. (2021). Real-Time Coordinated Scheduling for ADNs with Soft Open Points and Charging Stations. IEEE Trans. Power Syst. 36 (6), 5486–5499. doi:10.1109/tpwrs.2021.3070036
Zhang, S., Ma, Y., Yang, J., Zhou, M., Qin, J., and Li, H. (2019). “Comprehensive Evaluation Method of Safety and Benefit for Multi-Station Integration,” in 2019 IEEE Sustainable Power and Energy Conference (iSPEC), 2618–2623. doi:10.1109/iSPEC48194.2019.8975335
Zhang, Y., Zhang, C., Zou, Y., Chen, J., Sun, L., Yang, Z., et al. (2020). “Planning Strategy of Multi-Station Integration for Substations in Power Systems,” in 2020 IEEE International Conference on Advances in Electrical Engineering and Computer Applications( AEECA), 576–581. doi:10.1109/AEECA49918.2020.9213535
Zhu, L., Xiao, C., Ding, S., Li, W., Zhang, C., Gao, J., et al. (2021). Day-ahead Optimal Operation of Multi-Station Fusion System Considering Carbon Emission. Power Demand Side Manage. 23 (05), 40–45. doi:10.3969/j.issn.1009-1831.2021.05.009
Zhu, Y., Liu, X., Mu, X., Dai, F., Xu, W., and Qian, W. (2022). Multi-Index Comprehensive Evaluation of Multi-Station Integrated Energy System Based on Analytic Hierarchy Process and Risk Entropy Weigh. Electrical Measurement & Instrumentation. Available at: http://kns.cnki.net/kcms/detail/23.1202.th. 20220114.1628.005.html (Accessed 02 06, 2022).
Keywords: honeycomb topology, soft open point, multi-station integration, hydrogen electric coupling, coordination control
Citation: Wang W, Huo Q, Zhang N, Ni J, Zhu J, Yu Z and Wei T (2022) Hydrogen-Electric Coupling Coordinated Control Strategy of Multi-Station Integrated System Based on the Honeycomb Topology. Front. Energy Res. 10:852509. doi: 10.3389/fenrg.2022.852509
Received: 11 January 2022; Accepted: 07 March 2022;
Published: 31 March 2022.
Edited by:
Haoran Ji, Tianjin University, ChinaCopyright © 2022 Wang, Huo, Zhang, Ni, Zhu, Yu and Wei. This is an open-access article distributed under the terms of the Creative Commons Attribution License (CC BY). The use, distribution or reproduction in other forums is permitted, provided the original author(s) and the copyright owner(s) are credited and that the original publication in this journal is cited, in accordance with accepted academic practice. No use, distribution or reproduction is permitted which does not comply with these terms.
*Correspondence: Qunhai Huo, aHVvcXVuaGFpQG1haWwuaWVlLmFjLmNu
Disclaimer: All claims expressed in this article are solely those of the authors and do not necessarily represent those of their affiliated organizations, or those of the publisher, the editors and the reviewers. Any product that may be evaluated in this article or claim that may be made by its manufacturer is not guaranteed or endorsed by the publisher.
Research integrity at Frontiers
Learn more about the work of our research integrity team to safeguard the quality of each article we publish.