 Anant Milan Khalkho
 Bhargav Rapada1†
 Gourab Majumder
 Murthy Cherukuri
 Dusmanta Kumar Mohanta
- 1Department of EEE, Birla Institute of Technology, Mesra, Ranchi, India
- 2Department of EEE, NIST Institute of Science and Technology, Berhampur, India
The global concerted effort toward achieving carbon neutrality has given impetus to the accelerated growth of renewable energy sources with government patronage. The smart grid has the mandate to integrate renewable energy sources adeptly toward meeting the vision of carbon neutrality by 2050 in many countries. Solar energy generation has emerged as one of the most viable options due to the rapid stride of innovations in this domain as well as due to the decreasing trend of the cost of photovoltaic (PV) technology. However, the uncertain sunlight leading to uncertain solar energy generation with a low-capacity factor has been a challenge to maintain the legacy reliability of the power system. Unlike a two-state model being used for analyzing conventional generators, a multistate model has been proposed for incorporating the random variation of solar energy generation correlating with random irradiance. An innovative approach for formulating probabilistic modeling of solar energy is implemented to evaluate different reliability indices such as loss of load probability (LOLP) and expected energy not served (EENS). Different case studies with results prove the efficacy of the proposed probabilistic model–based availability of solar power generation due to solar irradiance uncertainty along with interaction with stochastic load model on smart grid reliability and carbon neutrality.
Introduction
The contemporary electric power system is undergoing unprecedented changes with the proliferation of distributed energy sources (DERs), inducted to mitigate the adverse effects of fossil fuel–based generating units on the ecosystem (Alrashidi et al., 2021). However, the inclusion of DERs (such as wind and solar) having stochastic nature poses many new challenges to the existing smart grids (Jiang et al., 2021). The ever-increasing power demand requires a diverse combination of renewable and conventional generation (Manohar et al., 2020), which further requires new methodologies to incorporate the technological changes (Kumar, Mohanta, and Reddy 2015). The existing methodologies must consider the intermittency associated with the non-conventional generating sources and its impact on the reliability of the grid. Furthermore, the replacement of conventional fossil fuel–based units with greener technologies must achieve carbon neutrality (Gopakumar et al., 2014) without compromising the overall generation capacity. Solar energy has tremendous potential across the world as a viable alternative to traditional energy sources to contribute toward carbon neutrality.
Motivation
In order to extract a significant amount of power from solar panels, considerable space is required (Tripathi et al., 2021), and hence replacing a conventional generator with a single solar farm may not be feasible. As a consequence, solar energy is captured at numerous locations in a given region that receives an equivalent amount of solar radiation.
The modeling of intermittency associated with distributed power generation is a major challenge in analyzing the impact on power system reliability. In contrast to the conventional generating units, which are usually represented by a two-probability state (up state and down state) model, solar energy is associated with multiple probability states (Ostovar et al., 2021) due to varying levels of irradiance at different intervals of time. The multiple probability states of solar energy are approximated using standard probability density functions (PDFs). However, the pattern of solar irradiance varies with changes in season, and hence it is difficult to determine the PDF to accurately represent them (Sreenivasulu et al., 2021). Therefore, an accurate generalized probabilistic model to represent the uncertainty associated with solar power needs a careful approach. The interaction of the probabilistic solar generation model with the discrete stochastic load model (DSLM) is another important aspect for the computation of the reliability of the electric grids (Vardi, Zahavi, and Avi-Itzhak,1977). Conventionally, the interaction of the generation model with the load model is represented by the convolution process, which becomes complex and time-consuming with an increase in the number of generating units and multistate load model. The computations can be drastically reduced if the interactions of the models are analyzed in the frequency domain (Proakis and Manolakis,2021).
The motivation of this research is to model the uncertainty and intermittency associated with solar irradiance, which can be easily combined with load uncertainty and outage of conventional generating units to obtain the reliability of the system with reduced computations. The impact of the inclusion of solar distributed generation (DG) on carbon emissions is also investigated to achieve carbon neutrality.
Past Research
Many research studies have been proposed in the recent past for reliability modeling of solar irradiance and integration of the solar system with the conventional systems. The focus of this work was to track the maximum irradiance for obtaining maximum solar power (Yan et al., 2018; Li et al., 2021; de Vries, Loonen, and Hensen 2021), assess reliability based on power loss due to variable insolation (Pandit et al., 2021), determine the reliability of electric vehicles (Hashemi-Dezaki 2019; Talukdar et al., Deka, and Goswami 2021), and optimize the cost for reliability evaluation (Ram, Bhandari, and Kumar 2021). However, the major challenge for the present and upcoming grid-connected solar DG system is to adequately supply the load demand (Okundamiya 2021), which needs to be addressed. A significant amount of work has been reported for adequacy assessment of wind farm integrated power system (Ak et al., 2018; Zhu and Zhang, 2018); however, limited work has been reported on adequacy of solar DG considering the intermittency of solar irradiation. The power generated by a PV cell depends on the intensity of solar irradiation, which further depends on the location of the solar unit. The uncertainty of solar generation is represented by probability density functions, which vary with the change in seasons of the year (Vale 2015). Normal distribution function (Kim et al., 2020) and Weibull distribution (Afzaal et al., 2020) function have been used to represent the global solar irradiation data. Hence, a common simplified model needs to be developed to represent solar data to integrate the solar DG with the conventional reliability assessment schemes. The adequacy assessment schemes also involve multiple iterations, which need to be further addressed.
Reliability analysis of solar photovoltaic systems has been reported in considering the components of the solar PV systems (Pradeep Kumar and Fernandes 2017; Gautam and Kaushika 2002). The methods take into account the solar PV arrays and the grid-connected converter, but the solar irradiation intermittency is not taken into account. Although intermittency of solar irradiation has been taken into account by Yin, Molini, and Porporato (2020), the research does not consider a generalized model for it. The topological variations for solar irradiation have been taken into account for reliability studies in Carpio (2021); Almaktar, Elbreki, and Shaaban (2021), but the methods for reliability evaluation are complex. The consideration of irradiation uncertainty having multiple states in generation makes the reliability evaluation process complex. The FFT-based algorithm used in Lakshmi et al. (1995) is imperative to make the computations simpler. Also, carbon neutrality with the inclusion of solar DG needs to be taken into account (Kumar, Mohanta, and Reddy 2015; Wyrwa et al., 2022).
Unique Contributions
Solar PV has been globally deployed; hence, the solar irradiation uncertainty modeling in a generalized way can facilitate significantly toward impact assessment on reliability and carbon neutrality. The representation of solar irradiation using different PDFs at different locations is cumbersome, and hence a generalized model for the representation of the probabilities of solar irradiation has been developed. The model is also consistent with topological variations so that interactions of a multistate solar power model with the stochastic load model as well as with the random outage probabilities of conventional generating units are blended suitably using the frequency domain approach for computation. The algorithm used for generation planning considering carbon neutrality is computationally efficient with lesser memory requirements. In a nutshell, the unique contributions of the present research as compared to the existing literature are as follows:
1) Development of a generalized probabilistic model for the representation of solar intermittency taking topological variations into account.
2) Impact assessment of solar power generation uncertainty on the reliability using smart grid discrete production simulation (SGDPS).
3) Frequency domain approach for reliability evaluation using efficacious interaction of the stochastic load model along with binary state conventional generator outage model.
4) Assessment of net carbon neutrality by integration of solar PV generation instead of coal-based generation.
The remainder of the study is organized as follows: Section 2 formulates a probabilistic model for solar power uncertainty; the section proposes a generalized model for solar irradiation based on Weibull distribution. Section 3 discusses the discrete production simulation considering uncertainty in solar DG for reliability analysis of smart grids. Section 4 analyzes the impact of solar generation considered in the present work on carbon neutrality and Section 5 provides a discussion on the results of the proposed methodology.
Generalized Probabilistic Model for Solar Uncertainty Representation
Solar energy generation plays a quintessential role in achieving carbon neutrality due to its availability in abundance. However, the nature of solar energy is uncertain in nature, which needs to be represented mathematically for the purpose of analysis in generation planning for a more reliable and smarter grid. For analyzing the impact of uncertainty related to the randomness of solar irradiation, a suitable probabilistic distribution has been chosen to truly reflect the stochastic nature of solar irradiation. Such distribution is selected based on its appropriateness corresponding to the time series data. The distribution gives information about the probabilistic nature of the solar irradiation in terms of probability of occurrence and distribution of irradiation values at a particular site. In general, the stochasticity of wind is depicted by the Weibull distribution. However, because several distributions have been used to represent solar irradiation, defining the distribution that is capable of representing solar irradiation is challenging. Despite the fact that Weibull distributions have produced better results for time-series data sets, beta distributions are commonly used to depict solar DGs (Afzaal et al., 2020). As a result, the Weibull distribution is used to represent the data sets in this study.
Representation of Data Using Weibull Distribution
It is vital to get the data in the time-series format in order to describe the solar data using the Weibull distribution. The present study utilizes the data from various locations in California, the United States, because that state receives the maximum solar irradiation all year round. Two locations, namely, farm 1 and farm 2 were chosen to represent a distributed generation. Hourly data of each location are considered for a duration of 2 years (2018–2019) from 7:00 a.m. to 5:00 p.m. The data points can be represented by Eq. 1. Here
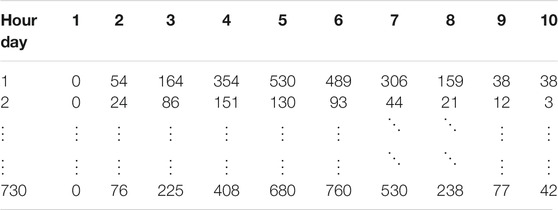
TABLE 1. Representation of irradiance data (W/m taken for 10 h for 2 years (730 days).
The data given by Eq. 1 are a time-series data for a duration of 10 h each day, and hence the data of the duration considered (1 year) can be approximated to Weibull distribution
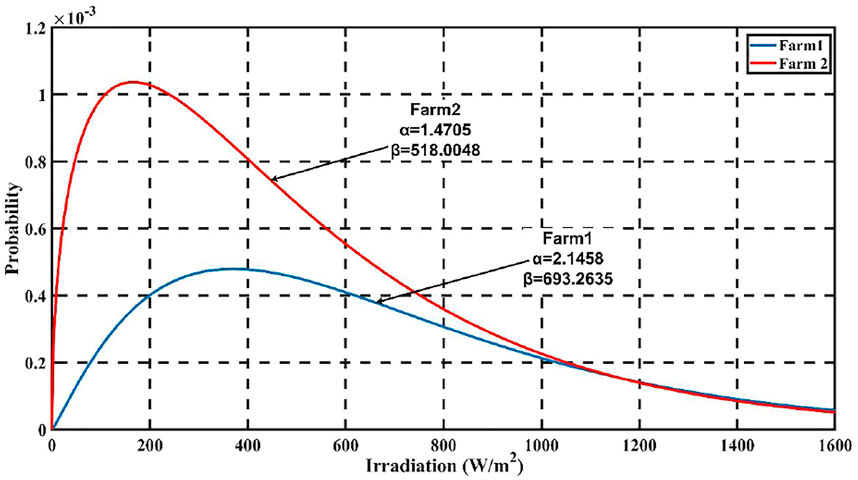
FIGURE 1. PDF of solar irradiation for two farms.
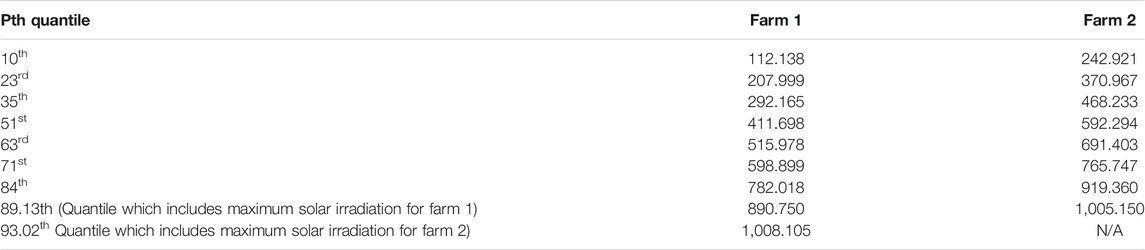
TABLE 2. Quantile of Weibull for different farms and maximum irradiance value (W/m2) present in them.
The Weibull parameters of different farms have been tabulated in Table 4. It can be observed from Table 2 that the quantile which includes the maximum solar irradiation value for farm 1 is 93.02%, and the quantile which includes the maximum solar irradiation value for farm 2 is 89.13%. Hence, it can be inferred that the solar data considered spans about 90% of the distribution, thus making Weibull distribution suitable for solar irradiation. The Weibull parameter fluctuates with change in location, even within the same region, making it challenging to determine an appropriate model to represent solar irradiation. A generalized model for solar irradiance would be useful for analyzing solar data at various locations in practical applications. The approach is useful in places where there is a shortage of historical data. The purpose of the framework is to accurately determine the output power of solar DGs installed in various geographic regions. The PDF plot of two solar farms is shown in Figure 1 in terms of the two-parameter Weibull distribution. This section determines the probability distribution of solar irradiance in terms of variance, which is obtained from the expected values of the PDF plot. The combined PDF plot for farm 1 and farm 2 is shown in Figure 2, which is obtained by taking the average of the probabilities of the two wind farms. The standard deviation
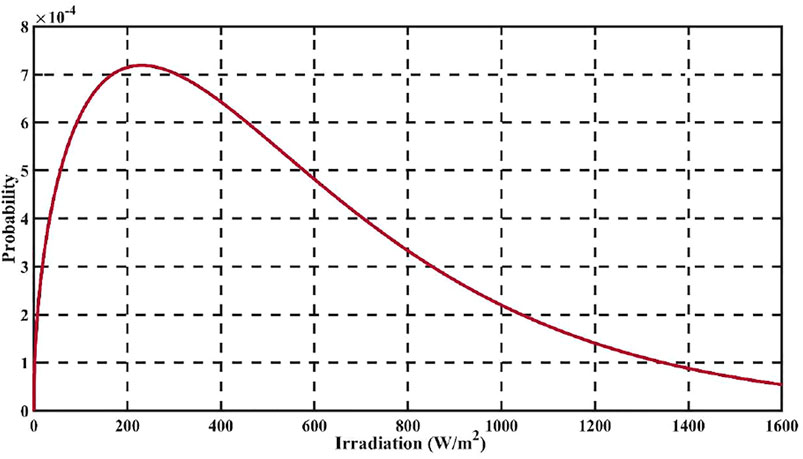
FIGURE 2. Combined solar irradiation PDF for two farms.
Based on the standard deviation
The generalized solar irradiation model can be used to obtain the probability of a particular site if the mean
Generalized Solar Generation Model
The conventional generating unit is represented by a two-state model, with the states representing zero power generation or “down state” and rated capacity generation or “up state”. However, due to solar power intermittency caused by variation of solar irradiation due to movement of the sun, it is pragmatic to represent the solar power with a multistate model. The multistate modeling helps to incorporate the random variation of solar energy generation correlating with random irradiance. Furthermore, the generation reliability analysis requires the computation of power generated at a particular site with a solar farm so as to check whether it meets the load demand. The amount of power generated from a solar farm location varies with the amount of solar irradiation. The solar power curve, which is a correlation between solar irradiation and generated power as shown in Figure 3, can be used to calculate the power generated at a location. The power varies non-linearly when the solar irradiation is less than a predefined set radiation point
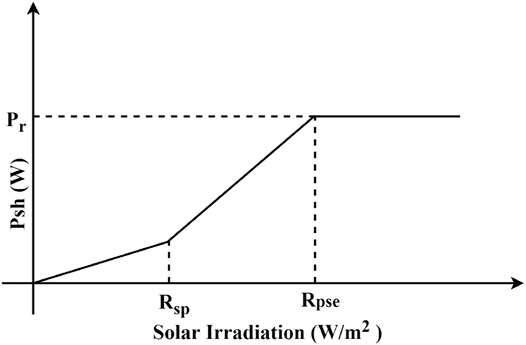
FIGURE 3. Correlation of output power with solar irradiation.
Figure 4 depicts the process of constructing a standard solar power model. The model requires solar data from a place with similar mean and standard deviation solar irradiation statistics. To develop a site-specific solar irradiation model, the annual mean and standard deviation of solar irradiation for that location are needed. Finally, solar power generated at a specific site for various irradiation values is calculated using solar power curve data.
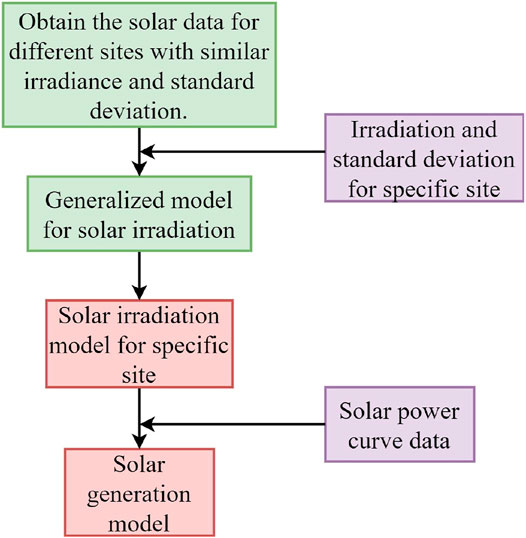
FIGURE 4. Flowchart for development of generalized solar irradiation model.
The hourly solar power generated
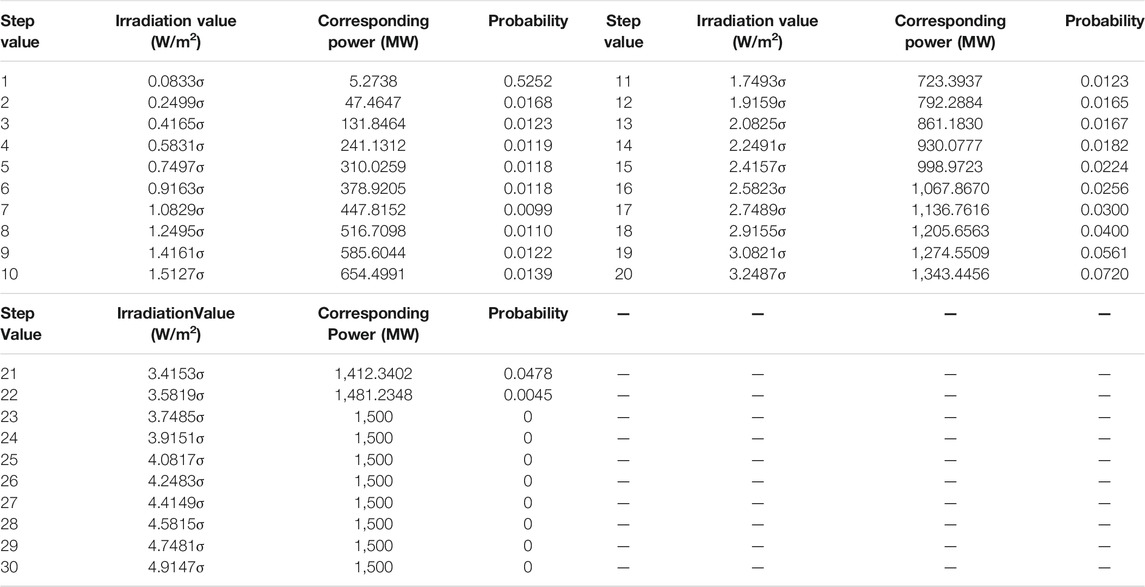
TABLE 3. Combined probability of solar irradiance and corresponding power for a 30-step model considering farm 1 and farm 2, having combined rated power 1500 MW and
The power generated is zero for the duration for which solar irradiation is not present, which has not been taken into account for the power calculation state. The probability
Smart Grid Discrete Production Simulation Considering Stochastic Generation for Reliability Analysis
Generation planning is an essential aspect of determining the reliability of power delivered to the consumers. The incorporation of solar PV-generating units and other renewable energy resources in the generation has mandated the need for efficient generation planning tools to account for generating unit stochasticity. The algorithms of the existing planning tools are incredibly efficient, and updating them to integrate solar DG units enables the planning process smart for smart grids. The present work considers the discretized version of load and solar generation intermittency to formulate smart grid discrete production simulation (SGDPS) with stochastic generation. The DSLM is the kernel of SGDPS which immaculately integrates the stochastic load and the generation model. DSLM is the modification of the initial DSLM (load represented in terms of time duration of its demand), which is shifted and modified to account for uncertainty in a generation in terms of the load. If a certain capacity of generation is removed from the existing system, changes are affected in the load as generation follows the load. Hence, this phenomenon is expressed by an equivalent rise in load causing the shifting of the initial DSLM to obtain a new DSLM. A typical DSLM is shown in Figure 5A. Point
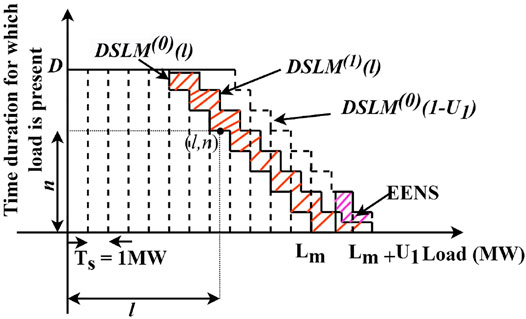
FIGURE 5. DSLM incorporating random outage of a generator.
Incorporation of Random Outage of Conventional Unit
The outage of the conventional unit is represented by a two-state model. If the outage of each generating unit
Inclusion of Solar Power Uncertainty in the Probabilistic Simulation Model
The uncertainty of solar power generation is represented by multiple power states, necessitating the use of the multistate algorithm. If the uncertainty of the solar power is represented by
If the outage of
Equation 10 reduces to Eq. 9 if
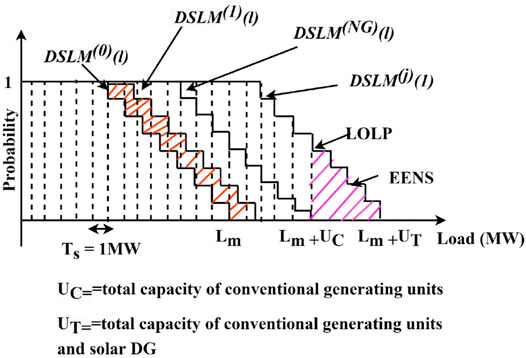
FIGURE 6. DSLM considering outage of all the conventional generators and solar DG.
Reliability Evaluation Using Frequency Domain Approach
Convolution of generating units with initial DSLM in the time domain necessitates several iterations, and the number of data points after convolution rises. This increases the memory requirements of the processor, and massive computations make the processor slow. If the time domain signals are converted to the frequency domain, the large number of addition and multiplications reduces to point by point data multiplication (Proakis and Manolakis 2021). The data are converted from the time domain to the frequency domain using a fast Fourier transform (FFT) algorithm. FFT requires the initial DSLM data and the data related to the uncertainty of the generating units to be sampled, and the number of sampling points must satisfy
Evaluation of Reliability Indices
The DSLM obtained after all the units have been convolved with the initial DSLM shifts the initial DSLM based on the maximum generating capacity of the system. If the system has
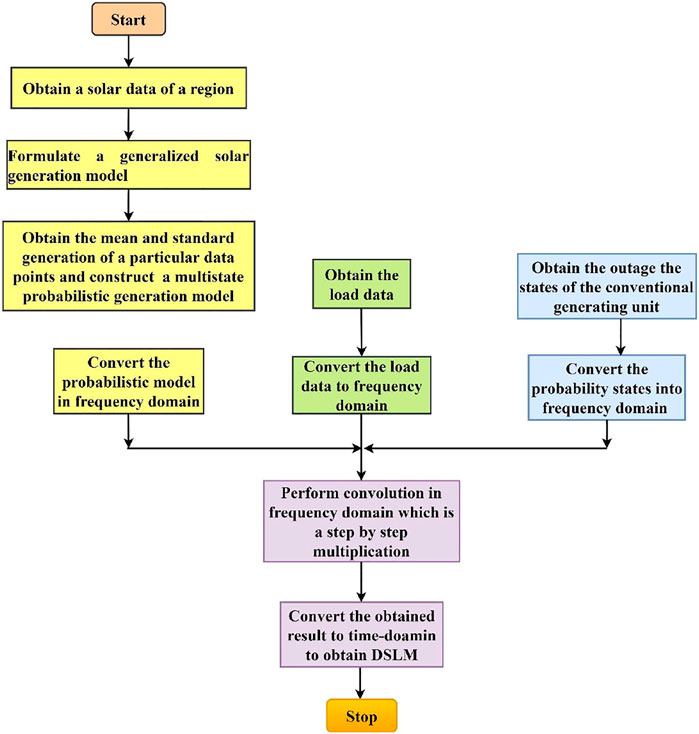
FIGURE 7. Reliability evaluation process considering outage of generating units and intermittency of solar generation.
Impact Assessment of Solar Generation on Carbon Neutrality
Since the beginning of the industrial revolution, carbon dioxide emissions, mostly from the combustion of fossil fuels, have risen substantially. CO2 emissions vary depending on the type of fossil fuel utilized to generate power. Burning coal produces more CO2 than burning natural gas or oil to produce the same amount of power. Achieving net-zero emissions (carbon neutrality) by 2050 is a colossal task, especially in the face of rising economic and population expansion. It calls for unwavering support from all the countries to massively generate power from natural sources of energy such as wind and solar energy. The enormity of the changes required to achieve worldwide net-zero emissions by 2050 is beyond the capabilities of the government energy or environment ministries, as well as individual countries. It will entail an unparalleled level of global collaboration (IEA 2021). The countries, in an effort to reduce carbon emissions, are actively encouraging and providing incentives for the installation of wind and solar power plants at the places of potential to deliver. Among clean energies, renewables such as solar energy, wind power, and ocean energy are some of the most important and efficient means to achieve carbon neutrality (Wang et al., 2021). These renewable technologies provide around half of the emission savings to 2030 in the net-zero emissions.
The impact of solar generation on carbon neutrality is assessed using the following equation:
where Op is the total electricity generation output of the grid in MWh. It is equal to the product of installed capacity in MW, capacity factor, and 8,760 h/a. EFi is the emission factor for specific technology and fuel type expressed in t CO2e/MWh,
Case Studies and Discussions
The impact of solar power generation on the reliability of the conventional system is tested and validated on the IEEE-RTS system (Grigg et al., 1999), which has been widely used for testing and validating various reliability algorithms. The system comprises 32 generating units with a total generation of 3405 MW generation and a connected load of 2805 MW. The original system has been modified to accommodate the solar DG in the system. A 155 MW coal unit has been replaced to include a 1500 MW solar farm in the system to represent a capacity factor (equivalent generating capacity/actual capacity of the plant) of 0.1033; the generating capacity of all the connected generators is listed in Table 4. The modified IEEE-RTS used in this study also includes the different generators along with their capacities. The generating units used are mainly nuclear, coal/steam, oil/steam, and hydro, along with their generation capacities.
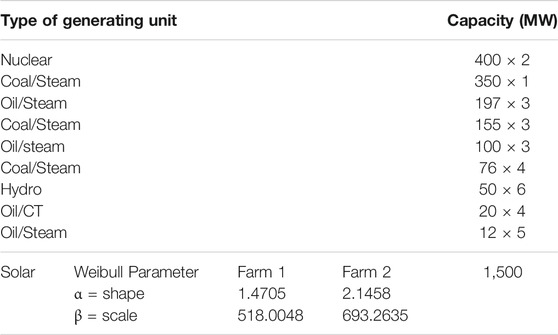
TABLE 4. Type of generator with their capacities connected in modified IEEE-RTS.
Solar energy has a significant role in reducing the global carbon footprint. Table 5 enlists the carbon dioxide emissions from the major carbon emitting generating sources and solar PV system. The carbon emissions from each of these sources are calculated for equal generation capacities, and during calculations, it is assumed that the thermal and oil power plants operate at their rated capacity with a capacity factor of “1”. The thermal and oil units operate for 24 h, whereas the solar PV system generates power depending on the availability of the sun, which is taken as 10 h in the present study. Table 5 also enlists the emission factor of various fuel types (Environment 2022). It can be observed that the emission factor of the thermal unit is maximum due to the fact that it utilizes coal as a fuel, and because the emission factor of the oil unit is also considerable. The carbon emission factor of the solar PV system is very less when compared to coal and oil units, and hence it can serve as a major alternative source of generation in order to reduce the carbon emissions. Considering the operating scenario in the present work, the carbon emissions in ton CO2 equivalent is tabulated in Table 5, calculated from Eq. 16. It can be observed that the emissions from the thermal unit is 117.724 × 10⁶ t CO2 eq., which is very high; the CO2 emission from the oil unit is reduced to 93.67, but is still significant. Hence, the major CO2-emitting source, which is the thermal unit, needs to be replaced with the solar unit in order to achieve carbon neutrality. The present work does not consider the replacement of the nuclear unit as it is a large unit serving base load. The replacement of a thermal unit with a solar unit reduces the CO2 emissions to 22.630 t CO2 eq., thus playing a major role in achieving carbon neutrality.
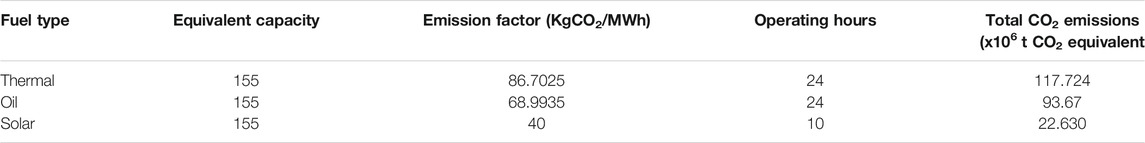
TABLE 5. Total CO2 emissions for different units.
The two farms mentioned in Section 2 represent distributed generation, and the solar data have been obtained from National Solar Radiation Database (2021), through which data can be obtained for any geographic site. The solar irradiance data collected for 2 years from the particular site with solar farms are used in this study for the distributed stochastic load model (DSLM). The solar irradiance data have been represented in hours and days as rows and columns, respectively, with a local standard time from 7:00 a.m. to 5:00 p.m. for each day. Table 1 shows the data represented in matrix form with rows as the number of hours from 1 to 10 and the number of days from 1 to 730. Table 2 shows the rth quantile of the Weibull distribution for farm 1 and farm 2. From this, it can be inferred that for the 63rd quantile, the scale parameter is equal to the Weibull distribution factor for both farms 1 and 2. The maximum solar irradiation for farm 1 occurs at 89.13th quantile, its Weibull distribution factor corresponding to 890.750, and for farm 2, it occurs at 93.02th quantile and its value corresponds to 1,005.150.
The present work takes into account a 30-step model to consider a step size of around 50 MW, so that the power states are obtained with sufficient accuracy. The combined probability of farm 1 and farm 2 for various irradiation values has been presented in Table 3; the power corresponding to various irradiation states has also been mentioned. Both farm 1 and farm 2 have a combined rated power of 1500 MW and a standard deviation of 229.6488. From Table 3, it can be inferred that with an increase in solar irradiation, the probability decreases. The corresponding power increases gradually, and for the step value of 20, it settles at 1,343.4456 MW. With further increase in the step value beyond the 23rd step with a power magnitude of 1500 MW, the probability remains constant at zero. The load data for a year considering the time in weeks have been taken from Grigg et al. (1999), and the initial DSLM plot representing the peak load for different weeks in a year is shown in Figure 8.
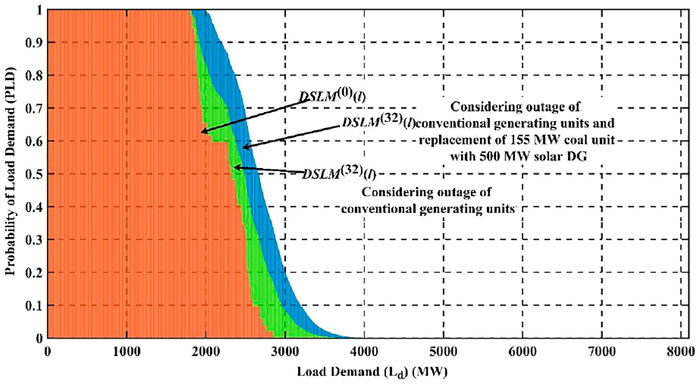
FIGURE 8. DSLM for IEEE-RTS and modified RTS.
The DSLM plot for IEEE-RTS is shown in Figure 8, considering the convolution load and outage of all the generating units. The maximum value of load after convolving all the generating units is 6255 MW, and the LOLP and EENS obtained from DSLM are 0.009556 and 11.4240 (GWh/yr), respectively. It can be observed from Figure 9 that after considering the outage of generating units, the load curve has shifted, which signifies an increase in energy at the load side with an outage of generating units. The DSLM with the removal of the 155 MW generating unit and addition of 500 MW solar DG is shown in Figure 9. It can be observed that the modification of DSLM further shifts to the right, and the maximum load of the DSLM is 6600 MW. Inclusion of 500 MW generating unit results in a penetration of 13% of the solar generation, which results in a LOLP of 0.2875 and an EENS of 41.0293, as listed in Table 6. The results show that the solar DG penetration of 13% results in the decrease of reliability of the system. With a penetration of 31.5%, the LOLP improves to 0.1053 and the EENS improves to 14.7390 (GWh/yr), which is considerable. The inclusion of 1500 MW solar DG results in a capacity factor of 0.10. The result shows both quantitative and qualitative contributions of the solar photovoltaic systems. From the aforementioned results, it is evident that with an increase in solar DG penetration, the LOLP and the EENS improve, resulting in an increase in the reliability of the system. LOLP and EENS are important factors for reliability assessment. This further proves that by replacing the conventional units with the solar DGs, carbon neutrality can be achieved, thus lowering the amount of CO2 emissions.
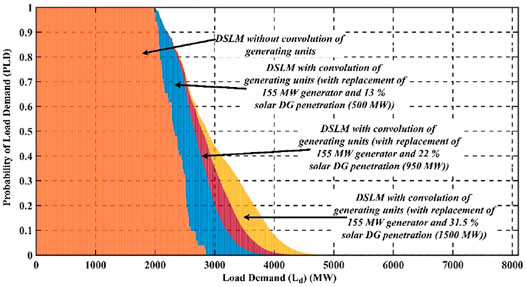
FIGURE 9. DSLM after convolving all the generating units considering different levels of DG penetration.

TABLE 6. Reliability indices for the proposed system.
Conclusion
Solar energy has a massive potential around the world for minimizing carbon emissions. In an urge to decrease the carbon footprint on the environment, the usage of solar DG is increasing. In order to assess the impact of solar power generation in the current energy scenario, it is imperative to model the stochastic nature of solar irradiation. The proposed work quantifies the stochastic nature of solar irradiation. A generalized model to represent solar irradiation has been developed based on Weibull distribution for reliability purposes. Based on the model, a discrete production simulation model has been developed to represent solar DG. The algorithm has been tested on modified IEEE-RTS and the results prove that with a penetration of 31.57% of solar generation, the reliability of the system is close to the base RTS system in terms of EENS. The carbon neutrality based on penetration of renewables has been quantified and thus, replacing the conventional thermal unit with renewable energy from solar is highly indispensable and crucial for lowering CO2 emissions and decarbonizing energy systems to achieve carbon neutrality.
Data Availability Statement
The original contributions presented in the study are included in the article/Supplementary Material, further inquiries can be directed to the corresponding authors.
Author Contributions
All authors listed have made a substantial, direct, and intellectual contribution to the work and approved it for publication.
Conflict of Interest
The authors declare that the research was conducted in the absence of any commercial or financial relationships that could be construed as a potential conflict of interest.
Publisher’s Note
All claims expressed in this article are solely those of the authors and do not necessarily represent those of their affiliated organizations, or those of the publisher, the editors, and the reviewers. Any product that may be evaluated in this article, or claim that may be made by its manufacturer, is not guaranteed or endorsed by the publisher.
References
Afzaal, M. U., Sajjad, I. A., Awan, A. B., Paracha, K. N., Khan, M. F. N., Bhatti, A. R., et al. (2020). Probabilistic Generation Model of Solar Irradiance for Grid Connected Photovoltaic Systems Using Weibull Distribution. Sustainability 12 (6), 2241. doi:10.3390/su12062241
Ak, R., Li, Y.-F., Vitelli, V., and Zio, E. (2018). Adequacy Assessment of a Wind-Integrated System Using Neural Network-Based Interval Predictions of Wind Power Generation and Load. Int. J. Electr. Power Energ. Syst. 95 (February), 213–226. doi:10.1016/j.ijepes.2017.08.012
Almaktar, M., Elbreki, A. M., and Shaaban, M. (2021). Revitalizing Operational Reliability of the Electrical Energy System in Libya: Feasibility Analysis of Solar Generation in Local Communities. J. Clean. Prod. 279 (January), 123647. doi:10.1016/j.jclepro.2020.123647
Alrashidi, M., Alrashidi, M., and Rahman, S. (2021). Global Solar Radiation Prediction: Application of Novel Hybrid Data-Driven Model. Appl. Soft Comput. 112 (November), 107768. doi:10.1016/j.asoc.2021.107768
Environment (2022). U.S. Energy Information Administration (EIA) - U.S. Available at: https://www.eia.gov/environment/emissions/co2_vol_mass.php (Accessed February 3, 2022).
Gautam, N. K., and Kaushika, N. D. (2002). Reliability Evaluation of Solar Photovoltaic Arrays. Solar Energy 72 (2), 129–141. doi:10.1016/S0038-092X(01)00085-8
Gopakumar, P, M., Jaya bharata, R., and Dusmanta kumar, M. (2014). Letter to the Editor: Stability Concerns in Smart Grid with Emerging Renewable Energy Technologies. Electric Power Components Syst. 42 (3–4), 418–425. doi:10.1080/15325008.2013.866182
Grigg, C., Wong, P., Albrecht, P., Allan, R., Bhavaraju, M., Billinton, R., et al. (1999). The IEEE Reliability Test System-1996. A Report Prepared by the Reliability Test System Task Force of the Application of Probability Methods Subcommittee. IEEE Trans. Power Syst. 14 (3), 1010–1020. doi:10.1109/59.780914
Hariri, A.-M., Hejazi, M. A., and Hashemi-Dezaki, H. (2019). Reliability Optimization of Smart Grid Based on Optimal Allocation of Protective Devices, Distributed Energy Resources, and Electric Vehicle/plug-In Hybrid Electric Vehicle Charging Stations. J. Power Sourc. 436 (October), 226824. doi:10.1016/j.jpowsour.2019.226824
IEA. (2021). Net Zero by 2050: A Roadmap for the Global Energy Sector. Int. Energ. Agency 224. Availabe at: www.iea.org/t&c/.
Jiang, W., Xu, Z., Yu, B., Sun, K., Ren, K., Deng, Y., et al. (2021). Control of the Distributed Hybrid Energy Storage System Considering the Equivalent SOC. Front. Energ. Res., 9. doi:10.3389/fenrg.2021.722606
Kim, S. Y., Sapotta, B., Jang, G., Kang, Y.-H., Kim, H.-G., and Kim, H-G. (2020). Prefeasibility Study of Photovoltaic Power Potential Based on a Skew-Normal Distribution. Energies 13 (3), 676. doi:10.3390/en13030676
Kumar, D., Mohanta, D. K., and Reddy, M. J. B. (2015). Intelligent Optimization of Renewable Resource Mixes Incorporating the Effect of Fuel Risk, Fuel Cost and CO2 Emission. Front. Energ. 9 (1), 91–105. doi:10.1007/s11708-015-0345-y
Lakshmi, S. R., Tripathy, S. C., Rao, K. S. P., and Balasubramianian, R. (1995). Evaluation of Generation System Reliability Indices by Fast Transform Techniques. Int. J. Electr. Power Energ. Syst. 17 (4), 281–287. doi:10.1016/0142-0615(95)00040-W
Li, C., Yang, Y., Zhang, K., Zhu, C., and Wei, H. (2021). A Fast MPPT-Based Anomaly Detection and Accurate Fault Diagnosis Technique for PV Arrays. Energ. Convers. Manag. 234 (April), 113950. doi:10.1016/j.enconman.2021.113950
Life Cycle Greenhouse Gas Emissions from Solar Photovoltaics (2021). NREL. Available at: https://www.nrel.gov/docs/fy13osti/56487.pdf.
Manohar, M., Koley, E., Ghosh, S., Mohanta, D. K., and Bansal, R. C. (2020). Spatio-temporal Information Based protection Scheme for PV Integrated Microgrid under Solar Irradiance Intermittency Using Deep Convolutional Neural Network. Int. J. Electr. Power Energ. Syst. 116 (March), 105576. doi:10.1016/j.ijepes.2019.105576
National Solar Radiation Database (2021). Home - NSRDB. Available at: https://nsrdb.nrel.gov/.
Okundamiya, M. S. (2021). Size Optimization of a Hybrid Photovoltaic/fuel Cell Grid Connected Power System Including Hydrogen Storage. Int. J. Hydrogen Energ. 46 (59), 30539–30546. doi:10.1016/j.ijhydene.2020.11.185
Ostovar, S., Esmaeili-Nezhad, A., Moeini-Aghtaie, M., and Fotuhi-Firuzabad, M. (2021). Reliability Assessment of Distribution System with the Integration of Photovoltaic and Energy Storage Systems. Sustainable Energ. Grids Networks 28 (December), 100554. doi:10.1016/j.segan.2021.100554
Pandit, D., Nguyen, N., Elsaiah, S., and Mitra, J. (2021). “Reliability Evaluation of Solar PV System Incorporating Insolation-dependent Failure Rates” in 2021 International Conference on Smart Energy Systems and Technologies (IEEE), 1–6. doi:10.1109/SEST50973.2021.9543315
Phan, L. D., and McCool, J. I. (2009). Exact Confidence Intervals for Weibull Parameters and Percentiles. Proc. Inst. Mech. Eng. O: J. Risk Reliability 223 (4), 387–394. doi:10.1243/1748006XJRR247
Pradeep Kumar, V. V. S., and Fernandes, B. G. (2017). A Fault-Tolerant Single-phase Grid-Connected Inverter Topology with Enhanced Reliability for Solar PV Applications. IEEE J. Emerg. Sel. Top. Power Electron. 5 (3), 1254–1262. doi:10.1109/jestpe.2017.2687126
Proakis, J. G., and Manolakis, D. G. (2021). Digital SIgnal Processing. 5th ed. New Jersey: Pearson.
Ram, M., Singh Bhandari, A., and Kumar, A. (2021). “Reliability Evaluation and Cost Optimization of Solar Road Studs.”. Int. J. Reliability, Qual. Saf. Eng. doi:10.1142/S0218539321500418
Sreenivasulu, J., Dukkipati, S., Marthanda, A. V. G. A., and Pandian, A. (2021). Forecasting of Photovoltaic Power Using Probabilistic Approach. Mater. Today Proc. 45, 6800–6803. doi:10.1016/j.matpr.2020.12.910
Talukdar, B., Kumar, B., Chandra Deka, B., and Goswami, A. K. (2021). An Approach to Reliability Modeling and Availability Analysis of a Solar Electric Vehicle with Standby Plug-In Facility. Int. Trans. Electr. Energ. Syst. 31 (12). doi:10.1002/2050-7038.13147
Tapia Carpio, L. G. (2021). Mitigating the Risk of Photovoltaic Power Generation: A Complementarity Model of Solar Irradiation in Diverse Regions Applied to Brazil. Utilities Policy 71 (August), 101245. doi:10.1016/j.jup.2021.101245
Tripathi, P. R., Thakura, P., Laxmi, V., and Keshri, R. K. (2021). Stand-alone PV Water Pumping System Based on High-Gain Resonant Inverter Fed Induction Motor Serving Two-Head for Permanent Water Supply. Int. J. Circuit Theor. Appl. 49 (8), 2494–2514. doi:10.1002/cta.2983
Vardi, J., Zahavi, J., and Avi-Itzhak, B. The Combined Load Duration Curve and its Derivation. IEEE Trans. Power Apparatus Syst. 96 (3), 978–983. doi:10.1109/t-pas.1977.32411
Vriesde, S. B., Roel, C. G. M. L., and Hensen, J. L. M. (2021). Multi-State Vertical-Blinds Solar Shading – Performance Assessment and Recommended Development Directions. J. Building Eng. 40 (August), 102743. doi:10.1016/j.jobe.2021.102743
Wang, F., Harindintwali, J. D., Yuan, Z., Wang, M., Wang, F., Li, S., et al. (2021). Technologies and Perspectives for Achieving Carbon Neutrality. The Innovation 2 (4), 100180. doi:10.1016/j.xinn.2021.100180
Wyrwa, A., Suwała, W., Pluta, M., Raczyński, M., Zyśk, J., and Tokarski, S. (2022). A New Approach for Coupling the Short- and Long-Term Planning Models to Design a Pathway to Carbon Neutrality in a Coal-Based Power System. Energy 239 (January), 122438. doi:10.1016/j.energy.2021.122438
Yan, K., Du, Y., and Ren, Zixiao. (2019). MPPT Perturbation Optimization of Photovoltaic Power Systems Based on Solar Irradiance Data Classification. IEEE Trans. Sust. Energ. 10 (2), 514–521. doi:10.1109/TSTE.2018.2834415
Yin, J., Molini, A., and Porporato, A. (2020). Impacts of Solar Intermittency on Future Photovoltaic Reliability. Nat. Commun. 11 (1), 4781. doi:10.1038/s41467-020-18602-6
Keywords: solar irradiation uncertainty, Weibull distribution, discrete stochastic load model, reliability, carbon neutrality
Citation: Khalkho AM, Rapada B, Majumder G, Cherukuri M and Mohanta DK (2022) Impact Assessment of Solar Power Generation Uncertainty on Smart Grid Reliability and Carbon Neutrality. Front. Energy Res. 10:851449. doi: 10.3389/fenrg.2022.851449
Received: 09 January 2022; Accepted: 14 February 2022;
Published: 14 March 2022.
Edited by:
Shabana Urooj, Princess Nourah bint Abdulrahman University, Saudi ArabiaReviewed by:
Krishan Kumar, Dehn India, IndiaLeo Raju, SSN College of Engineering, India
Ahmed Al-Salaymeh, The University of Jordan, Jordan
Copyright © 2022 Khalkho, Rapada, Majumder, Cherukuri and Mohanta. This is an open-access article distributed under the terms of the Creative Commons Attribution License (CC BY). The use, distribution or reproduction in other forums is permitted, provided the original author(s) and the copyright owner(s) are credited and that the original publication in this journal is cited, in accordance with accepted academic practice. No use, distribution or reproduction is permitted which does not comply with these terms.
*Correspondence: Dusmanta Kumar Mohanta, ZGttb2hhbnRhQGJpdG1lc3JhLmFjLmlu; Murthy Cherukuri, Y2htdXJ0aHkyMDA3QGdtYWlsLmNvbQ==
†These authors share first authorship
‡These authors share last authorship
$These authors share senior authorship