 Meagan F. Crowley1
 Hariswaran Sitaraman2
 Jordan Klinger3
 Francois Usseglio-Viretta4
 Nicholas E. Thornburg5
 Nicholas Brunhart-Lupo2
 M. Brennan Pecha1
 James H. Dooley6
 Yidong Xia3
 Peter N. Ciesielski1*
- 1National Renewable Energy Laboratory, Renewable Resources and Enabling Sciences Center, Golden, CO, United States
- 2National Renewable Energy Laboratory, Computational Science Center, Golden, CO, United States
- 3Idaho National Laboratory, Energy Environment Science and Technology Directorate, Idaho Falls, ID, United States
- 4National Renewable Energy Laboratory, Center for Energy Conversion and Storage Systems, Golden, CO, United States
- 5National Renewable Energy Laboratory, Center for Integrated Mobility Sciences, Golden, CO, United States
- 6Forest Concepts, LLC, Auburn, WA, United States
Lignocellulosic biomass has a complex, species-specific microstructure that governs heat and mass transport during conversion processes. A quantitative understanding of the evolution of pore size and structure is critical to optimize conversion processes for biofuel and bio-based chemical production. Further, improving our understanding of the microstructure of biochar coproduct will accelerate development of its myriad applications. This work quantitatively compares the microstructural features and the anisotropic permeabilities of two woody feedstocks, red oak and Douglas fir, using X-ray computed tomography (XCT) before and after the feedstocks are subjected to pyrolysis. Quantitative analysis of the three-dimensional (3D) reconstructions allows for direct calculations of void fractions, pore size distributions and tortuosity factors. Next, 3D images are imported into an immersed boundary based finite volume solver to simulate gas flow through the porous structure and to directly calculate the principal permeabilities along longitudinal, radial, and tangential directions. The permeabilities of native biomass are seen to differ by three to four orders of magnitude in the different principal directions, but we find that this anisotropy is substantially reduced in the biochar formed during pyrolysis. The quantitative transport properties reported here enhance the ability of pyrolysis simulations to account for feedstock-specific effects and thereby provide a useful touchstone for the biorefining community.
Introduction
Lignocellulosic biomass comprises a species-specific, highly porous, and anisotropic microstructure that originates from its function to transport and store water and nutrients throughout the plant during its lifetime. After harvesting, this microstructure, in tandem with the properties of the cell walls from which it is composed, govern the physical properties of lignocellulosic tissue. These features also influence important phenomena such as intraparticle heat and mass transfer that underlie conversion performance in biofuel and biochemical production processes (Ciesielski et al., 2020). Pyrolysis is a thermochemical method for converting biomass to molecular and oligomeric intermediates (Kan et al., 2016) and is often limited by internal transport of heat and fluid egress within particle pores (Pecha et al., 2019). Another product of pyrolysis is biochar, a carbonaceous material whose porosity is derived partially from the microstructure of the original biomass and partially from the pyrolysis process itself. Biochar has long been used as a soil amendment, (Lehmann, 2007; Verheijen et al., 2010), but has also found utility in advanced applications including catalysis, (Lee et al., 2017), adsorption, (Inyang et al., 2016), and electrochemical devices (Jiang et al., 2013). All of these aforementioned applications rely upon the transport of molecules, ions and/or thermal energy throughout hierarchical porous structures, necessitating a rigorous understanding of the microstructural transport properties of biochar and its parent feedstocks. Indeed, Di Blasi (1997) showed that differences in transport properties including permeability and porosity significantly impact pyrolysis product distributions.
Fundamental physical properties including permeability, tortuosity, and void fraction constrain the diffusive and advective transport that govern applications employing biomass and biochar as substrates. In the context of pyrolysis, intraparticle transport can affect the yield and distribution of products, which highlights the importance of accurately handling microstructural effects to achieve predictive models (Ciesielski et al., 2015; Ciesielski et al., 2020). Direct analysis of the microstructure of biomass feedstocks enables quantification of structural features including permeability, tortuosity, and void fraction to parameterize simulations for transport in porous media (Ciesielski et al., 2021). High-fidelity models of biomass conversion and biochar utilization require accurate transport models to enable scale-up and to mitigate technoeconomic risk of industrial deployment. Combined modeling and experimental works have previously elucidated the importance of directional permeability of biomass during pyrolysis (Di Blasi, 1998; Pecha et al., 2021). Other factors such as density and orientation in a gas stream also impact pyrolysis product quality and yield and have been investigated in studies such as in Kumari et al. (2022) and Pecha et al. (2017), but were not examined in this study as these properties can be measured without detailed information of the 3D microstructure of the material.
Accurate quantitative analysis of the microstructure of biomass by traditional experimental methods is difficult to perform. As discussed by Sun et al. (2021), the fidelity of commonly used techniques for experimentally measuring porosity or specific surface area, such as the density method or physisorption, are negatively impacted by pore structure breakage and undesired off-gassing that occur as functions of the temperature and pressure of the testing environment. Mercury intrusion porosimetry (MIP) is also commonly used, (Plötze and Niemz, 2011), but mercury handling poses significant safety concerns in the laboratory, and it can be difficult to interpret and reproduce results. Furthermore, particle size distributions may lead to misleading readouts of multiple pore sizes that are not necessarily statistically significant. For example, MIP tends to overrepresent the bottlenecks, thus providing an estimation of the minimum radius and not of the desired average radius (Holzer et al., 2013). Both the density method and mercury porosimetry provide limited information regarding geometric features of the microstructure, such as pore connectivity and tortuosity. Biomass tortuosity measurements are scant in the literature, and the techniques employed are difficult and specialized (Törnqvist et al., 2001). In the absence of such information and the inability to assume simplified particle geometries, some of us have previously assumed models of tortuosity as a function of void fraction (Sitaraman et al., 2015; Thornburg et al., 2020), although these assumptions extend beyond the models’ intended derivations (Bruggeman, 1935; Millington and Quirk, 1961; Thornburg et al., 2020). In all cases, the sparse information available regarding biomass tortuosity and void fraction applies only to the material’s fresh, unconverted state.
Therefore, there is an emergent need to understand partially and fully converted biomass structures to advance physics-based modeling of such conversion processes. X-ray Computed Tomography (XCT)-based techniques and the application of numerical analyses described here provide accessible, direct answers to these knowledge gaps. Refined measurements of tortuosity and void fraction further enable accurate determination of effective diffusivities, which in turn allow for more robust assessments of reaction vs. diffusion limitations in gas–solid (Pecha et al., 2021) and liquid–solid systems (Luterbacher et al., 2013; Thornburg et al., 2020). Mechanical approaches have also been used to measure some microstructural properties. Envelope density analyzers can be used to measure bulk density and thereby estimate particle porosity, also known as the void fraction, defined as the ratio of the volume of void space in a material to its total volume, though this method does not measure pore structure. Directional gas permeabilities can be measured with a Hassler cell and has been performed for various wood samples (Comstock, 1970; Choong et al., 1974; Filomena et al., 2014). However, these experimental approaches have their limitations, and permeability measurement is a time-intensive process that requires specially cut samples. These techniques are likely not applicable to biochar, which is brittle and cannot easily be shaped without damage.
Imaging methods offer a promising approach for characterizing the microstructure of biomass. Confocal scanning laser microscopy (CSLM), scanning electron microscopy (SEM), and transmission electron microscopy (TEM) are commonly employed to visualize biomass microstructure, yet each have their limitations (Ciesielski et al., 2014). Sample preparation via microtomy for CSLM and TEM can be challenging and may result in artifacts that significantly affect the quality of the images (Boigné et al., 2022). While these methods can be used to produce 3D information about microstructure, by using z-stacking in the case of confocal microscopy, stereo pairs for SEM, and tomography for TEM, the reconstructions often suffer from limited resolution (Shah et al., 2017) and/or missing regions (Bartesaghi et al., 2008) which reduce confidence in measurements of pore geometry. X-ray computed tomography (XCT) is a widely used imaging method to analyze solid samples that produces 3D volumetric images of the microstructure of materials. XCT can provide high spatial resolution while mitigating optical limitations such as beam steering or limited depth of field (Boigné et al., 2022). The 3D reconstructions provided by XCT permit detailed, non-destructive, and direct characterization of the pore microstructure of biomass without the need for any histochemical treatments or intensive sample preparation. Several recent studies have employed XCT to characterize the microstructure of biomass. Sun et al. (2021) calculated the porosity and pore size distribution of loblolly pine samples from XCT reconstructions in a novel study, but important features such as the permeability tensor, tortuosity, or void fraction were not calculated. Boigné et al. (2022) analyzed volume shrinkage within biomass during pyrolysis and oxidation using real-time, in situ XCT, but the effects of pyrolysis on transport properties were not quantitatively investigated. Zolghadr et al. (2019) used XCT imaging to characterize the microstructure of crystalline cellulose, switchgrass, and tall fescue microspheres, calculating void fraction and tortuosity but not directional permeabilities.
This study characterizes the microstructure of early wood hardwood (red oak, Quercus rubra) and softwood (Douglas fir, Pseudotsuga menziesii) samples, before and after pyrolysis, using XCT imaging and quantitative numerical analysis to determine the void fraction, pore size distribution, tortuosity factor, and directional permeability. MesoFlow, our in house computational fluid dynamics (CFD) solver, developed using the block structured Cartesian adaptive mesh refinement library AMReX, (Zhang et al., 2019), is used to simulate gas-phase mass transport through the samples by directly importing sub-volumes of the XCT reconstructions. These simulations subsequently provide the principal permeabilities for each sample. Segmented XCT sub-volumes are also imported into the Microstructure Analysis Toolbox (MATBOX), (Cooper et al., 2016; Usseglio-Viretta, 2022), an open-source MATLAB app developed at NREL (available at https://github.com/NREL/MATBOX_Microstructure_analysis_toolbox) to calculate void fraction, pore size distribution, and tortuosity factor by numerical analysis. To the authors’ knowledge, this is the first study to import 3D volumetric geometries of biomass before and after pyrolysis from XCT reconstructions into a CFD framework for permeability characterization. A diagram of the XCT workflow is shown in Figure 1, illustrating sample renderings from the raw tomographic images to 3D reconstruction, and final reduction to a sub-volume portion used for numerical analysis.
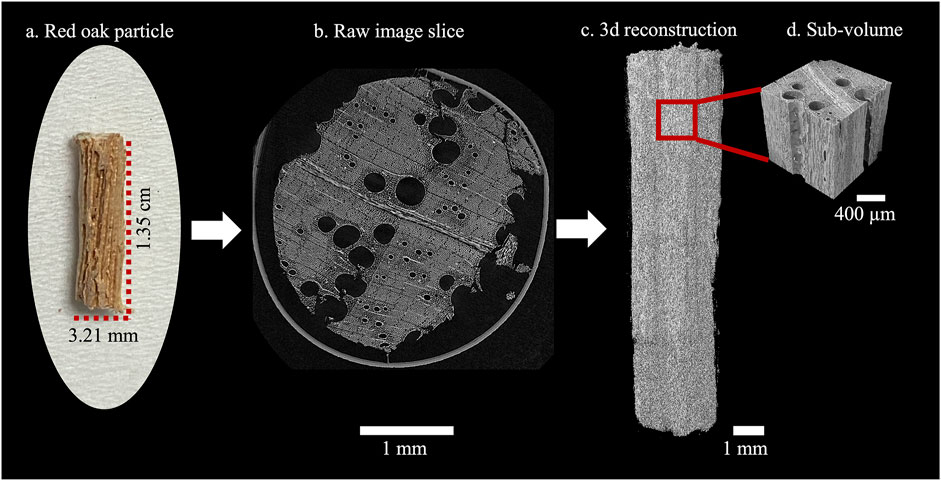
FIGURE 1. Diagram of XCT workflow. (A) Initial particle, native red oak photograph. (B) Raw image slice from XCT radiograph. (C) 3D Reconstruction of the full particle from the raw images. (D) Cropped sub-volume used for numerical analysis and calculation of material properties.
Experimental and Computational Methods
Samples and Experimental Set up
Four total samples were analyzed for this study: a native hardwood red oak particle measuring 13.5 × 3.2 × 3.2 mm, a pyrolyzed red oak particle measuring 11.7 × 3.0 × 3.0 mm, both provided by Iowa State University, a native softwood Douglas fir particle measuring 2.0 × 2.0 × 2.0 mm provided by Forest Concepts and Idaho National Lab and a pyrolyzed Douglas fir particle of dimensions 4.0 × 2.4 × 4.1 mm provided by Forest Concepts. The red oak and pyrolyzed Douglas fir particles were imaged at the Colorado School of Mines using a Zeiss Xradia 520 Versa sub-micron XCT Scanner, while the native Douglas fir particle was imaged using a General Electric (GE) Phoenix vǀtomeǀx nano X-ray CT at Idaho National Lab.
The red oak dowels were pyrolyzed at 500°C under He in a modified Frontier micropyrolyzer as described in (Pecha et al., 2021) with a char yield of 19% after 90 s. The two Douglas fir samples (25–35 mg) were pyrolyzed in a horizontal spoon reactor under He at 500°C as described by (Christensen et al., 2017) for 5 min with char yields averaging 25%. At least 20 particles were pyrolyzed for each Douglas fir sample and random char particles were chosen for XCT imaging.
For the red oak and pyrolyzed Douglas fir XCT scans, each sample was secured to a mount in the chamber of the scanner using transparent adhesive tape for the larger red oak particles and glue adhesive for the pyrolyzed Douglas fir sample. Tape was not used to secure the Douglas fir sample to the mount because of its smaller size, and the layers of tape negatively impacted the contrast of the images. The X-ray source was tuned to emit with a voltage of 40 kV, 3 W power, and 75 µA current. The X-ray source was positioned 37.1 mm away from the detector, with the sample 20 mm away from the source placed between the source and detector. A ×4 objective magnification was used resulting in a 2 µm resolution for each scan, which was determined by (Sun et al., 2021) to be the minimum resolution to capture sufficient pore structure information.4 The scanner rotated the sample on the mount from 0 to 360 with an angular step size of 0.22°. X-ray radiographs were captured at each angle with 15 s exposure. The total data acquisition time for each sample ranged from 8 to 32 h, with the larger red oak particles requiring longer acquisition times and the pyrolyzed Douglas fir particle requiring the shortest acquisition time.
The procedure of acquiring the 3D scan of the native Douglas fir sample using a General Electric (GE) Phoenix vǀtomeǀx nano X-ray CT system can be found in (Sun et al., 2021) and is briefly described as follows. First, a sample particle is fixed onto a holder in the system chamber and the holder is programmed to rotate from 0 to 360° with an angular step size of 0.1°. Then radiographs are collected at each angle. Using the phoenix datos|x CT data acquisition software, the projections are then reconstructed to a 3D volume. The raw grey-scale image slices are exported from the software. For the 3D scan in this work, four Douglas fir pine particles are selected from the bulk samples produced by a Forest Concepts Crumbler® rotary shear system. In the imaging stage, several resolution settings, from 0.5 × 0.5 µm2 to 4 × 4 μm2 were tested, and the 2.2 × 2.2 µm2 per voxel is the highest usable resolution to preserve the fine voids in the microstructure. The four 3D scanning processes resulted in four image stacks, each containing 1,419, 1,518, 3,838, and 3,997 images. To avoid the boundary effect in the porosity analysis, in each image stack a region of interest (ROI) with size of 1.1 × 1.1 × 1.1 mm3 was cropped from the center.
The raw XCT scans of each sample, excluding the native Douglas fir which was imaged at Idaho National Lab, were reconstructed using Zeiss’ proprietary software, XMReconstructor, and were subsequently exported as tiff image stacks using DragonFly Pro, (Object Research Systems Inc, 2021), a Graphical User Interface (GUI) application for analyzing and manipulating 3D XCT data. Each data set varies in size due to size variations of the particles. The native red oak data set contains 1,603 total images, where each image is a slice in the z axis with x- and y-dimensions of 1,604 by 6,740 voxels. Each image is 24 MB, resulting in a 34 GB size of the entire dataset. The pyrolyzed red oak data set contains 1,515 total images measuring 1,521 by 5,825 voxels. Each image is 17.8 MB, culminating in a 27 GB dataset. The pyrolyzed Douglas fir data set comprises 1,383 images measuring 1,251 by 977 voxels. The images are 17.8 MB each, for a cumulative size of 3.38 GB. The native Douglas fir data set has 1,520 z-slice images, each with a size of 1,571 by 1,383 voxels and 4.17 MB. The total size of the native Douglas fir dataset is 6.30 GB. All datasets were stored with 16-bit data precision.
Each of the full particle reconstructions were cropped into sub-volumes for direct import into MesoFlow and MATBOX using DragonFly Pro. The native and pyrolyzed red oak data were cropped to a cube measuring 6423 voxels, approximately 1.28 mm3. This reduced the size of each data set to 503 MB. The native Douglas fir was binned by a factor of 2 and cropped to a cube measuring 2503 voxels, approximately 1 mm3 reducing the size of the dataset to 30 MB. The pyrolyzed Douglas fir data was smaller and more irregular in size, therefore a rectangular prism measuring 434 × 322 × 424 voxels, approximately 0.87 × 0.64 × 0.85 mm3, was cropped from the data, reducing the size to 237.1 MB.
Gas Flow Simulations and Permeability Calculations
The cropped sub-volumes of each data set are directly imported into a CFD simulation using our in-house solver, Mesoflow, which is a compressible finite-volume solver that uses immersed boundary methods and structured Cartesian grids. Our solver is developed on block structured Cartesian adaptive mesh refinement library, AMReX, (Zhang et al., 2019), which has been recently employed for several applications pertaining to combustion, (Sitaraman et al., 2021b), multiphase (Sitaraman et al., 2021a; Musser et al., 2021) and astrophysical (Almgren et al., 2020) flows. Gas-phase transport simulations were run with flow in the longitudinal, radial, or tangential directions using the cropped XCT sub-volumes as the porous media. The National Renewable Energy Laboratory (NREL) High-Performance Computing (HPC) system was used to run all simulations. A total of 12 simulations were run, one with gas flow in each of the three directions for each sub-volume of red oak and Douglas fir before and after pyrolysis. In each simulation, a pressure drop of 1,000 Pa (inlet pressure = 1 E5 Pa, outlet pressure = 1.01E5 Pa) was applied to either end of the sub-volume in the direction of interest, with wall boundaries along the other two directions. This ensured gas flow only in the direction of interest, and that the three principal components of the permeability could be calculated in isolation. Air was used as the gas in all simulations, with a viscosity of 1e-5 Pa s and a net molecular weight of 0.0289 kg/mol. The native Douglas fir simulations were run with a 4-micron image resolution for each voxel, while the pyrolyzed Douglas fir simulations were run with a resolution of 2 microns. A uniform 512 × 512 × 512 Cartesian grid was used in the native and pyrolyzed Douglas fir simulations. These simulations were run on 128 nodes for a total 4,096 cores for 48 h to ensure the simulation reached steady state with a 4 to 5 order of magnitude drop in momentum residuals. The native and pyrolyzed red oak simulations were run with a 2-micron voxel size, and a uniform 768 × 768 × 768 Cartesian grid. Twelve nodes with 18 cores per node for a total of 216 cores for 240 h were utilized for each of the red oak simulations. The number of nodes used for the red oak simulations was less because the grid size was larger: 128 voxels versus 32 voxels for the Douglas fir simulations. More computational cells were utilized for the red oak simulations because the data sets were larger with a higher resolution than the Douglas fir datasets.
We solve the Navier-Stokes equations in the compressible form on a Cartesian grid framework with an immersed boundary method for resolving complex pore structures, given by:
where
where
A modified advection upwind splitting method (AUSM) scheme (Liou, 2006) suitable for low Mach number flows along with second-order reconstruction and limiting (Tatsumi et al., 2012) is used for hyperbolic flux discretization and a second order central differencing scheme is used for viscous flux discretization away from the immersed boundary. A second-order explicit Runge-Kutta scheme is used for time advance until a steady-state is achieved.
The XCT geometry, obtained as a voxelated file of intensities, is first read into Mesoflow. A threshold intensity value obtained from image processing is used to identify whether a voxel is a solid or a void region. The intensity values were then extrapolated onto the Cartesian grid and all points greater than the threshold are identified as solid regions while the rest are in the fluid region. The Cartesian grids used in this work are kept at a higher resolution than the voxelated files for greater accuracy and grid convergence. The hyperbolic and viscous fluxes were then obtained at each Cartesian face that separates a fluid and solid cell using a simple velocity reflection method which is first order accurate.
Principal permeabilities were extracted from these simulations for application in particle models that utilize a pseudo-homogeneous assumption for internal pore structure (Di Blasi, 1998; Gentile et al., 2017; Pecha et al., 2021). For each particle, three simulations with dominant flow along each axis were set up with a pressure inlet and an outlet along the dominant flow direction and wall boundaries on the transverse boundaries. To the other four boundaries was applied a no flux condition to simulate the Hassler cell type permeability experiments. The simulations were run to steady state as determined by a decrease in calculated momentum residuals of at least four to five orders of magnitude. Permeability was extracted with the simple Darcy’s law equation:
where Ki is the permeability,
MATBOX Numerical Analysis: Void Fraction, Pore Size Distribution and Tortuosity Calculations
Filtering, segmentation, and calculation of void fraction, pore size distribution, and tortuosity factor were performed with the open source software tool MATBOX (Usseglio-Viretta et al., 2022). The image stacks of the cropped XCT sub-volumes of each sample were loaded in tiff format into the MATBOX Filtering and Segmentation module and segmented into 8-bit tiff files with two phases: Phase 0 (void) and Phase 1 (solid) by applying a threshold specific to each sample which was determined by visually analyzing the images. Voxels with intensities below the threshold value are considered void space. An anisotropic diffusion filter developed by (Perona and Malik, 1990) was applied to the full sub-volumes of all of the datasets to smooth the data and reduce noise, except for the native Douglas fir sample which did not require filtering. The pore size distribution, void fraction, and tortuosity factor of each sample were then calculated using the MATBOX Microstructure Characterization module.
The volume fraction is calculated according to Eq. 8:
Where
The tortuosity factors of the sub-volumes are calculated from the ratio between the effective diffusion coefficient along the longitudinal, radial, or tangential directions and the bulk diffusion coefficient, and the porosity using TauFactor developed by (Cooper et al., 2016). TauFactor calculates tortuosity using a finite-difference based approach and fixed Dirichlet boundary conditions. The algorithm first solves the Laplace equation within the sub-volume in the direction of interest, and the effective diffusion coefficient is obtained by analyzing the concentration field via 1D Fick’s first law described in (Laurencin et al., 2012). With these values, the tortuosity,
Where
Pore size distributions are calculated using the Euclidean Distance Map Fitting Method (EDMF) described in (Usseglio-Viretta et al., 2020). This method fits the diameter of a sphere such that its Euclidean distance map cumulative function agrees with the one calculated on the sub-volume, providing a distribution of the distance of the void space to the nearest solid surface calculated on the investigated medium. The method provides a characteristic length relevant to be used as a pore diameter to model transport mechanisms. Size distributions are highly dependent on the numerical method employed to calculate them, as thoroughly investigated in a previous work (Usseglio-Viretta et al., 2020). EDMF exhibits similar results with state of the art discrete particle size algorithms, while being much faster to calculate, and does not suffer from size underestimation of continuum particle size distribution algorithm (Usseglio-Viretta et al., 2020).
Results
3D reconstructions of native and pyrolyzed red oak and Douglas fir particles were obtained via X-Ray computed tomography and reconstruction software. Millimeter-size sub-volumes were extracted from the reconstructions for direct importation into MesoFlow gas-phase flow simulations and MATBOX for numerical analysis. Figure 2 shows the full 3D XCT reconstructions of each sample. The volume shrinkage due to pyrolysis can clearly be seen comparing the native and pyrolyzed samples. Figure 3 depicts the cropped sub-volumes from each of the full particle reconstructions, along with longitudinal, radial, and tangential slices of each sample. The species-specific microstructures are revealed, as the native red oak exhibits a fine pore (i.e., lumen) structure of fiber cells with large-diameter vessel cell channels characteristic of hardwoods, while the native Douglas fir exemplifies the highly regular pore structure comprising arrays of axial tracheids characteristic of softwoods (Ciesielski et al., 2015). Additionally, the effects of thermal treatment on pore structure are apparent: pyrolysis degrades the pore structure, increases void volume, and reduces directional anisotropy, which is especially obvious in the red oak slices. Despite the stark directional differences inherent to native tissues, thermochemical conversion appears to obscure and even erase several key anatomical features.
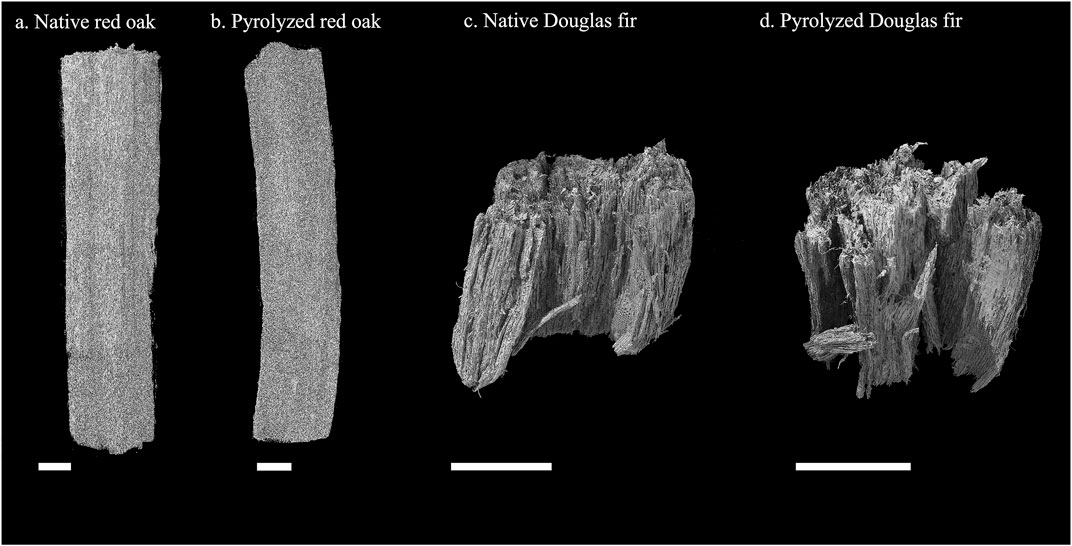
FIGURE 2. Full particle reconstructions of each sample. (A) Native red oak, (B) Pyrolyzed red oak, (C) Native Douglas fir (D) Pyrolyzed Douglas fir. All scale bars indicate 1 mm length.
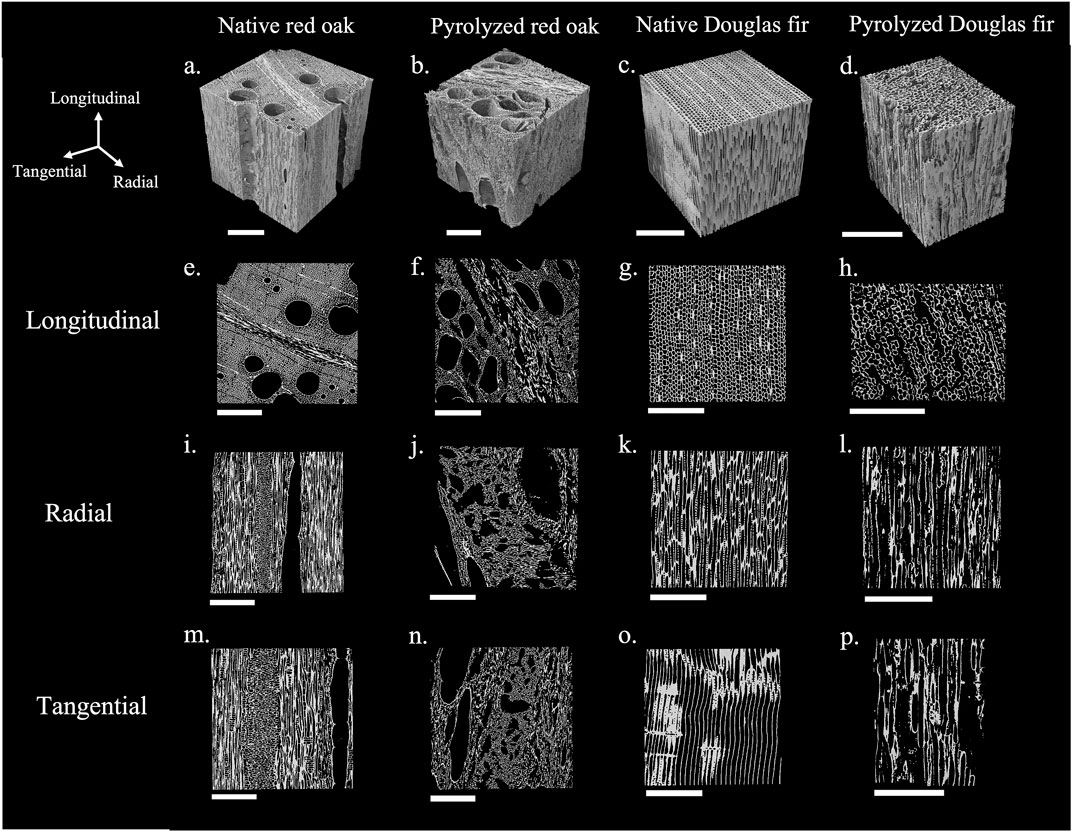
FIGURE 3. Sub-volumes of each sample with longitudinal, radial, and tangential slices. (A) Native red oak sub-volume, (B) Pyrolyzed red oak sub-volume, (C) Native Douglas fir sub-volume, (D) Pyrolyzed Douglas fir sub-volume, Longitudinal slices of (E) Native red oak, (F) Pyrolyzed red oak, (G) Native Douglas fir, (H) Pyrolyzed Douglas fir, Radial slices of (I) Native red oak, (J) Pyrolyzed red oak, (K) Native Douglas fir, (L) Pyrolyzed Douglas fir, Tangential slices of (M) Native red oak, (N) Pyrolyzed red oak, (O) Native Douglas fir, (P) Pyrolyzed Douglas fir. All scale bars indicate 400 µm length.
To quantify these species- and treatment-specific observations, XCT sub-volumes were next subjected to numerical analysis to estimate microstructural features before and after pyrolysis. The calculated volume fraction and tortuosity factors of the void phase of each sample are reported in Table 1. The void fractions of the native red oak and the pyrolyzed red oak are overall larger in magnitude compared to those of the native and pyrolyzed Douglas fir. This is likely because of the presence of larger diameter pore channels in the red oak samples, while the Douglas fir samples exhibit smaller pore channels overall. After pyrolysis, a significant increase in void fraction is observed for all samples. The Douglas fir samples show a 15.9% increase in void fraction after pyrolysis, while that of the red oak show a 22.8% increase in void fraction after pyrolysis. Previously reported values of void fraction for Oak and Douglas Fir from Boigné et al. (2022) are also listed in Table 1. The calculated values from the current study agree with the previously reported values, with slight variations likely due to variability of the material. Particularly, our calculated value for the void fraction of red oak is significantly higher than that reported by Boigné et al. (2022). We attribute this difference to our sample being taken from early wood red oak, which contains more vessel elements than the bulk material and thus a higher void fraction.
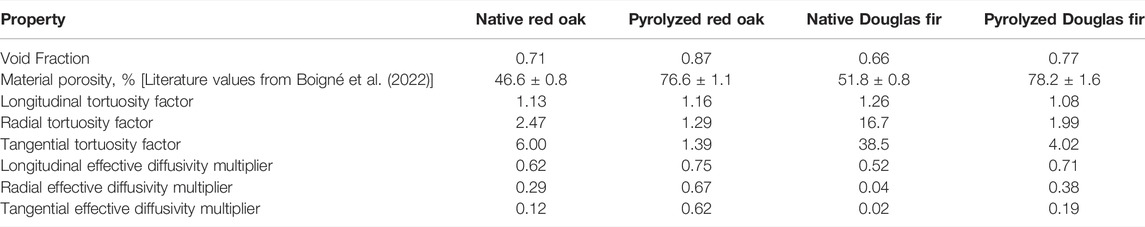
TABLE 1. Calculated void fraction, directional tortuosity factors of the void phase, and directional effective diffusivity multipliers [see Eq. 9] of each species before and after pyrolysis.
Interesting trends are gleaned from the collection of calculated tortuosity factors and the resultant effective diffusivity multipliers (Eq. 9). First, the longitudinal direction of each sample shows the lowest tortuosity factor, consistent with observations of the permeability being highest in the longitudinal directions. This is due to the relatively large vessels present in red oak and the closely packed axial tracheid lumen of Douglas fir species oriented parallel to the longitudinal direction, which promote facile, direct flow (Comstock, 1970). The tortuosity factor in the tangential direction is the highest for all analyzed samples, also in agreement with the calculated values of permeability being lowest in the tangential direction for all samples, because the tangential direction is perpendicular to both the large longitudinal pore channels and the smaller radial ray cells, therefore there are few if any direct paths for flow in the tangential direction. Second, pyrolysis decreases and nearly unifies all directional tortuosity factors regardless of species by reducing the solid phase volume and increasing void fraction, creating larger pore channels with more direct paths for flow. Remarkably, post-treatment tortuosity values are closely consolidated across all coordinates, as seen by the tight agreement among effective diffusivity multipliers following pyrolysis. Indeed, thermal treatment appears to quantitatively erase many anatomical features, creating less tortuous and more directionally uniform channels for heat and mass transport within partially converted biomass particles.
Figure 4 shows color maps representing the distance to the nearest solid phase surface for each sample normal to the longitudinal and tangential directions. The warmer colors indicate a longer distance to the nearest surface, while cooler colors indicate a shorter distance. The centers of the largest pores are deep red, reflecting that they are furthest from the nearest solid surface, i.e., the cell wall. From these graphs and the results of Table 2, one can qualitatively ascertain that pyrolysis increases the size of the void space for both red oak and Douglas fir samples; this finding is visualized by the increase in scale of the colored regions in Figure 4. Additionally, the red oak samples show a higher number of warm-colored areas due to the large diameter pore channels characteristic of this species.
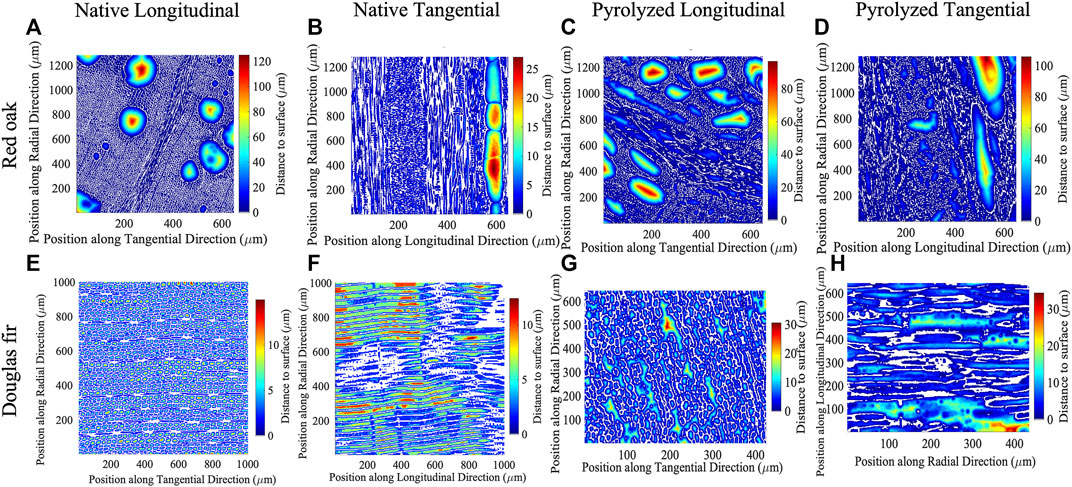
FIGURE 4. Distance-to-surface map of each sample normal to longitudinal and transverse directions: (A) native red oak normal to the longitudinal direction, (B) native red oak normal to the tangential direction, (C) pyrolyzed red oak normal to the longitudinal direction, (D) pyrolyzed red oak normal to the tangential direction, (E) native Douglas fir normal to the longitudinal direction, (F) native Douglas fir normal to the tangential direction, (G) pyrolyzed Douglas fir normal to the longitudinal direction, (H) pyrolyzed Douglas fir normal to the tangential direction. Slices shown are taken from the middle of the analyzed XCT reconstruction sub-volumes. Note that the scalebars are unique to each plot.
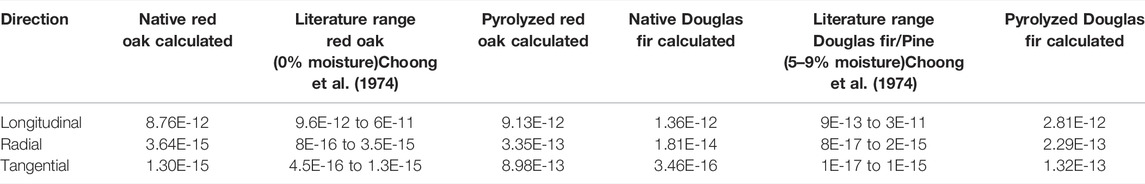
TABLE 2. Calculated permeability tensors for each sample. All values in units of m2 (i.e., m3·m/m2).
Figure 5 shows the fitted Euclidean distance map distribution of the distances to the nearest solid surface for native and pyrolyzed red oak in plot A) as well as native and pyrolyzed Douglas fir in plot B). We note that these distances roughly correspond to half the pore diameter, since they represent the distance from the center of the pore to the nearest cell wall. The distribution of distances to the nearest surface for native red oak shows two peaks, one at 2.2 µm and the other at 4.5 µm. These distances are characteristic of fiber and vessel cells, respectively, present in the red oak microstructure. While the large vessel elements are clearly visible in the XCT reconstructions and distance maps, their relatively low abundance does not produce a recognizable peak in the distribution function. The pyrolyzed red oak distribution also exhibits these two peaks, although the smaller peaks indicate that less of the void population occupies these distances. Most of the population of pores in the native red oak lies below 10 μm, while the pyrolyzed red oak has a larger population beyond 10 µm. This is due to the increase in void space that occurs during pyrolysis, therefore the pore sizes increase, and their interiors are farther away from the nearest solid surface. Similarly, the native Douglas fir distribution shows peaks at 2 and 6.8 µm, representing the ray cells and tracheid cells, respectively, present in the material. The peaks are noticeably wider for the Douglas fir samples compared to the red oak samples, suggesting that the sizes of the ray and tracheid cells in the Douglas fir samples have more variance. There is a higher population of void spaces beyond 10 µm in the native Douglas fir compared to the red oak, likely due to the more uniformly arrayed pore structures characteristic of the larger tracheid and ray cells in the softwood tissue compared to the sparser large-diameter vessel cells in red oak. Pyrolysis increases the population of voids beyond 10 µm from the surface in the case of both samples. Interestingly, the pyrolyzed Douglas fir population exhibits a greater number of peaks at different distances, suggesting that there are dominant pore sizes arising from solid phase deterioration upon pyrolysis. The sizes of such voids become more heterogeneous, with fewer populations being concentrated in specific regions characteristic to the large and small cell lumen domains observed for each native species.
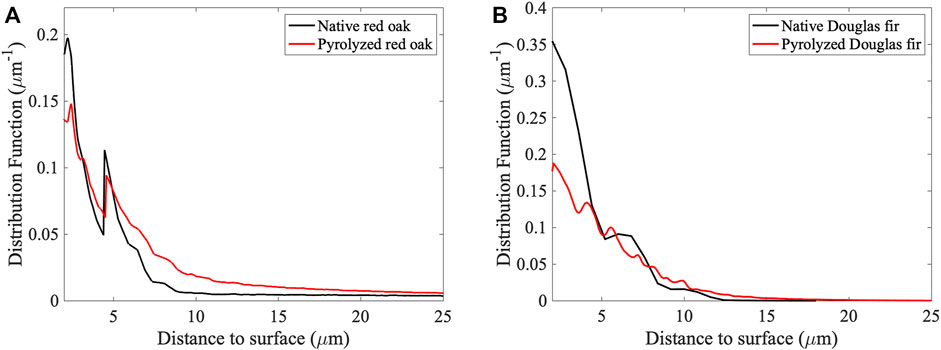
FIGURE 5. Euclidean distance map probability density distribution of pore to surface distance of each sample. Plot (A) shows the distance to surface distribution function of native red oak, shown in black, and pyrolyzed red oak, shown in red. Plot (B) shows the distribution function of native Douglas fir, shown in black, and pyrolyzed Douglas fir, shown in red.
The dominant avenues for gas-phase transport in each direction are visualized by the steady-state velocity magnitudes obtained from the permeability simulations plotted in Figure 6. For the softwood prior to pyrolysis, fluid transport expectedly occurs primarily in the longitudinal direction, facilitated by axial tracheids, while that in the radial direction traverses ray cell channels. In the tangential direction, pits connecting adjacent tracheid cells serve as the major conduits. Transport follows a similar trend for the red oak samples, apart from the large vessel elements providing the primary avenues in the longitudinal direction. The radial and tangential native oak samples also exhibited the lowest permeability values obtained in this study, with values so low in some regions that they were below the visualization cutoff, giving rise to partially unfilled velocity plots for these two simulations.
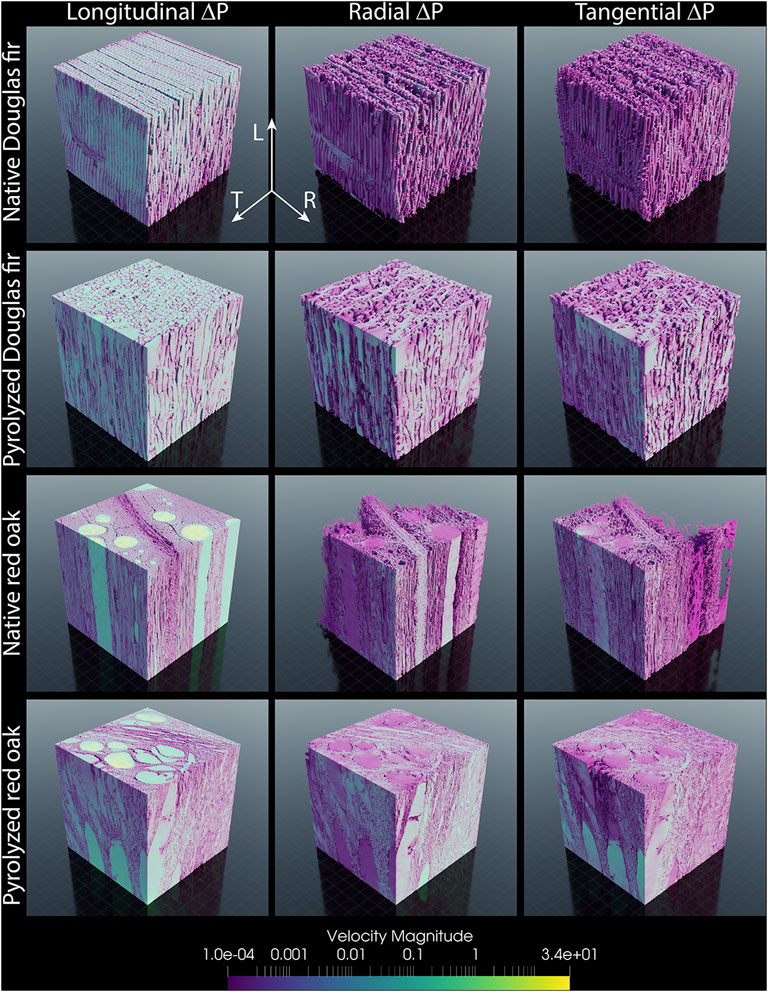
FIGURE 6. Visualization of permeability simulations at steady state for native and pyrolyzed Douglas fir and red oak XCT sub-volumes. Pressure gradients were applied to only one of the longitudinal, radial, and tangential directions in each case. Velocity magnitudes less than 10−4 are below the visualization cutoff, hence the partial renditions for the native red oak simulations in the radial and tangential directions.
The reduction in anisotropy due to pyrolysis is visualized by the velocity magnitude plotted in Figure 6 and further reflected in the calculated permeability values reported in Table 2. In the native samples, the longitudinal direction has the highest permeability by two to four orders of magnitude compared to radial and tangential directions. By contrast, the pyrolyzed samples differ only by roughly one order of magnitude between longitudinal and tangential or radial directions. The permeability of the Douglas fir sample increases in all directions after pyrolysis, whereas the red oak particle exhibits a more significant increase in the tangential and radial directions than in the longitudinal direction after pyrolysis. This is consistent with what can be visually ascertained from the slices in Figure 3, and with the consolidation of directional tortuosity factors upon thermal treatment (Table 1); the large pore channels in the longitudinal direction of the red oak samples contribute significantly to the permeability, and their growth proportional to their initial size is not as significant as in the tangential and radial directions, or as in the longitudinal direction of the Douglas fir samples. Some of the smaller pores in the red oak sample may also be more prone to plugging by plasticized char material during pyrolysis than in the other directions, an effect which may be further compensated by the creation of new macropores within char domains.
The permeability values computed from the transport simulations shown in Table 2 yielded results that are nearly within the range of values for red oak and Douglas fir reported in the literature almost 50 years ago. It is interesting to note that for red oak the ratio of longitudinal to axial permeability was calculated as 2,406 and longitudinal to tangential as 6,738; Choong et al. (1974) reported ratios of approximately 2000 and 1,500, respectively. For oak char, the calculated ratio of longitudinal to axial permeability was 27 and the calculated ratio of longitudinal to tangential permeability was 10. Notably, greater macroporosity was evolved in the radial and tangential direction than in the longitudinal direction, which only increases by around 4%. This is consistent with observations that biochar retains its longitudinal pore structure during pyrolysis in part due to the catalytic effects of ash (Montoya et al., 2017). For Douglas fir, the ratio of longitudinal to axial permeability was calculated as 75 and longitudinal to tangential as 3,930; Comstock (1970) reported ratios of approximately 10,000 and 50,000, respectively. Additionally, for nearly all of the native wood samples, the permeabilities calculated in this study fall within the range of the reported values by Choong and Comstock, except for the radial permeability of the native Douglas fir sample which is higher by an order of magnitude. Although the origin of this discrepancy is uncertain, it could potentially be attributed to the specific geometry of the sub-volume investigated here, or to differences in the sensitivity to very small flowrates of our computational method and of the experimental method employed by Comstock. The reported values for permeability from the literature are measured from native biomass samples and not representative of biochar, for which there are no values reported in the literature to the authors knowledge.
Discussion
In biomass pyrolysis, the effects of anisotropic transport phenomena have become increasingly important for sufficiently predictive models. Often, a suitable permeability tensor is not considered due to a lack of viable data, especially to describe its evolution over the course of pyrolytic conversion of biomass. Di Blasi (1998) noted that this permeability tensor is important for accurate predictions of conversion times and intraparticle flow patterns with large particles in the conduction-controlled regime. To confront this issue, our team has previously constructed geometric approximations that attempted to capture the dominant features that control transport phenomena at the intraparticle scale, which were assumed to be axial tracheids for softwoods and fiber and vessel cells for hardwoods (Ciesielski et al., 2015). However, the geometric models investigated in the aforementioned study neglected important features such as ray cells and pits, which are revealed by the current work to play a dominant role in facilitating transport in the radial and tangential directions. Additional recent work by some of us has empirically investigated the importance of anisotropic permeability and similarly concluded that large ratios of longitudinal to radial permeabilities must be employed in numerical models in order to agree with experimental results (Pecha et al., 2021). However, this study did not include dramatic evolution of radial porosity throughout the pyrolytic process that we observe here, due to lack of quantitative microstructural information. The findings in this work suggest that intraparticle transport models may be improved by calculating the permeability tensor as a function of conversion, wherein longitudinal permeability is marginally enhanced, while new macroporosity emerges in the radial and longitudinal dimensions.
Porosity and pore structure also play a role in reactor-scale modeling. Current state-of-the-art reactor-scale models account for changes in particle size and density, as the drag model for particles is a strong function of these parameters. Recently, particle rocketing due to explosive devolatilization along its longitudinal axis has been observed for small particles in benchtop reactor systems with high temperatures (1200°C), which is evidently due to vapors escaping one end of a particle at high velocities (Llamas et al., 2022). Evidently, anisotropic pore structure and porosity evolution play integral roles in the motion of particles inside of a high-temperature fluidized reactor (Ciesielski et al., 2021; Lu et al., 2021; Llamas et al., 2022; Lu et al., 2022).
Despite its advantages, there are still challenges associated with the method of microstructure characterization described in this work. The first is the sheer size of the data acquired and the time required for acquisition: full particle reconstructions range from around 4–35 GB, with up to tens of billions of voxels, requiring an acquisition time exceeding 30 h for the largest samples. The large size of the datasets makes transfer, analysis, simulation, and visualization of the data computationally expensive and arduous. This can be mitigated by downscaling the data by sampling; however, most of the datasets we acquired could not be down-sampled without losing crucial pore resolution. Choosing smaller samples to image is another approach to decreasing the size of the data acquired. Samples with dimensions between 1–5 mm are ideal for reducing data size and acquisition time while still being easy to handle and representative of bulk microstructure. We addressed this issue by cropping regions of the full datasets into smaller sub-volumes, but this could arguably sacrifice the generality of our results as it may not account for natural variations of extended microstructures within the samples. However, the periodicity and scale of the sub-volumes (∼1 mm3) are sufficiently general descriptors of the diversity of pore details, which typically exist on the scale of a few microns (Forest Products Laboratory, 1953). Even after cropping the full datasets into sub-volumes, Mesoflow simulations required at least 50,000 CPU core-hours to achieve steady state, using an abundance of high-performance computing resources.
An additional limitation of the present study is the lack of information regarding intra-cell wall transport, phenomena which are expected to strongly depend on biomass speciation. Pyrolysis products originate from the cell wall biopolymers and must navigate out of the nanoporous wall matrix into the macroporosity of the cell lumen prior to exiting the particle (Carpita et al., 1979; Kojiro et al., 2010). Future studies could confront this shortcoming using TEM tomography coupled to similar computational methods (Hinkle et al., 2015) to develop a dynamic, intra-cell wall transport model that could be coupled to bulk transport in a hierarchical transport simulation. It remains unknown which of these length scales and expected species dependencies may dominate observable pyrolysis performance in laboratory measurements.
While this work provides datapoints regarding the microstructure of biomass before and after pyrolysis, there still exists a knowledge gap regarding the precise physics which underlie microstructural evolution during pyrolysis. A truly game-changing simulation tool would be capable of predicting the dynamic evolution of pore structure as a function of initial pore structure, external heating conditions, intraparticle transport phenomena, and overall extent of pyrolytic conversion. Such a universal tool would enable a priori selection of biomass feedstocks and design of pyrolytic processes to achieve specific, optimized porosity for biochar applications, such as soil remediation, adsorption, filtration, and catalysis. However, much work remains to fully parameterize a pyrolysis simulation that accurately predicts pore structure evolution, including quantifying the mechanical properties of lignocellulose at different temperatures and extents of conversion.
Conclusion
The current study stands as a proof-of-concept and exposition for capturing particle-scale transport properties of native and thermally treated biomass microstructures using non-destructive XCT imaging paired with numerical analysis and CFD simulations. Detailed characterization of transport properties of red oak and Douglas fir is achieved, including the calculation of directional permeabilities, tortuosity factors, pore size distributions, and void fractions, along with the comparison of these properties before and after pyrolysis. The quantitative microstructural values reported here may be used to parameterize intra-particle transport simulations for these biomass species before and after pyrolysis. A crucial finding of this work is that the anisotropy of the permeability exhibited by native wood tissue is largely attenuated by pyrolysis, which in turn facilitates the creation of unique macroporosity spatially distributed throughout char coproduct domains. While the present findings are specific to the two wood species characterized here, our methods are readily extensible to other feedstocks of interest, such as grasses or genetically modified energy crops, and to alternate conversion strategies where permeability and physical transport properties play governing roles.
Data Availability Statement
The raw data supporting the conclusion of this article will be made available by the authors, without undue reservation.
Author Contributions
The study was conceived and coordinated by PC with assistance from all authors. Wood samples were initially prepared, characterized, and provided by JD. XCT imaging was performed by MC and JK. Void space, pore size distribution, and tortuosity calculations were performed by MC and FU-V. HS is the primary software developer of the Mesoflow solver used in this work. Permeability calculations were performed by MC, HS, and PC with assistance from MP and NT. Data visualization was performed by NB-L. Fast pyrolysis was performed by MP. The manuscript was written by MC with contributions and editorial assistance from all authors.
Conflict of Interest
JHD was employed by Forest Concepts, LLC.
The remaining authors declare that the research was conducted in the absence of any commercial or financial relationships that could be construed as a potential conflict of interest.
The handling editor JH declared a shared affiliation with the authors JK, YX at the time of review.
Publisher’s Note
All claims expressed in this article are solely those of the authors and do not necessarily represent those of their affiliated organizations, or those of the publisher, the editors and the reviewers. Any product that may be evaluated in this article, or claim that may be made by its manufacturer, is not guaranteed or endorsed by the publisher.
Acknowledgments
This work was authored in part by the National Renewable Energy Laboratory, operated by Alliance for Sustainable Energy, LLC, for the United States Department of Energy (DOE) under Contract No. DE-AC36-08GO28308. Funding provided in part by the United States Department of Energy Office of Energy Efficiency and Renewable Energy Bioenergy Technologies Office in support of the Feedstock Conversion and Interface Consortium and the Consortium for Computational Physics and Chemistry. This research was performed using computational resources sponsored by the Department of Energy’s Office of Energy Efficiency and Renewable Energy and located at the National Renewable Energy Laboratory. The views expressed in the article do not necessarily represent the views of the DOE or the United States Government. The United States Government retains and the publisher, by accepting the article for publication, acknowledges that the United States Government retains a nonexclusive, paid-up, irrevocable, worldwide license to publish or reproduce the published form of this work, or allow others to do so, for United States Government purposes. Steven Rowland and Mario Sánchez are acknowledged for their help pyrolyzing the Douglas fir samples.
References
Almgren, A., Sazo, M., Bell, J., Harpole, A., Katz, M., Sexton, J., et al. (2020). CASTRO: A Massively Parallel Compressible Astrophysics Simulation Code. Joss 5 (54), 2513. doi:10.21105/joss.02513
Bartesaghi, A., Sprechmann, P., Liu, J., Randall, G., Sapiro, G., and Subramaniam, S. (2008). Classification and 3D Averaging with Missing Wedge Correction in Biological Electron Tomography. J. Struct. Biol. 162 (3), 436–450. doi:10.1016/j.jsb.2008.02.008
Boigné, E., Bennett, N. R., Wang, A., and Ihme, M. (2022). Structural Analysis of Biomass Pyrolysis and Oxidation Using In-Situ X-ray Computed Tomography. Combustion and Flame 235, 111737. doi:10.1016/j.combustflame.2021.111737
Bruggeman, D. A. G. (1935). Berechnung verschiedener physikalischer Konstanten von heterogenen Substanzen. I. Dielektrizitätskonstanten und Leitfähigkeiten der Mischkörper aus isotropen Substanzen. Ann. Phys. 416 (7), 636–664. doi:10.1002/andp.19354160705
Carpita, N., Sabularse, D., Montezinos, D., and Delmer, D. P. (1979). Determination of the Pore Size of Cell Walls of Living Plant Cells. Science 205 (4411), 1144–1147. doi:10.1126/science.205.4411.1144
Choong, E., Tesoro, F., and Manwiller, F. (1974). Permeability of Twenty-Two Small Diameter Hardwoods Growing on Southern pine Sites. Wood and Fiber 6 (1), 91–101.
Christensen, E., Evans, R. J., and Carpenter, D. (2017). High-resolution Mass Spectrometric Analysis of Biomass Pyrolysis Vapors. J. Anal. Appl. pyrolysis 124, 327–334. doi:10.1016/j.jaap.2017.01.015
Ciesielski, P. N., Wang, W., Chen, X., Vinzant, T. B., Tucker, M. P., Decker, S. R., et al. (2014). Effect of Mechanical Disruption on the Effectiveness of Three Reactors Used for Dilute Acid Pretreatment of Corn stover Part 2: Morphological and Structural Substrate Analysis. Biotechnol. Biofuels 7 (1), 47–12. doi:10.1186/1754-6834-7-47
Ciesielski, P. N., Crowley, M. F., Nimlos, M. R., Sanders, A. W., Wiggins, G. M., Robichaud, D., et al. (2015). Biomass Particle Models with Realistic Morphology and Resolved Microstructure for Simulations of Intraparticle Transport Phenomena. Energy Fuels 29 (1), 242–254. doi:10.1021/ef502204v
Ciesielski, P. N., Pecha, M. B., Lattanzi, A. M., Bharadwaj, V. S., Crowley, M. F., Bu, L., et al. (2020). Advances in Multiscale Modeling of Lignocellulosic Biomass. ACS Sust. Chem. Eng. 8 (9), 3512–3531. doi:10.1021/acssuschemeng.9b07415
Ciesielski, P. N., Pecha, M. B., Thornburg, N. E., Crowley, M. F., Gao, X., Oyedeji, O., et al. (2021). Bridging Scales in Bioenergy and Catalysis: A Review of Mesoscale Modeling Applications, Methods, and Future Directions. Energy Fuels 35 (18), 14382–14400. doi:10.1021/acs.energyfuels.1c02163
Cooper, S. J., Bertei, A., Shearing, P. R., Kilner, J. A., and Brandon, N. P. (2016). TauFactor: An Open-Source Application for Calculating Tortuosity Factors from Tomographic Data. SoftwareX 5, 203–210. doi:10.1016/j.softx.2016.09.002
Di Blasi, C. (1997). Influences of Physical Properties on Biomass Devolatilization Characteristics. Fuel 76 (10), 957–964. doi:10.1016/S0016-2361(97)00096-3
Di Blasi, C. (1998). Physico-chemical Processes Occurring inside a Degrading Two-Dimensional Anisotropic Porous Medium. Int. J. Heat mass transfer 41 (24), 4139–4150. doi:10.1016/s0017-9310(98)00142-2
Filomena, C. M., Hornung, J., and Stollhofen, H. (2014). Assessing Accuracy of Gas-Driven Permeability Measurements: a Comparative Study of Diverse Hassler-Cell and Probe Permeameter Devices. Solid Earth 5 (1), 1–11. doi:10.5194/se-5-1-2014
Forest Products Laboratory (1953). Density, Fiber Length, and Yields of Pulp for Various Species of Wood. Madison, WI, USA: Forest Products Laboratory.
Gentile, G., Debiagi, P. E. A., Cuoci, A., Frassoldati, A., Ranzi, E., and Faravelli, T. (2017). A Computational Framework for the Pyrolysis of Anisotropic Biomass Particles. Chem. Eng. J. 321, 458–473. doi:10.1016/j.cej.2017.03.113
Hinkle, J. D., Ciesielski, P. N., Gruchalla, K., Munch, K. R., and Donohoe, B. S. (2015). Biomass Accessibility Analysis Using Electron Tomography. Biotechnol. Biofuels 8 (1), 212–216. doi:10.1186/s13068-015-0395-8
Holzer, L., Wiedenmann, D., Münch, B., Keller, L., Prestat, M., Gasser, P., et al. (2013). The Influence of Constrictivity on the Effective Transport Properties of Porous Layers in Electrolysis and Fuel Cells. J. Mater. Sci. 48 (7), 2934–2952. doi:10.1007/s10853-012-6968-z
Inyang, M. I., Gao, B., Yao, Y., Xue, Y., Zimmerman, A., Mosa, A., et al. (2016). A Review of Biochar as a Low-Cost Adsorbent for Aqueous Heavy Metal Removal. Crit. Rev. Environ. Sci. Tech. 46 (4), 406–433. doi:10.1080/10643389.2015.1096880
Jiang, J., Zhang, L., Wang, X., Holm, N., Rajagopalan, K., Chen, F., et al. (2013). Highly Ordered Macroporous Woody Biochar with Ultra-high Carbon Content as Supercapacitor Electrodes. Electrochimica Acta 113, 481–489. doi:10.1016/j.electacta.2013.09.121
Kan, T., Strezov, V., and Evans, T. J. (2016). Lignocellulosic Biomass Pyrolysis: A Review of Product Properties and Effects of Pyrolysis Parameters. Renew. Sust. Energ. Rev. 57, 1126–1140. doi:10.1016/j.rser.2015.12.185
Kojiro, K., Miki, T., Sugimoto, H., Nakajima, M., and Kanayama, K. (2010). Micropores and Mesopores in the Cell wall of Dry wood. J. Wood Sci. 56 (2), 107–111. doi:10.1007/s10086-009-1063-z
Kumari, K., Kishore, N., Gupta, S., Aravind, S. V., and Ahmed, G. (2022). Effect of Varying Fraction of Polypropylene Waste on Co-pyrolysis of Delonix Regia and Polyalthia Longifolia Leaves. Curr. Res. Green Sust. Chem. 5, 100233. doi:10.1016/j.crgsc.2021.100233
Laurencin, J., Quey, R., Delette, G., Suhonen, H., Cloetens, P., and Bleuet, P. (2012). Characterisation of Solid Oxide Fuel Cell Ni-8YSZ Substrate by Synchrotron X-ray Nano-Tomography: from 3D Reconstruction to Microstructure Quantification. J. Power Sourc. 198, 182–189. doi:10.1016/j.jpowsour.2011.09.105
Lee, J., Kim, K.-H., and Kwon, E. E. (2017). Biochar as a Catalyst. Renew. Sust. Energ. Rev. 77, 70–79. doi:10.1016/j.rser.2017.04.002
Liou, M.-S. (2006). A Sequel to AUSM, Part II: AUSM+-up for All Speeds. J. Comput. Phys. 214 (1), 137–170. doi:10.1016/j.jcp.2005.09.020
Llamas, A. D. G. G., Guo, N., Li, T., Gebart, R., and Umeki, K. (2022). Rapid Change of Particle Velocity Due to Volatile Gas Release during Biomass Devolatilization. Combustion and Flame 238, 111898. doi:10.1016/j.combustflame.2021.111898
Lu, L., Gao, X., Dietiker, J.-F., Shahnam, M., and Rogers, W. A. (2022). MFiX Based Multi-Scale CFD Simulations of Biomass Fast Pyrolysis: A Review. Chem. Eng. Sci. 248, 117131. doi:10.1016/j.ces.2021.117131
Lu, L., Gao, X., Gel, A., Wiggins, G. M., Crowley, M., Pecha, B., et al. (2021). Investigating Biomass Composition and Size Effects on Fast Pyrolysis Using Global Sensitivity Analysis and CFD Simulations. Chem. Eng. J. 421, 127789. doi:10.1016/j.cej.2020.127789
Luterbacher, J. S., Parlange, J.-Y., and Walker, L. P. (2013). A Pore-Hindered Diffusion and Reaction Model Can Help Explain the Importance of Pore Size Distribution in Enzymatic Hydrolysis of Biomass. Biotechnol. Bioeng. 110 (1), 127–136. doi:10.1002/bit.24614
Millington, R. J., and Quirk, J. P. (1961). Permeability of Porous Solids. Trans. Faraday Soc. 57, 1200–1207. doi:10.1039/tf9615701200
Montoya, J., Pecha, B., Janna, F. C., and Garcia-Perez, M. (2017). Identification of the Fractions Responsible for Morphology Conservation in Lignocellulosic Pyrolysis: Visualization Studies of Sugarcane Bagasse and its Pseudo-components. J. Anal. Appl. Pyrolysis 123, 307–318. doi:10.1016/j.jaap.2016.11.015
Musser, J., Almgren, A. S., Fullmer, W. D., Antepara, O., Bell, J. B., Blaschke, J., et al. (2021). MFIX-exa: A Path toward Exascale CFD-DEM Simulations. Int. J. High Perform. Comput. Appl. 36, 10943420211009293. doi:10.1177/10943420211009293
Object Research Systems (ORS) Inc (2021). Dragonfly 2021.3 for [Windows 11]. Montreal, Canada: Object Research Systems ORS Inc.
Pecha, M. B., Arbelaez, J. I. M., Garcia-Perez, M., Chejne, F., and Ciesielski, P. N. (2019). Progress in Understanding the Four Dominant Intra-particle Phenomena of Lignocellulose Pyrolysis: Chemical Reactions, Heat Transfer, Mass Transfer, and Phase Change. Green. Chem. 21 (11), 2868–2898. doi:10.1039/c9gc00585d
Pecha, M. B., Garcia-Perez, M., Foust, T. D., and Ciesielski, P. N. (2017). Estimation of Heat Transfer Coefficients for Biomass Particles by Direct Numerical Simulation Using Microstructured Particle Models in the Laminar Regime. ACS Sust. Chem. Eng. 5 (1), 1046–1053. doi:10.1021/acssuschemeng.6b02341
Pecha, M. B., Thornburg, N. E., Peterson, C. A., Crowley, M. F., Gao, X., Lu, L., et al. (2021). Impacts of Anisotropic Porosity on Heat Transfer and Off-Gassing during Biomass Pyrolysis. Energy & Fuels 35, 20131. doi:10.1021/acs.energyfuels.1c02679
Perona, P., and Malik, J. (1990). Scale-space and Edge Detection Using Anisotropic Diffusion. IEEE Trans. Pattern Anal. Machine Intell. 12 (7), 629–639. doi:10.1109/34.56205
Plötze, M., and Niemz, P. (2011). Porosity and Pore Size Distribution of Different wood Types as Determined by Mercury Intrusion Porosimetry. Eur. J. Wood Wood Prod. 69 (4), 649–657. doi:10.1007/s00107-010-0504-0
Shah, S. M., Crawshaw, J. P., and Boek, E. S. (2017). Three-dimensional Imaging of Porous media Using Confocal Laser Scanning Microscopy. J. Microsc. 265 (2), 261–271. doi:10.1111/jmi.12496
Sitaraman, H., Kuhn, E. M., Nag, A., Sprague, M. A., Tucker, M. P., and Stickel, J. J. (2015). Multiphysics Modeling and Simulation of High-Solids Dilute-Acid Pretreatment of Corn stover in a Steam-Explosion Reactor. Chem. Eng. J. 268, 47–59. doi:10.1016/j.cej.2015.01.020
Sitaraman, H., Vaidhynathan, D., Grout, R., Hauser, T., Hrenya, C. M., and Musser, J. (2021a). An Error-Controlled Adaptive Time-Stepping Method for Particle Advancement in Coupled CFD-DEM Simulations. Powder Tech. 379, 203–216. doi:10.1016/j.powtec.2020.10.051
Sitaraman, H., Yellapantula, S., Henry de Frahan, M. T., Perry, B., Rood, J., Grout, R., et al. (2021b). Adaptive Mesh Based Combustion Simulations of Direct Fuel Injection Effects in a Supersonic Cavity Flame-Holder. Combustion and Flame 232, 111531. doi:10.1016/j.combustflame.2021.111531
Sun, Q., Xia, Y., Klinger, J., Seifert, R., Kane, J., Thompson, V., et al. (2021). X-ray Computed Tomography-Based Porosity Analysis: Algorithms and Application for Porous Woody Biomass. Powder Tech. 388, 496–504. doi:10.1016/j.powtec.2021.05.006
Tatsumi, S., Martinelli, L., and Jameson, A. (2012). “A New High Resolution Scheme for Compressible Viscous Flows with Shocks,” in 33rd Aerospace Sciences Meeting and Exhibit, Reno, NV, January 9–12, 1995, 466.
Thornburg, N. E., Pecha, M. B., Brandner, D. G., Reed, M. L., Vermaas, J. V., Michener, W. E., et al. (2020). Mesoscale Reaction-Diffusion Phenomena Governing Lignin‐First Biomass Fractionation. ChemSusChem 13 (17), 4495–4509. doi:10.1002/cssc.202000558
Törnqvist, M., Hurme, T., and Rosenholm, J. B. (2001). Drift Speed: a Way of Measuring Diffusion and Tortuosity of Porous Materials. Colloids Surf. A: Physicochemical Eng. Aspects 180 (1), 23–31. doi:10.1016/S0927-7757(00)00732-9
Usseglio-Viretta, F. L. E., Finegan, D. P., Colclasure, A., Heenan, T. M. M., Abraham, D., Shearing, P., et al. (2020). Quantitative Relationships between Pore Tortuosity, Pore Topology, and Solid Particle Morphology Using a Novel Discrete Particle Size Algorithm. J. Electrochem. Soc. 167 (10), 100513. doi:10.1149/1945-7111/ab913b
Usseglio-Viretta, F. L. E., Patel, P., Bernhardt, E., Mistry, A., Mukherjee, P. P., Allen, J., et al. (2022). MATBOX: An Open-Source Microstructure Analysis Toolbox for Microstructure Generation, Segmentation, Characterization, Visualization, Correlation, and Meshing. SoftwareX 17, 100915. doi:10.1016/j.softx.2021.100915
Verheijen, F., Jeffery, S., Bastos, A. C., Van der Velde, M., and Diafas, I. (2010). Biochar Application to Soils. A. Critical Scientific Review Effects Soil Properties, Processes, Functions. EUR. 24099, 162.
Zhang, W., Almgren, A., Beckner, V., Bell, J., Blaschke, J., Chan, C., et al. (2019). AMReX: a Framework for Block-Structured Adaptive Mesh Refinement. Joss 4 (37), 1370. doi:10.21105/joss.01370
Keywords: feedstock conversion, x-ray computed tomography, adaptive mesh refinement, pyrolysis, biomass, transport phenomena, characterization, image analysis
Citation: Crowley MF, Sitaraman H, Klinger J, Usseglio-Viretta F, Thornburg NE, Brunhart-Lupo N, Pecha MB, Dooley JH, Xia Y and Ciesielski PN (2022) Measurement of Transport Properties of Woody Biomass Feedstock Particles Before and After Pyrolysis by Numerical Analysis of X-Ray Tomographic Reconstructions. Front. Energy Res. 10:850630. doi: 10.3389/fenrg.2022.850630
Received: 07 January 2022; Accepted: 06 April 2022;
Published: 28 April 2022.
Edited by:
J. Richard Hess, Idaho National Laboratory (DOE), United StatesReviewed by:
Ravikrishnan Vinu, Indian Institute of Technology Madras, IndiaNanda Kishore, Indian Institute of Technology Guwahati, India
Copyright © 2022 Crowley, Sitaraman, Klinger, Usseglio-Viretta, Thornburg, Brunhart-Lupo, Pecha, Dooley, Xia and Ciesielski. This is an open-access article distributed under the terms of the Creative Commons Attribution License (CC BY). The use, distribution or reproduction in other forums is permitted, provided the original author(s) and the copyright owner(s) are credited and that the original publication in this journal is cited, in accordance with accepted academic practice. No use, distribution or reproduction is permitted which does not comply with these terms.
*Correspondence: Peter N. Ciesielski, cGV0ZXIuY2llc2llbHNraUBucmVsLmdvdg==