 Shu Liu1*
 Yan Liu
- 1Shenyang Institute of Engineering, Shenyang, China
- 2Shenyang Faleo Technology Co., Ltd., Shenyang, China
To solve the instability problem of wind turbine power output, the wind power was predicted, and a wind power prediction algorithm optimized by the backpropagation neural network based on the CSO (cat swarm optimization) algorithm was studied, and a wind farm energy storage system model was built on this basis. By collecting the wind power plant’s historical wind speed, power, and other parameters, the short-term wind farm output power was predicted, and the operation of the wind farm energy storage system was controlled to suppress the output power of the wind farm when the wind farm was connected to the grid so as to improve the stability of the output power of the wind farm. At the same time, typical wind farm data were taken as an example to verify the feasibility of the proposed method.
Introduction
With the continuous improvement of the wind power technology, wind energy has become the most important part of all kinds of new energy. Because wind power itself has strong randomness, the output power is unstable, which will affect the safety of the power grid. Therefore, research on wind power prediction is the key to ensure the safety of the power grid and improve the efficiency of wind farms (Liu S et al., 2021; Liu Y et al., 2021; Sun et al., 2021).
In the literature (Fan et al., 2020), the method of adding NWP (numerical weather prediction) data into historical power data and combining the BP neural network to predict the ultra-short-term wind power can improve the accuracy of the predicted value. The literature (Wang, 2013) optimized the BP network with a genetic algorithm. Compared with the single BP neural network, the corresponding network weights and thresholds can be better found, and the optimized BP neural network is more accurate in prediction. However, the genetic algorithm itself has some shortcomings; the training speed of BP will be slow after optimization by the genetic algorithm. In the literature (Fang, 2011), the random time series method was used to predict the short-term wind power, and the autoregressive-integrated moving average model was constructed. On this basis, the accuracy of the model was improved through particle swarm optimization and genetic algorithm optimization. In reference (Zhang et al., 2020), the CSO algorithm was combined with the ant colony algorithm aiming at the problem of the slow fusion speed of the traditional ant colony algorithm. The problem of slow convergence of the single ant colony algorithm is solved successfully, and the possibility of the algorithm falling into local optima is avoided. In the literature (Yang et al., 2017), two search modes of the CSO algorithm are used to solve the TSP problem. When the SIZE of TSP is small, the CSO algorithm can converge to the optimal range. When the size of TSP is large, the solutions of the CSO algorithm are also convergent, and good results can be achieved. According to the literature (Zhang and Mao, 2019), the energy storage system has the characteristics of accurately tracking the system regulation command and quickly responding to the change of the system frequency. The energy storage system participates in the frequency regulation of the power system, which can effectively suppress the fluctuation of the power output.
In view of some problems existing in the BP neural network, this study proposes a method to optimize a single BP neural network by using the CSO algorithm. The BP neural network is optimized by the CSO algorithm’s strong searching ability so that the optimized BP neural network converges faster; the prediction results are more accurate, and it is not easy to fall into local optimal problems.
Algorithm Analysis
CSO Optimization Algorithm
From a biological point of view, there are 32 kinds of animals that can be classified as felidae, including cats, tigers, lions, and other animals. Although they live in different conditions, the habits of each felidae are very similar. Cats are very vigilant, even when they are at rest; they will maintain a relatively high vigilance and can respond to their surroundings in a timely manner. As long as a target is found, they will track and then quickly capture it. The CSO algorithm is based on the cat’s instinct of tracking and searching. The cat is an optimal solution to the problem. It can be divided into two forms: one is the situation of the cat when tracking the prey. The CSO algorithm in this mode is called the tracking mode, and the other mode is that the cat keeps alert to the surrounding at rest, which is called the search mode (Gao et al., 2021; Zou et al., 2021; Zhang, 2019; Ma and Shi, 2014; Yang et al., 2019; Ao et al., 2015).
The steps of the search mode can be divided into rest, view, and search. These steps are used to simulate the current situation of the cat. Accordingly, several basic concepts are defined, including self-position judgment
(1) j copies of the current location are added in the memory pool,
(2) All individuals in the memory pool are randomly added or subtracted by
(3) The fitness of each candidate solution in the memory pool is calculated separately.
(4) The candidate solution with the highest fitness is used to replace the current location of the cat to complete the update.
The tracking mode is to simulate the situation of the cat tracking the prey. It is to change the eigenvalue of the cat’s speed to complete the update of the cat’s location, particularly by adding a random interference to complete the speed change.
(1) Speed update. The current optimal solution
Vi,d (t+1) is the velocity of the ith cat in the d dimension after updating, and M is the dimension;
(2) Analysis is conducted to confirm whether the characteristic values of the velocity change are all within
(3) Location update. According to Formula 2, the cat position is updated by using the updated speed.
Hence,
Optimization of the BP Neural Network Process by the CSO Algorithm
Due to some characteristics of the neural network, it is very important to set weights in the learning stage. Different weights will bring different results. At the same time, it is difficult to calculate the best solution under some interference. Therefore, the optimization BP neural network should be carried out from three aspects, that is, the threshold value of each layer of neurons and the weight value, the learning parameters set by the hidden layer, and the structure of the neural network. With the characteristics of the strong optimization ability of the CSO algorithm, the threshold and weight of the neural network are optimized to find the optimal solution in this study. Finally, the neural network optimized by CSO is used to predict the wind power and then compared with the non-optimized neural network (Zhang and Mao, 2019; Duan and Li, 2021; Huang et al., 2021). The BP neural network algorithm flow chart and CSO optimization algorithm flow chart are shown inFigures 1, 2.
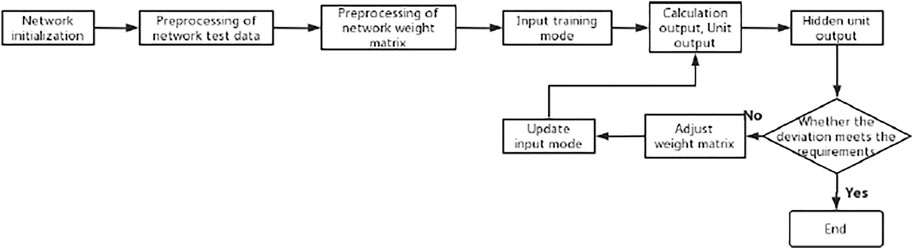
FIGURE 1. Flow chart of the BP neural network algorithm.
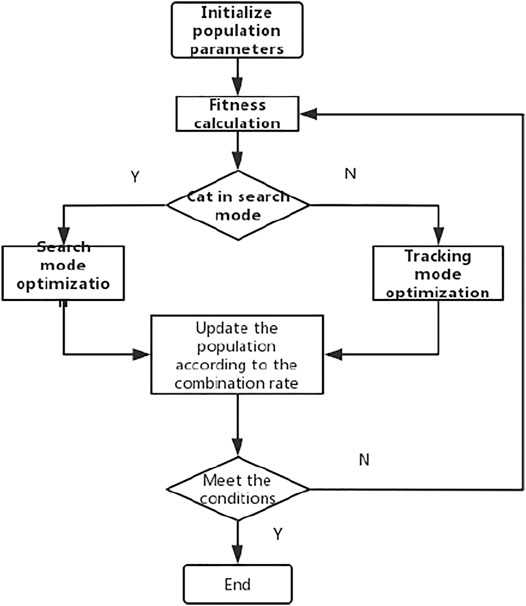
FIGURE 2. Flow chart of the CSO algorithm.
CSO Optimization Algorithm
The structure of the BP neural network optimized by the CSO algorithm consists of three layers of input signal, one layer of output signal, and eight layers of hidden layer. Wind speed, temperature, and pressure are the input data of the network, and the wind power is the output data of the network. The input data of the network are transformed into output data after successively passing through the input layer, hidden layer, and output layer, as shown in Figure 3.
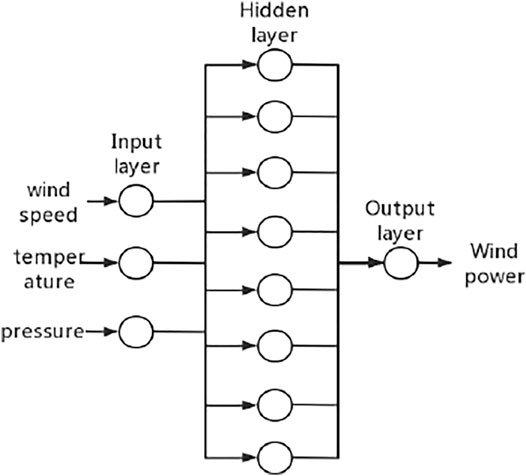
FIGURE 3. Structural diagram of the BP neural network optimized by CSO.
Wind Power Prediction Simulation
To construct the BP neural network and set network parameters, it is necessary to determine the hidden layer function, the number of neurons, the learning rate, the output layer function, etc. In MATLAB, the newff function is used to construct the whole neural network. The puerlin function is used as the output layer function; Learngdm is used as a learning function; Trainlm function is used as the training function. The hidden layer function chooses the tansig function.
After data collection, the BP neural network model is established by Malta for prediction. The structure of the BP neural network has four inputs and one output. Temperature, atmospheric, air density, and wind speed are considered as the input, and the wind power is considered as the output The basic idea of the model is to collect samples every 5 min; 200 groups of data are taken as the input of the training set, and output 50 wind speed and wind power data are taken as the output of the training set to train the neural network so as to predict the future short term of wind power and carry out multiple simulations at the same time.
Wind speed data and wind power data of a wind farm in 2012 are sampled every 5 min, as shown in Table 1.
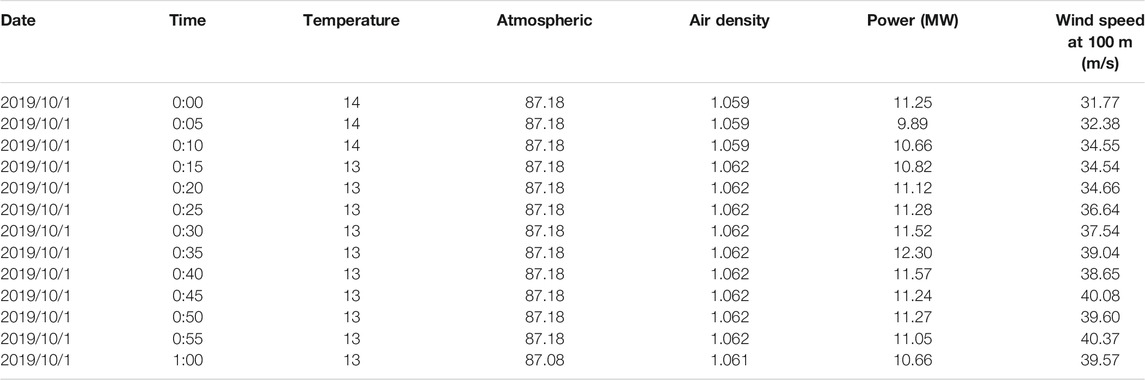
TABLE 1. Some wind farm parameters.
The BP neural network is used to train the data, and the number of iterations is set to 1,000. When the training error of an iteration is less than the threshold, the iteration stops. If the number of iteration reaches 1,000 but the training error is not less than the threshold, the iteration will also stop. The learning rate is set to 0.01, which reflects the learning efficiency of the whole program, and the target accuracy is set to 0.001; once the training accuracy is less than this value, the training will stop. The BP neural network simulation training diagram is shown in Figure 4, and the CSO algorithm BP neural network simulation training diagram is shown in Figure 5.
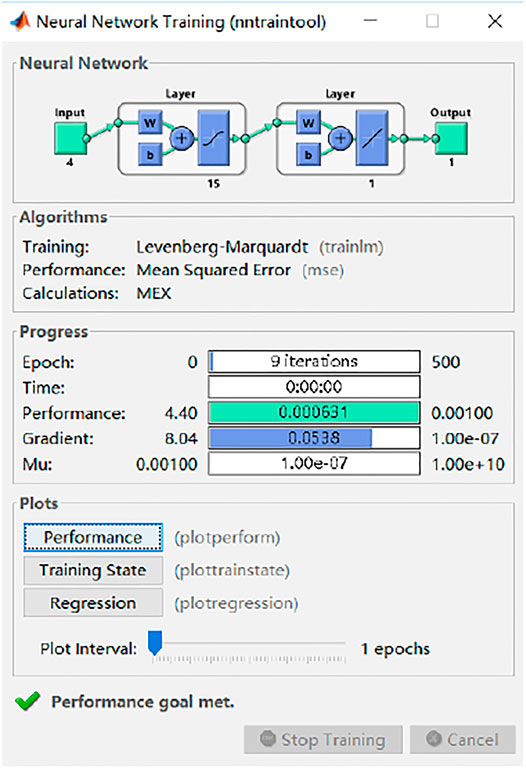
FIGURE 4. BP neural network simulation training diagram.
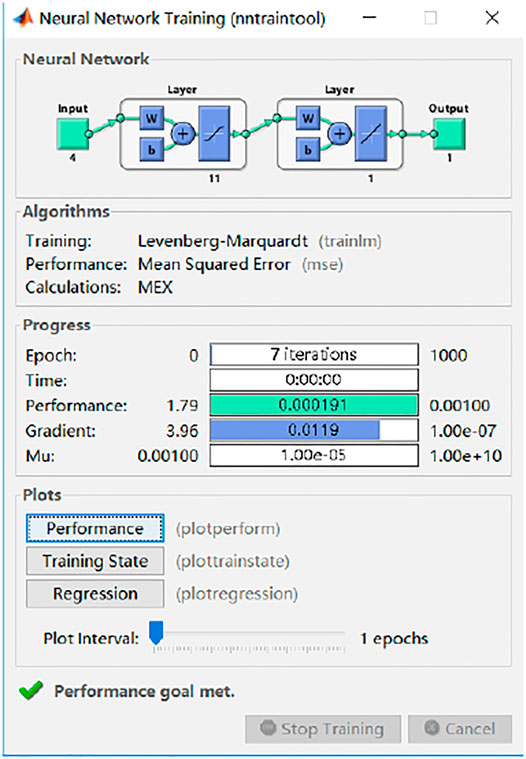
FIGURE 5. CSO BP neural network simulation training diagram.
The comparison between Figures 5, 6 shows that the iteration times of the BP neural network after CSO are reduced from 9 times to 7 times.
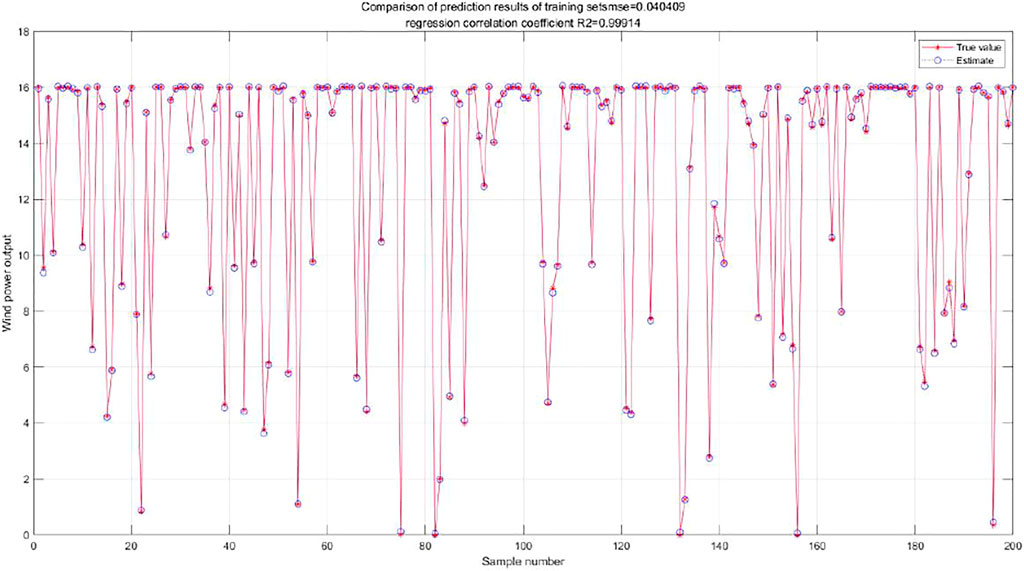
FIGURE 6. Comparison of BP neural network training.
In order to more intuitively reflect the difference between the actual wind power output value and the predicted power output value, the mean square deviation is introduced:
Here, N is the total number of all samples;
The comparison of BP neural network training is shown in Figure 6. The red line segment in the figure represents the training status of the network, and the training error of the network is 0.040409.
Comparison of CSO optimized BP neural network training is shown in Figure 7. It can be seen from Figure 7 that the training error of the BP neural network after CSO is reduced from 0.040409 to 0.0035499. It is obviously concluded that the training effect of the BP neural network after CSO is better.
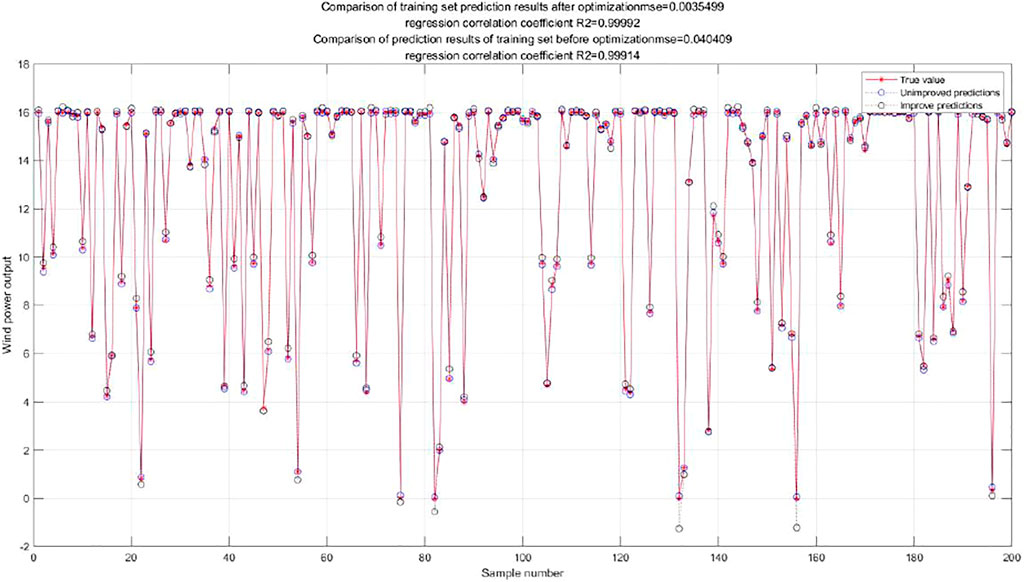
FIGURE 7. Comparison of CSO optimized BP neural network training.
The comparison diagram of BP neural network prediction is shown in Figure 8. The figure shows the actual output value of wind power and the predicted output value of the program. The star points on the red line segment represent the actual wind power output, and the circle points on the blue line segment represent the predicted output of the program.
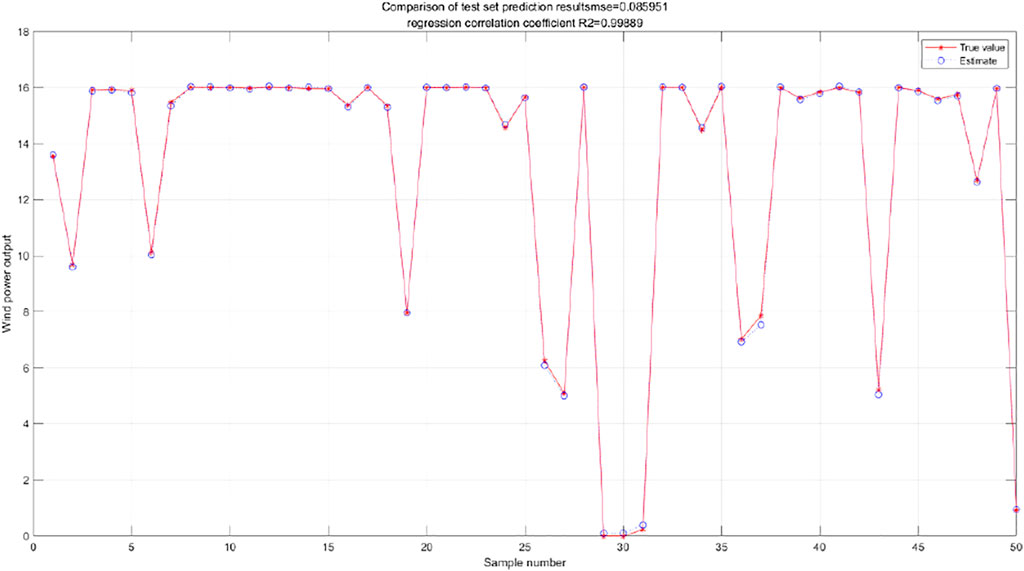
FIGURE 8. Comparison of BP neural network prediction.
According to Formula 3, the mean square error of the BP neural network is 0.085951. It can be seen that the prediction result of wind power without optimization basically corresponds to the actual output trend of the wind power, but the convergence speed is slow and the fluctuation range is high, and there is a large deviation from the actual wind power.
Figure 9 is the comparison diagram of CSO BP neural network prediction. It can be seen from the figure that the prediction results after CSO are more accurate and more stable and reliable than the BP neural network prediction before optimization. The optimized mean square error is reduced from 0.085951 to 0.0063812, which greatly improves the prediction accuracy of the program.
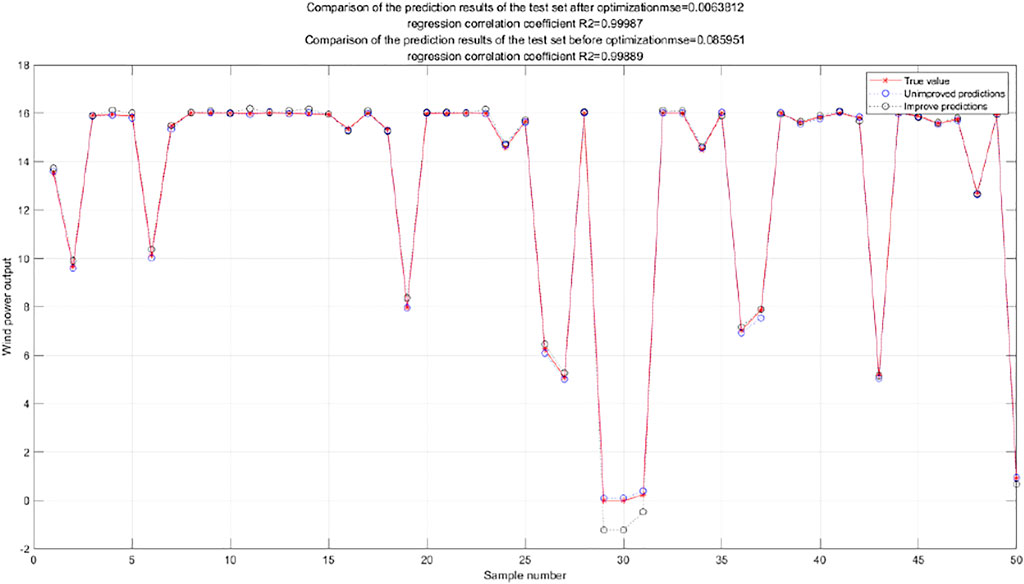
FIGURE 9. Comparison diagram of CSO optimized BP neural network prediction.
By comparing Figures 8, 9, it can be seen that the BP neural network optimized by CSO can eliminate certain randomness, which not only improves the training effect of the network but also makes the prediction result more accurate. In the same environment, it can play a role in predicting the wind power and enhance the operation stability of the wind farm.
The CSO BP neural network error comparison is shown in Figures 10, 11. Figure 10 represents the error convergence of the BP neural network optimized by the CSO algorithm, and Figure 11 represents the error convergence of the BP neural network optimized by the CSO algorithm. It can be seen from Figure 10 that when the accuracy of the BP neural network algorithm without algorithm optimization reaches the set value, it iterates nine times. In the early stage, the error approximation speed is fast, but as the error value approaches the target value, the speed gradually slows down. It can be seen from Figure 11 that when the precision of the BP neural network algorithm optimized by the CSO algorithm reaches the set value, it iterates twice. The error approximation speed in the early stage is similar to that before the improvement, but the approximation speed is gradually accelerated as the error value approaches the target value.
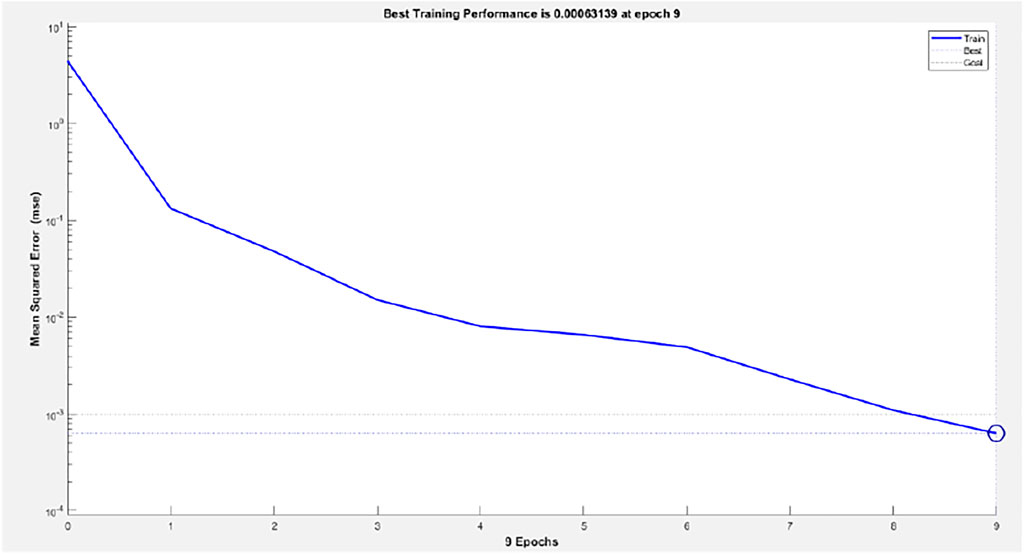
FIGURE 10. BP neural network error comparison diagram.
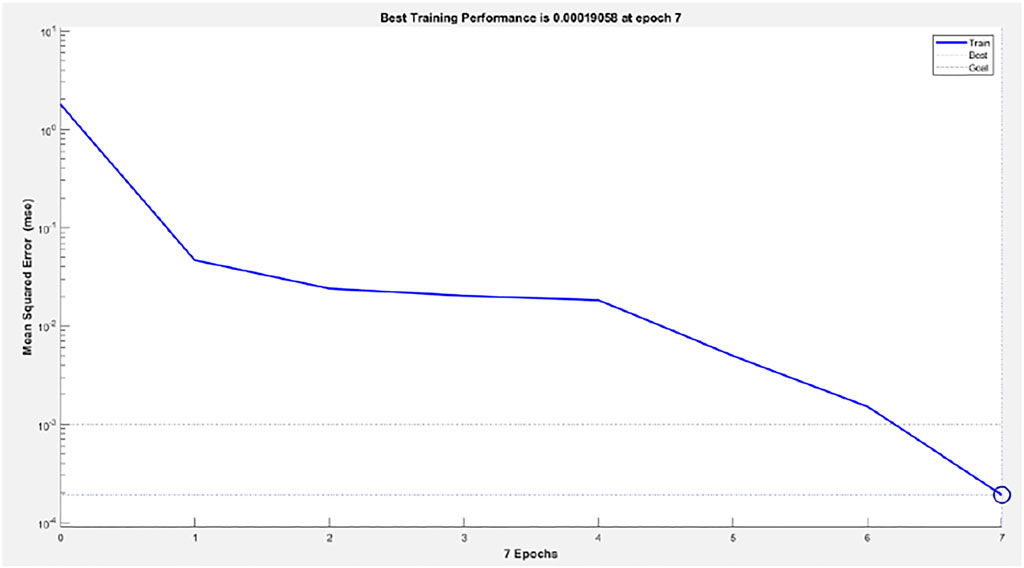
FIGURE 11. Comparison diagram of the CSO BP neural network error.
Under the condition of setting the same precision, the BP neural network algorithm not optimized by the CSO algorithm needs nine iterations to reach the set accuracy, while the BP neural network error algorithm optimized by the CSO algorithm only needs seven iterations to reach the set accuracy. It can be concluded that CSO algorithm optimization can improve the convergence speed of the BP neural network.
Wind Farm Energy Storage System Based on Wind Power Prediction
Selection of Wind Farm Energy Storage Technology
Energy storage system (ESS) has the characteristics of dynamic energy absorption and timely release, which can effectively compensate for the intermittency and fluctuation of wind power, improve the controllability of the wind farm output power, and enhance the stability level. In the wind power grid connected system, various energy storage technologies are often needed to improve the stability and economy of the system power supply. At present, the commonly used energy storage technologies mainly include mechanical energy storage, chemical energy storage, and electromagnetic energy storage. Chemical energy storage is the battery energy storage, which has the advantage of the high energy storage density. It is most appropriate to use in wind farm energy storage. This design uses the lithium battery energy storage in chemical energy storage.
Since the wind power prediction system in this study gives the average power of 200 min, the prediction error increases with the increase of the predicted lead time. When the wind speed is high and the power output of the wind turbine is large, the energy storage system temporarily stores the excess power of the wind turbine in the energy storage system to reduce the peak voltage of the system. When the wind speed is low and there is no wind turbine failure and shutdown, the power output of wind turbines is insufficient or the grid load increases; the energy storage system releases the stored energy and converts it into electric energy to make up for the electricity needs of the grid and maintain the stability of the transmission power of the grid. (Tan, 2013; Wu and Jiang, 2014).
Simulation Modeling of the Wind Farm Energy Storage System
The wind farm is composed of 8 0.15 mV DFIG. The grid-connected voltage at the outlet is 575 V, and the dc side voltage is 1,380 V. The voltage increases to 25 KV through the booster transformer and then increases to the infinite power grid through the 30 km transmission line; see Figure 12. The grid-connected model was built based on the MATLAB/Simulink simulation tool, and the wind power generation model was built and packaged according to the aforementioned control strategy. The encapsulated double-fed wind turbine system model is at the far right of Figure 12.
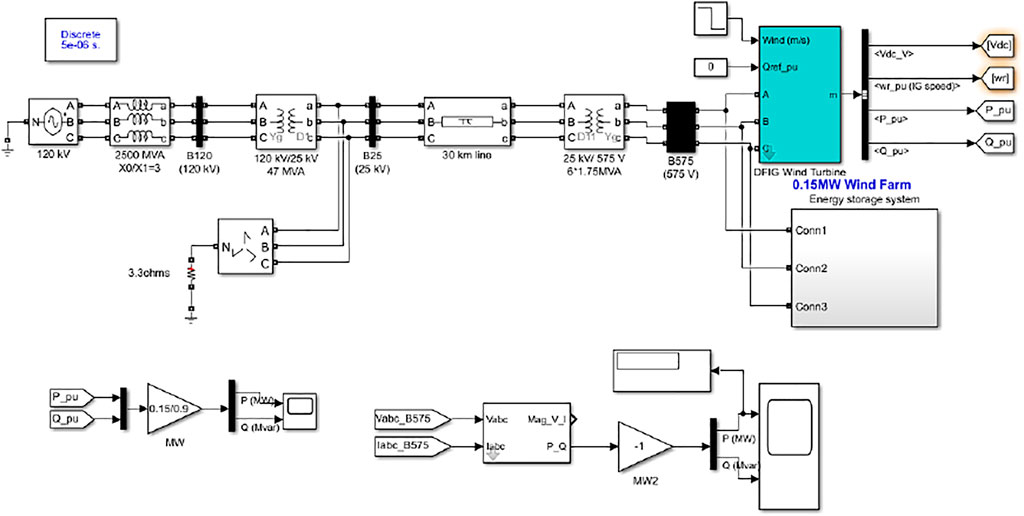
FIGURE 12. Grid connection model diagram of the wind energy storage system.
The structure of the encapsulated lithium battery energy storage system model is shown in Figure 13. The battery pack consists of 400 single lithium batteries with a rated voltage of 1,280 V, an initial SOC of 80%, a rated capacity of 200 Am, a maximum output capacity of 1.5 MW converter, and a filter capacity of 10 K var. Based on the need for simulating and observing SOC changes, the battery pack capacity is small. In this model, the energy storage system can charge and discharge according to the given power deficiency value and suppress the power fluctuation of an ac bus.
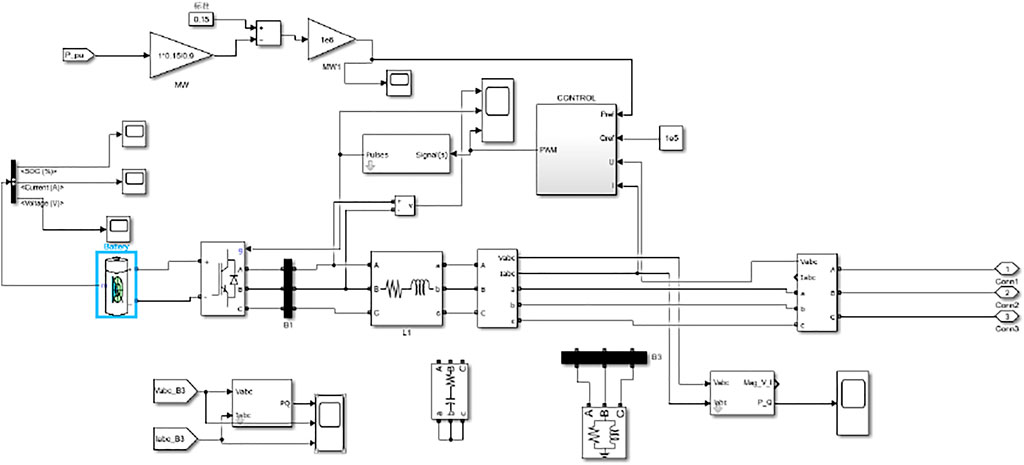
FIGURE 13. Internal structure diagram of the energy storage system model.
According to the above model, the wind farm power deficit change curve and wind farm power output change curve can be simulated, as shown in Figures 14, 15. The graph shows the difference between the wind farm output power and rated power.

FIGURE 14. Variation curve of the wind farm power deficit.
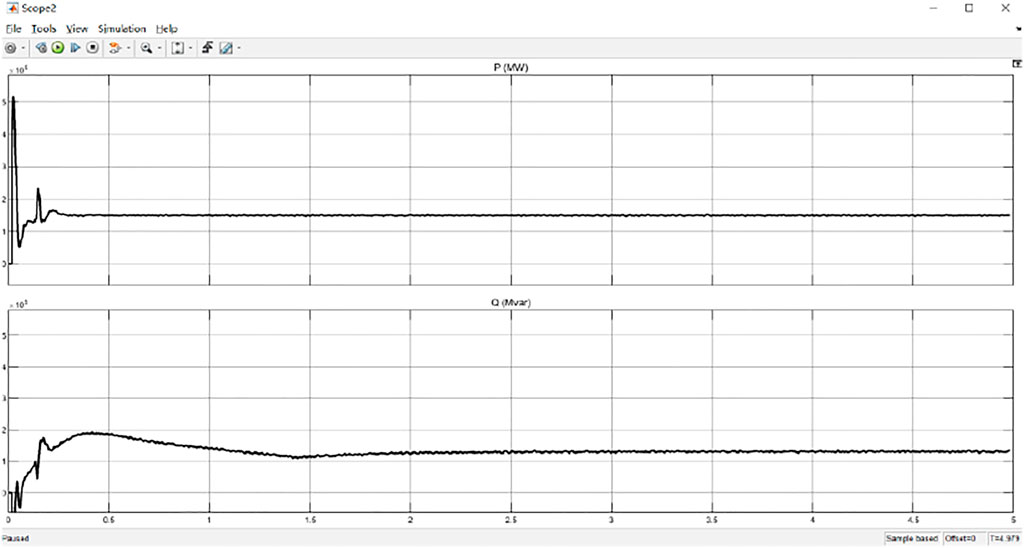
FIGURE 15. Variation curve of the wind farm power output.
It can be seen from Figures 14, 15 that the energy storage system can quickly respond to wind speed changes so that the wind farm’s missing power curve and the wind farm’s output power curve are very smooth and controlled within a certain fluctuation range, which fully conforms to the expected results and can achieve the purpose of suppressing wind power fluctuations.
Concluding Remarks
Accurate wind power prediction is the key problem for the normal operation of the wind power generation system. Due to some characteristics of the BP neural network itself, the prediction accuracy is not high, and the CSO algorithm has the advantage of strong optimization ability, so the combination of the CSO algorithm and BP neural network finally obtained the improved BP neural network algorithm by CSO. Through a series of simulation experiments, the improved CSO-BP algorithm is more accurate than the single BP neural network algorithm and can effectively improve the accuracy of wind farm power prediction. The wind farm energy storage system designed on this basis can control the output of the energy storage system in advance and adjust the output power of the wind farm when it is connected to the grid through the predicted output power of the wind farm, providing a reliable solution to the problem of unstable power generation of wind farms.
Data Availability Statement
The raw data supporting the conclusion of this article will be made available by the authors, without undue reservation.
Author Contributions
Work concept or design, SL; data collection, LW; draft manuscript, HJ; make important modifications to the manuscript, YL; approve the final manuscript to be published, HY.
Funding
First fund project: Major Scientific Research Projects of the Inter-university Cooperation of General Undergraduate Universities in Liaoning Province; Project name: Research on Non-destructive Detection Method Based on Wind Turbine Blade Surface Condition; Project category: Industrial research and industrialization guidance plan; Project number: JL-2014. Project time: 1 October 2020 and 30 September 2022; Project amount: 30000yuan. Second fund project: Major Liaoning Provincial Science and Technology Department Key R and D Program Mentoring Program Project; Project name: Intelligent and optimal control technology for wind power generation based on ultra-short-term state prediction; Project category: Guiding plan for tackling key industrial problems and industrialization; Project number: 2019JH8/10100064. Project time: 1 October 2019 and 30 September 2021.
Conflict of Interest
Author HJ is employed by Shenyang Faleo Technology Co., Ltd.
The remaining authors declare that the research was conducted in the absence of any commercial or financial relationships that could be construed as a potential conflict of interest.
Publisher’s Note
All claims expressed in this article are solely those of the authors and do not necessarily represent those of their affiliated organizations, or those of the publisher, the editors and the reviewers. Any product that may be evaluated in this article, or claim that may be made by its manufacturer, is not guaranteed or endorsed by the publisher.
References
Ao, P., Zhao, S., and Li, Y. (2015). “Speech Emotion Recognition Based on Cat Swarm Optimization Neural Network,” in Digital Technology and Application. Editor S. Motahhir (Berlin, Germany: Springer Nature).
Duan, X., and Li, W. (2021). Prediction of Ultra-short-term Wind Speed Based on Improved Particle Swarm Optimization Neural Network. Automation & Instrumentation 36 (03), 76–80. doi:10.19557/j.cnki.1001-9944.2021.03.017
Fan, J., Shi, J., and Hui, Z. (2020). Research on Wind Power Prediction Based on BP Neural Network. Electr. Technol. 2020 (11), 23–25, 29. doi:10.19768/j.cnki.dgjs.2020.11.007
Fang, J. (2011). “Short-term Wind Speed and Wind Power Prediction Model Research,” (Beijing: Beijing Jiaotong University). Dissertation.
Gao, H., Li, X., Li, Z., Wang, Y., Gao, Y., Tang, W., et al. (2021). The Buildup Factor Calculations of concrete with Different Proportions of CRT Based on a BP Neural Network by MCNP. J. Nucl. Sci. Technol. 58 (6), 667–675. doi:10.1080/00223131.2020.1856733
Huang, B., Yang, J., Lu, S., Chen, H., and Xie, D. (2021). Prediction of Wave Capture Power Based on Improved Particle Swarm Optimization Neural Network Algorithm. Acta Solar Energy Sinica 42 (02), 302–308. doi:10.3969/j.issn.1674-6236.2013.22.028
Liu, S., You, H., Liu, Y., Feng, W., and Fu, S. (2021). Research on Optimal Control Strategy of Wind-Solar Hybrid System Based on Power Prediction. ISA Trans. doi:10.1016/j.isatra.2021.05.010
Liu, Y., Liu, S., Zhang, L., Cao, F., and Wang, L. (2021). Optimization of the Yaw Control Error of Wind Turbine. Front. Energ. Res. 9, 1–10. doi:10.3389/fenrg.2021.626681
Ma, Z., and Shi, Q. (2014). Summary of Cat Swarm Algorithm Research. J. Gansu Radio TV Univ. 2014 (2), 41–45. (in Chinese). doi:10.3969/j.issn.1008-4630.2014.02.011
Sun, H., Zhang, T., He, Q., and Xu, H. (2021). Summary of Key Technologies and Applications of Wind Power Prediction. High Voltage Technol. 47 (04), 1129–1143. doi:10.13336/j.1003-6520.hve.20201780
Tan, Y. (2013). “Research on Grid Connection of Wind-Energy Storage Combined System,” (Beijing: North China Electric Power University). Dissertation.
Wang, D. (2013). Wind Power Prediction Based on BP Neural Network Optimized by Genetic Algorithm. Electron. Eng. Des 21 (22), 95–98. doi:10.3969/j.issn.1674-6236
Wu, W., and Jiang, X. (2014). Wavelet Packet-Fuzzy Control of Hybrid Energy Storage Systems for PV Power Smoothing. Proc. CSEE 34 (03), 317–324. doi:10.13334/j.0258-8013.pcsee.2014.03.001
Yang, J., Zheng, Y., and Ma, L. (2017). Improved Cat Group Algorithm to Solve TSP. Appl. Res. Comput. 34 (12), 3607–3610. (in Chinese). doi:10.3969/j.issn.1001-3695.2017.12.020
Yang, L., Yang, X., and Wu, Y. (2019). Optimal Configuration of Distributed Power Sources Based on Improved Cat Group Algorithm. Power Syst. Prot. Control 47 (1), 95–100. doi:10.7667/PSPC171900
Zhang, D., You, X., and Liu, S. (2020). Dynamic Grouping Ant colony Algorithm Based on Cat colony Algorithm. Computer Sci. exploration 14 (5), 880–891. doi:10.3778/j.issn.1673-9418.1905032
Zhang, L. (2019). “Secondary Frequency Regulation Strategy with Fuzzy Logic Method of the Battery Storage in AGC,” (Hubei, Huna: Hubei University of Technology, Hunan University). [Dissertation].
Zhang, W., and Mao, D. (2019). Wind Farm Power Prediction Based on BP Neural Network Optimized by Particle Swarm Optimization Based on Spectral Clustering Analysis. J. Shanghai Inst. Electr. Eng. 22 (02), 93–99. doi:10.3969/j.issn.2095-0020.2019.02.007
Zhou, Y. (2018). Research on Fuzzy Control Strategy of Energy Storage Battery Participating in AGC Secondary Frequency Modulation. [Dissertation]. Hunan: Hunan University.
Keywords: CSO algorithm, wind power prediction, BP neural network, wind farm energy storage system, suppress wind power fluctuations
Citation: Liu S, Wang L, Jiang H, Liu Y and You H (2022) Wind Farm Energy Storage System Based on Cat Swarm Optimization–Backpropagation Neural Network Wind Power Prediction. Front. Energy Res. 10:850295. doi: 10.3389/fenrg.2022.850295
Received: 07 January 2022; Accepted: 21 February 2022;
Published: 09 March 2022.
Edited by:
Sofiane Khadraoui, University of Sharjah, United Arab EmiratesReviewed by:
Yassine Amirat, ISEN Yncréa Ouest, FranceKenneth E. Okedu, National University of Science and Technology (Muscat), Oman
Copyright © 2022 Liu, Wang, Jiang, Liu and You. This is an open-access article distributed under the terms of the Creative Commons Attribution License (CC BY). The use, distribution or reproduction in other forums is permitted, provided the original author(s) and the copyright owner(s) are credited and that the original publication in this journal is cited, in accordance with accepted academic practice. No use, distribution or reproduction is permitted which does not comply with these terms.
*Correspondence: Shu Liu, bHNfamhsQDE2My5jb20=