- 1School of Electric Power, North China University of Water Resources and Electric Power, Zhengzhou, China
- 2State Grid Henan Electric Power Research Institute, Zhengzhou, China
Based on the classical scenario set, the VPP economic dispatch model is proposed taking into account the uncertainty factors of distributed power sources. The basic model of the VPP is first analyzed, followed by the proposed operation strategy of the VPP based on the basic model, while considering the impact of the time-of-use electricity price on the economics of the VPP. Latin hypercube sampling combined with K-means clustering is used to generate the classical scene set; at the same time, the model is solved using an algorithm that incorporates a genetic mechanism in an improved particle swarm algorithm (PSO). Finally, according to the established model, a calculation example is used to verify. The design is based on two scenarios of the classic scene set and general scene. The optimization configuration results are compared and analyzed. It is confirmed that the VPP optimization configuration under the classic scene set can improve the net income of the VPP.
Introduction
The rapid development of technologies that rely on natural energy sources has led to massive consumption of fossil energy. In this regard, many solutions have been proposed to mitigate phenomena such as air pollution and global warming. The concept of the VPP (virtual power plant) was developed. The VPP can provide an effective means of managing distributed generation (DG) at a time when distributed energy is growing rapidly. At present, there is no authoritative definition of the VPP, and most people accept the concept that it uses advanced control, communication, and computing technologies in a distributed network where different types of distributed energy sources can be aggregated and further distribute energy so that these DGs can operate as a whole, while also effectively mitigating the instability of distributed energy sources.
The VPP has been studied in great depth in many literatures. The concept of the responsive VPP was first introduced in the literature (Department Of Energy (, 2006)) during the theoretical exploration and proof stage; relying on the different ways of achieving the response, two working models of the VPP were proposed: incentive-based power plant models and lump sum–based power plant models, and these were verified through calculation examples. A comprehensive account of the VPP is presented in the literature (Xia and Liu, 2016; Lin, 2017; Gong, 2018; Li et al., 2021). Hong et al., 2017; Wang, 2017; Yuan, 2017; Wen and Guoen, 2019; Liu et al., 2020; Yang et al., 2020 investigate the problem regarding the management of renewable energy sources in the grid, which considers the VPP to be able to integrate distributed energy sources optimally. In the literature (Pudjianto et al., 2007; Zhou and Lin, 2019), distributed energy sources, such as CHP units, are aggregated to form a VPP to participate in market trading and realize a VPP model for distributed energy sources, such as energy storage and demand response. You et al., (2009) consider the uncertainty of power market prices and new energy generation, such as wind and PV consider both controllable and uncontrollable distributed power sources; and propose a day-ahead bidding strategy for the VPP with the goal of maximizing economic efficiency. Yuan et al., (2016) investigate the economic efficiency of the VPP based on particle swarm optimization (PSO) algorithms, taking into account time-of-use electricity prices. The strategies proposed in the literature (Soltani et al., 2012) consider the effect of reliability and determine the optimal hourly operating strategy for DERs by Monte Carlo simulation methods. However, these scheduling strategies are proposed based on deterministic market prices.
As the role played by the VPP in the power system increases in proportion, the issue of operating and scheduling the VPP is a problem we must face. The abovementioned literatures summarize the VPP and even propose a day-ahead bidding strategy for the VPP, but the VPP contains a large number of distributed power sources, which have uncertainty in their power output, and currently in the power system, to offset the uncertainty in the system, the method of the reserved rotating reserve is usually used as carried out by Yi and Li, (2018); the so-called reserved rotating reserve method is applied to reduce the error by compensating the prediction error at a certain confidence level by a certain rotating reserve capacity. Robust optimization methods are generally used to deal with uncertainty in the model; however, although robust optimization methods are good, but the results are often conservative and extreme. Stochastic optimization methods based on scenario sets are generally used to deal with uncertainty in models by discretizing a continuous problem into a finite number of scenarios with certain probabilities and then finding the optimal expectation, often including the generation of multiple scenarios and decimation of scenarios to derive classical scenario sets such as those obtained by Zhinong et al., (2018). In the literature (Liu, 2018), a Markov chain-based PV ultrashort-term prediction model was constructed for historical PV data; the relationship between PV curve description quantity characteristics and collection granularity was investigated; the main evaluation indexes reflecting the continuous fluctuation characteristics of PV power were extracted according to the PV power change state, and a multiobjective optimization–based PV power collection granularity calibration model was established. In the literature (Liu et al., 2021), a two-level collaborative optimal scheduling model for the VPP considering carbon neutral benefits was proposed to further enhance the adaptability and accuracy of the model under a carbon neutral layout by considering carbon emissions and carbon neutrality in a multitime-scale optimal scheduling model for the VPP to fill the gap of VPP optimal scheduling in the field of carbon emissions. In the literature (Wei et al., 2015; Zhao and Fan, 2019a; Gao, 2019), a double-layer optimal dispatching model of the VPP based on time-of-use electricity prices was proposed, and the study showed that the VPP based on time-of-use electricity prices can maximize the revenue to enhance the level of new energy consumption and ensure the balance of supply and demand in the region. Lin et al., (2021) used the stochastic optimization and adaptive robust optimization methods to model the uncertainty of electricity price, wind power output, and demand response and then linearized the model formulation based on the engineering game idea to establish a two-stage, three-level day-ahead dispatch model. The optimal solution is obtained by the PSO algorithm, and it is verified that this model can effectively improve the economy and safety of VPP operation.
The VPP is proposed to integrate various distributed power sources, controllable loads, and energy storage devices, etc., and gather various distributed power sources together to form a whole through advanced communication technology to participate in the operation and dispatch of the grid in a unified manner. The control of the VPP is divided into two types: decentralized control and centralized control. However, a new distributed coordination controller proposed in the literature (Sun et al., 2015), combined with a multi–intelligence-based consensus algorithm, is applied to the distributed generators of the energy Internet, which can maintain the consistency of electrical angles and amplitudes between the energy Internet and MG. In the second part of the article, a control architecture based on a multi-intelligence system is proposed to describe the information exchange between different parts.
Translated with www.DeepL.com/Translator (free version). In the previous studies of optimal scheduling of the VPP, they all gave priority to the use of traditional power generation methods with lower generation costs in order to maximize benefits, while ignoring the consumption of new energy sources, such as wind power and photovoltaics, resulting in the waste of new energy generation costs, which actually undermines the ultimate benefits of the VPP. The study establishes an optimal configuration model of the VPP. First, the basic mathematical model of the VPP is analyzed, followed by the uncertainty factors in the VPP using Latin hypercube sampling and K-means clustering to form a classical scenario set. Then, the objective function is to maximize the net revenue of the VPP, and the constraints are considered to establish the optimal configuration model of the VPP consisting of wind power, photovoltaic power generation, energy storage system, and gas turbine, and finally, the algorithm of adding genetic mechanism to the improved PSO algorithm is used to solve the model. In addition, a VPP operation strategy is proposed, which takes into account the economy of the VPP according to the time-of-use electricity price. The rationality and effectiveness of this strategy are verified by examples.
Generation of Classic Scene Sets
Latin Hypercube Sampling to Form Multiple Scenes
Latin hypercube sampling is a method proposed by M. D. McKay, R. J. Beckman, and W. J. Conover in 1979, which can effectively use the distribution of sample response random variables (McKay et al., 2012). Latin hypercube sampling is a typical stratified sampling, and for all sampling areas, this sampling method can be used to cover a smaller and unduplicated sample. The sampling is performed by the following steps:
1) Dividing the sample into equal intervals on the cumulative probability scale 0 to 1.
Let the random variable A be the object of our study and its probability distribution function be
Let B be the number of samples, and then the vertical axis of
2) Generate random numbers in each interval.
A random number u is generated in the interval shown in Equation 2 and u is a random variable adhering to uniform distribution on the interval (0, 1); then, a random number
3) Inverted conversion generates the sampled values.
The sampled values are calculated by the inverse function as follows:
The specified B sample values can be obtained by the abovementioned steps.
Yang et al., (2013) studied the distributed wind power output using a two-parameter Will distribution, and Zhou et al., (2016) studied the distributed PV using a
K-Means Clustering Reduction Scenario
K-means clustering minimizes the sum of squares of the Euclidean distance between each sampled point and its nearest clustering center. K-means first selects the initial cluster centers randomly or manually and then divides the data set into several clusters (a data point belongs to the cluster whose cluster center is closest to the data point) and calculates the mean of the clusters as the cluster centers. K-means repeatedly updates the clustering centers and clusters until convergence. The main distance metrics are Manhattan distance, Euclidean distance, Marxian distance, Chebyshev distance, and other methods.
The set of samples
In Eq. 5,
Virtual Power Plant Economic Model
Objective Function
The objective function is to maximize the net income of the VPP, in which the income first mainly includes the income of wind power generation and photovoltaic power generation, which are distributed power sources to supply the load, followed by the income of the difference between charging and discharging of energy storage batteries, while considering the income generated by gas turbine auxiliary power generation, and the income of the difference between the income earned by the VPP from the sale of electricity to the grid and the cost of electricity purchased by the VPP from the grid; the three main sources of costs are operation and management costs, energy consumption costs, and penalty costs.
In Eq. 6, F represents the net income of the VPP, N represents the number of classic scene sets,
In Eq. 7,t represents time series,
In the formula,
In Eq. 12,
The VPP declares its planned contribution to the grid:
In Eq. 13,
Constraints
1) Power balance constraint
In Eq. 14,
2) Gas turbine constraints
In Eq. 15,
3) Gas turbine climb rate constraint
In Eq. 16,
4) Battery capacity constraints of energy storage systems
The energy storage system must comply with the law of conservation of energy in the process of dispatching, that is, the electrical energy stored now is equal to the sum of the electrical energy stored in the previous moment and the charging and discharging energy in the process of two moments, which is as follows:
At the same time, Eq. 18 must be satisfied:
In Eq. 18,
5) Charging and discharging constraints of energy storage batteries
In the abovementioned formula,
Virtual Power Plant Operation Strategy Based on Time-Of-Use Electricity Price
1) The form of interaction between the VPP and grid
Based on the existence of time-of-use electricity price, there are three main aspects of the interaction between the VPP and grid:
1) If the price of electricity is at peak hours at this time, the energy storage and gas turbines in the VPP will sell all the excess power to the grid to earn benefits under the condition that the load demand is met;
2) If the price of electricity is in the usual period, the distributed power source will be powered first, followed by the energy storage system, and the gas turbine will decide whether to power up by comparing the cost of power generation with the grid price;
3) If the price of electricity is in the valley, the cost of gas turbine power generation is lower than the price of grid electricity, and the gas turbine does not produce power, the VPP to purchase electricity from the grid, part of the load, another part of the power stored in the storage system, to be sold at the right time to earn the difference in price.
2) VPP operation strategy
The operation strategy of the VPP mainly considers the power output of distributed power sources, such as wind power and photovoltaic power, the power output of energy storage systems, and the power output of gas turbines.
Distributed power output: wind power and photovoltaic power generation as new energy; the VPP within its capacity to achieve priority utilization. When the output of the distributed power is greater than the load demand, all the load demand will come from the distributed power, and the remaining power will be stored in the energy storage system or sold to the grid according to the time-sharing tariff; when the output of distributed power is less than the load demand, all the output of distributed power will be used for the load demand.
The output of the energy storage system: The VPP gives priority to the power output from distributed power sources. If the distributed power sources cannot meet the load demand, the energy storage system will be discharged, and if there is a supply of distributed power sources that exceeds the demand, the energy storage system will be charged and discharged at the right time.
Gas turbine output: The gas turbine plays an auxiliary role in the VPP as a controllable load, ensuring that it functions when distributed power sources, energy storage, etc. are not available to generate power to supply the load, storage, and the grid. Whether or not the gas turbine is powered depends on the demand of the load and its cost of power generation compared to the grid tariff, and then the decision is made whether or not to power it.
Model Solving Algorithm
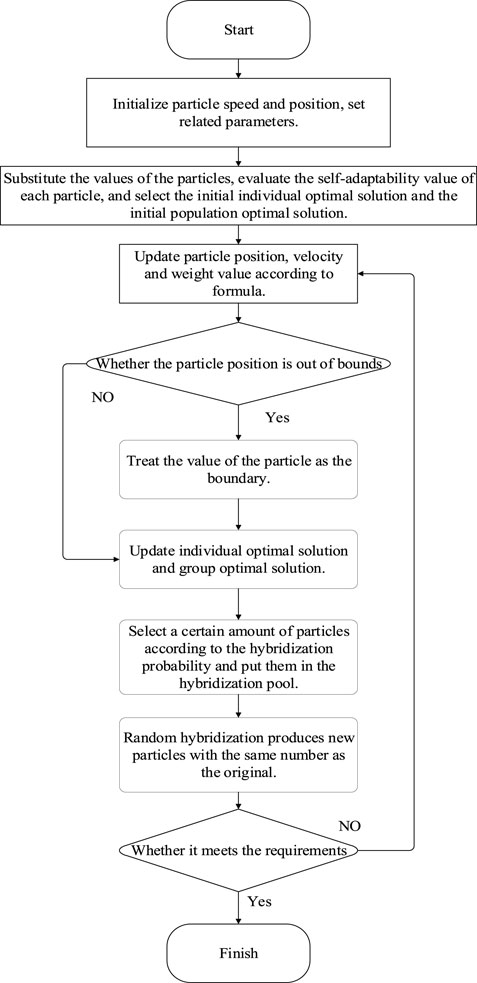
In view of the shortcomings, such as the basic particle swarm being prone to fall into local optimum, a new improved PSO algorithm is proposed based on the basic PSO algorithm. The following improvements are made relative to the basic PSO algorithm:
The adaptive weight calculation formula is set as follows:
In Eq. 22:
In the formula, n is the current iteration number; f is the real-time objective function of the particle,;
To enhance the global search capability of the algorithm, the concept of hybridization in genetic algorithms is added to the PSO algorithm (Lu et al., 2020). Suppose there is an existing hybridization pool, a certain number of particles is added in this pool, and then the particles in the pool are allowed to hybridize, which will generate a certain number of particles; let that number be the same as the original particles, and at the same time, the original particles are replaced with the newly generated particles so that the global search ability of the algorithm can be enhanced.
The positions and velocities of the new particles are obtained by crossing the positions of the original particles:
In the abovementioned formula, nx indicates the position of the new particle, mx indicates the position of the original particle; i is a uniform random number between 0 and 1, nv represents the velocity of the new particle, and mv represents the velocity of the original particle.
The flow chart of the improved PSO is shown in Figure 1.
Simulation Example
Calculation Example Settings
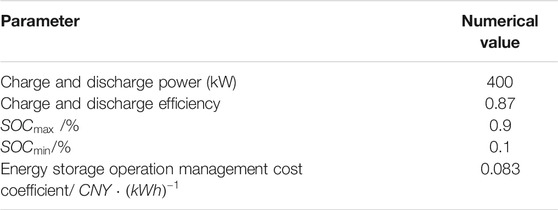
In order to verify the feasibility of the abovementioned VPP energy storage system optimization configuration and algorithm, a VPP containing 1000 kW of wind power, 1000 kW of photovoltaic power, and 400 kW of gas turbine and an energy storage system with a rated capacity of 1600 kWh were selected. All the data in this study and the final results are derived on the Matlab simulation platform. Specific parameter information is shown in Tables 1, 2, 3, 4.
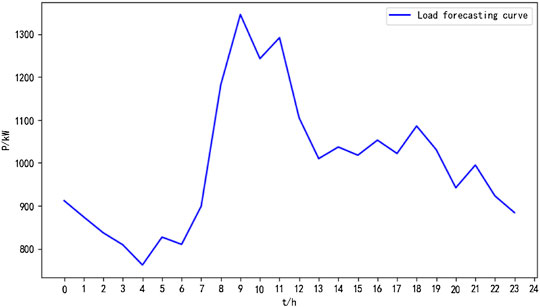
The time-sharing electricity price is selected as the reference (Zhao and Fan, 2019b) for each distributed energy operation and management cost factor for non-summer industrial, commercial, and other electricity consumption in Shanghai. In this study, a typical daily load curve of a location is selected as the load forecast, and the results are shown in Figure 2.
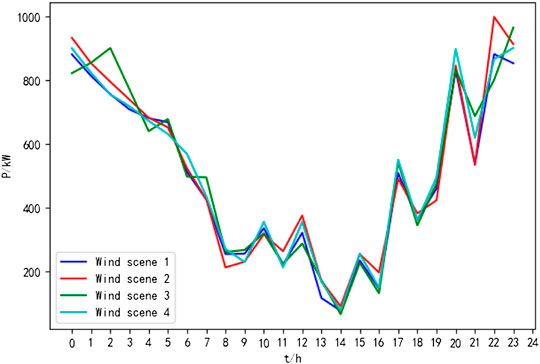
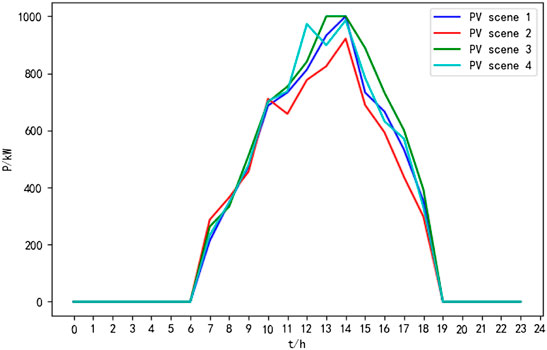
Based on the historical data, the abovementioned Latin hypercube sampling is used to generate scenes and K-means clustering is used to reduce the scenes. In this study, the number of classical scenes of wind power output and PV power output is predetermined to be four each, so there are 4 × 4 scenes in the classical scene set. The results are shown in Figure 3 and Figure 4. The probability of each scene is shown in Table 5 and Table 6.
Simulation Results and Analysis
Running the developed model and solving it by an improved PSO algorithm, the net benefits of the VPP under different scenarios are shown in Table 7.
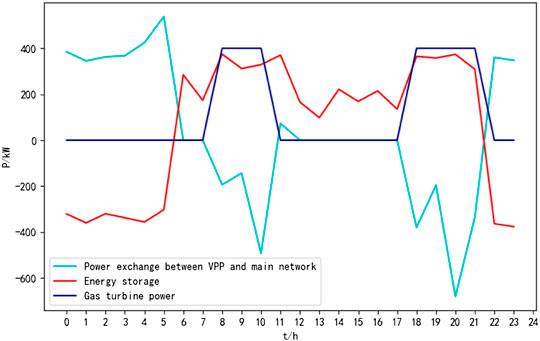
Running the developed model, the net revenue and the output of each component of the virtual power plant under the influence of the time-sharing tariff for Scenario 1 can be obtained, as shown in Figure 5.
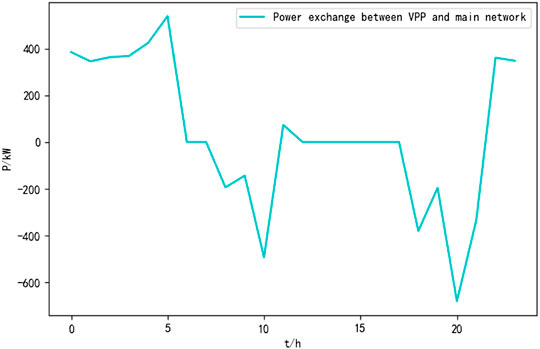
It can be seen from Figure 6 that during the time period 22:00–6:00 of the following day, the VPP has maintained the purchase of electricity from the grid mainly due to the fact that the price of electricity at this time is in the valley hours; during the time period 6:00–7:00, the electricity price is in the usual period, and the VPP does not interact with the grid for power; during the time period 8:00–11:00, when electricity prices are at their peak and trough, the VPP makes a profit by selling electricity to the grid while ensuring the demand of the load; during the period 11:00–18:00, the electricity is in the usual period, and the VPP does not interact with the grid for power; in the time period 18:00–22:00, when the electricity price is in the peak and valley hours, the VPP sells electricity to the grid to earn the difference but purchases electricity from the grid around 20:00, which is due to the fact that PV power generation almost stops at this time, and the distributed power and gas turbine output still cannot guarantee the demand of the load, so the power needs to be purchased from the grid; then 22:00 enters the valley hours and the VPP purchases electricity from the grid.
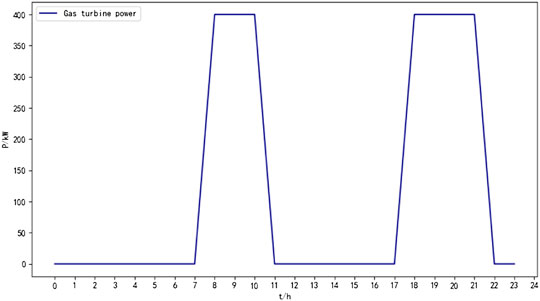
From Figure 7, we can see that when the grid electricity price is at 22:00–6:00 the next day, the gas turbine does not generate electricity because the electricity price of the VPP from the grid is lower than the generation cost of the gas turbine; while the electricity price is at peak hours, the grid electricity price is higher than the generation cost of the gas turbine and the gas turbine generates electricity at almost full capacity and sells the electricity to the grid after satisfying the load demand, thus gaining benefits, when at the time 11:00–18:00. Although the electricity price is at normal hours, the distributed power supply and energy storage system can meet the load demand, and the gas turbine does not generate electricity at this time.
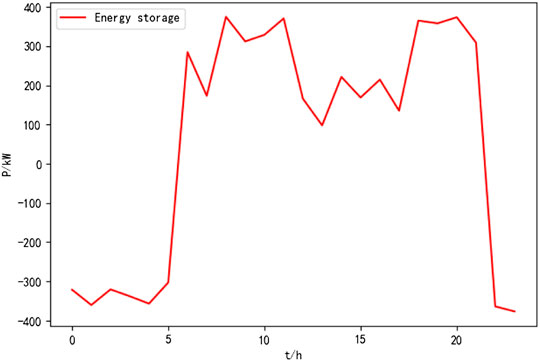
From Figure 8 we can see that when the electricity price is at 22:00–6:00 the next day, the energy storage system is in the charging state, and when the time period reaches 8:00–11:00, the energy storage system is in the discharging state, which is due to the fact that the energy storage system sells the electricity stored in the valley hours to the grid under the premise of ensuring normal operation of the load, and thus earning the difference in price in the time period of 12:00–22:00. In the time period of 12:00–22:00, the electricity price is in the normal or peak period, and under the premise of satisfying the load demand, the energy storage will sell the excess power to the grid to earn the price difference, and then when entering the valley hours, the VPP purchases power from the grid and stores it in the energy storage system.
Conclusion
A VPP optimization model based on the classical scenario set is simulated and analyzed for specific arithmetic cases. Two different scenarios are set up for the optimal configuration, and the net benefits and output of each component are obtained for different cases. The effectiveness of the improved PSO algorithm is verified by solving the developed model with the improved PSO algorithm incorporating genetic mechanism. Finally, by comparing the net returns under different scenarios, it is verified that the optimal configuration of the VPP under the classical scenario set can significantly improve the net returns of the VPP.
Outlook: In recent years, with the popularity of electric vehicles, more uncertainties have been added to the VPP. Electric vehicles can be seen as a mobile power source, and their charging and discharging are highly random and have a greater relationship with human factors. At present, countries around the world are reducing carbon emissions, and in the future, considering electric vehicle access to the VPP, taking into account the economy and environmental protection (carbon emissions) of the VPP will be the focus of our research.
Data Availability Statement
The raw data supporting the conclusion of this article will be made available by the authors, without undue reservation.
Author Contributions
CW and WS completed the model building of the VPP and the simulation and reduction of wind power photovoltaic output scenarios. WS completed the debugging of the algorithm. MC completed the drawing of the graph. XM read the manuscript and corrected the grammatical errors.
Funding
This study was supported by the Key Scientific Research Projects Plan of Henan Higher Education Institutions under Grant Number 19A470006 and the cultivation plan of young backbone teachers in colleges and universities of Henan Province under Grant Number 2019GGJS104.
Conflict of Interest
The authors declare that the research was conducted in the absence of any commercial or financial relationships that could be construed as a potential conflict of interest.
Publisher’s Note
All claims expressed in this article are solely those of the authors and do not necessarily represent those of their affiliated organizations, or those of the publisher, the editors, and the reviewers. Any product that may be evaluated in this article, or claim that may be made by its manufacturer, is not guaranteed or endorsed by the publisher.
References
Cui, H., Guo, Y., and Xia, C. (2010). Research on Optimal Configuration of Distributed Power Generation Considering Environmental Benefits[J]. East China Electric Power 38 (12), 1968–1971.
Gao, Z. (2019). Research on Bidding Strategy and Coordinated Dispatching of VPP with Multiple Distributed Energy sources[D]. Shanghai: Shanghai Jiaotong University.
Gong, C. (2018). Research on Optimal Scheduling of VPP Group Considering Uncertainty Factors and Complementarity of Deviation Electricity[D]. Changsha: Changsha University of Science and Technology.
Hong, B., Li, Q., and He, Y. (2017). Etc. Application and prospect of VPP in Distributed Photovoltaic Power Generation Application Demonstration Area[J]. Electric Power Construction 38 (09), 32–37.
Li, Z., Liu, X., Ni, C., Ge, X., and Wu, H. (2021). Study on Optimal Configuration of Energy Storage System in VPP Based on Scenario Set[J]. Electr. Drive 51 (16), 65–71.
Lin, W. (2017). Research on Coordinated Control Strategy of Multiple Distributed Energy Sources under VPP[D]. Huaqiao: Huaqiao University.
Lin, Y., Miao, S., Yang, W., Yin, B., Tu, Q., and Chang, Y. (2021). A Day-Ahead Optimal Scheduling Strategy for VPP Facing Multiple Uncertain Environments[J/OL]. Power Automation Equipment, 1–8.
Liu, C., Pang, P., Shi, W., Shen, J., Sun, Y., and Bao, H. (2021). Double-layer Collaborative Optimal Scheduling of VPP in Consideration of Carbon Neutralization Benefits and Clean Energy Consumption[J]. Power Supply 38 (09), 19–27.
Liu, D. (2018). Economical Optimal Dispatch of VPP Considering Distributed Photovoltaic Power generation[D]. Beijing): North China Electric Power University.
Liu, D., Fan, Q., You, H., Dai, X., Huang, Y., and Shao, Z. (2020). Research Status and Prospects of VPP under Ubiquitous Power Internet of Things[J]. Eng. Sci. Tech. 52 (04), 3–12.
Lu, G., Ou, Y., and Du, S. (2020). Research on the Internal Reactive Power Optimization of Wind Farms Based on Improved HPSO Algorithm[J]. Electr. Meas. Instrumentation 57 (10), 36–42.
McKay, M. D., Beckman, R. J., and Conover, W. J. (2012). in A comparison of Three Methods for Selecting Values of Input Variables in the Analysis of Output from a Computer Code: proceedings of the 37 th conference on winter simulation[J] (Alexandria, VA: American Statistical Association), 42202–42208.1.
Pudjianto, D., Ramsay, C., and Strbac, G. (2007). Virtual Power Plant and System Integration of Distributed Energy Resources. IET Renew. Power Gener. 1 (1), 10–16. doi:10.1049/iet-rpg:20060023
Soltani, M., Raoofat, N., and Rostami, M. A. (2012). “Optima L Reliable Strategy of Virt Tual Power Plant in Energy and Frequen Cy Control Markets[C],” in Electrical Power Distri bution Networks,2012 Proceedings of 17th Conference on.IE] EE, 1–6.
Sun, Q., Han, R., Zhang, H., Zhou, J., and Guerrero, J. M. (2015). A Multiagent-Based Consensus Algorithm for Distributed Coordinated Control of Distributed Generators in the Energy Internet. IEEE Trans. Smart Grid 6 (6), 3006–3019. Nov. 2015. doi:10.1109/TSG.2015.2412779
US Department Of Energy (2006). Benefits of Demand Response in Electricity Markets and Recommendations for Achieving them[R]. Washington DC, USA: US Department of Energy.
Wang, Yao. (2017). Research on VPP in Distributed Power Dispatching Management Mode[J]. Shandong Ind. Tech. (11), 208.
Wei, L., Bo, Z., and Hongbin, W. U. (2015). Optimal allocatic on model of energy storag e system in VPP envi ironment with a high pen etration of distributed pl hotovoltaic Generation[J]. Automatio n of Electric Power Systen 1s (23), 66–74.
Wen, X., and Guoen, W. (2019). Etc. Research on the Application of VPP in Distributed Photovoltaic Power Generation[J]. Electr. Tech. Econ. (04), 62–64.
Xia, Y., and Liu, J. (2016). Summary of Research on VPP Based on Distributed Generation[J]. Electric Power Automation Equipment 36 (4), 100–106.
Yang, N., Wang, B., Liu, D., Zhao, J., and Wang, H. (2013). An Integrated Supply-Demand Stochastic Optimization Method Considering Large-Scale Wind Power and Flexible Load [J]. Proc. CSEE 33 (26), 63–69. (in Chinese).
Yang, X., Tao, X., and Han, Li. (2020). The Status Quo and Prospects of VPP Technology[J]. Huadian Tech. 42 (05), 73–78.
Yi, Z., and Li, Z. (2018). Hot Spot Joint Dispatch Strategy Taking into Account the thermal Inertia of Heat Storage and Heating Area in Heating Network[J]. Power Syst. Tech. 42 (5), 1378–1384.
You, S., Traeholt, C., and Poulsen, B. (2009). in A market-based VPP[C]//International Conference on Clean Electrical Power (IEEE), 460–465.
Yuan, G., Chen, S., Liu, Y., and Fang, F. (2016). The Economical Optimal Dispatch of VPP Based on Time-Of-Use Electricity Prices[J]. Power Syst. Tech. 40 (03), 826–832.
Zhao, F., and Fan, Y. (2019). Double-level Optimal Dispatch of Multi-Energy VPP under the Influence of Time-Of-Use Electricity Prices[J]. Power Syst. Prot. Control 47 (20), 33–40.
Zhao, F., and Fan, Y. (2019). Dual-level Optimal Dispatch of Multi-Energy VPP under the Influence of Time-Of-Use Electricity Prices[J]. Power Syst. Prot. Control 47 (20), 62–73.
Zhinong, W., Chen, Y., Huang, W., Zheng, X., and Sun, G. (2018). Etc. VPP Multi-Power Capacity Optimization Configuration Model Considering Conditional value-at-Risk[J]. Automation Electric Power Syst. 42 (04), 39–46.
Zhou, B., and Lin, L. (2019). Research on VPP Trading Strategy Considering Combined Heat and Power Dispatch[J]. Electr. Meas. Instrumentation 59 (10), 75–81.
Keywords: VPP (virtual power plant), Latin hypercube sampling, K-means clustering, economic analysis, improved particle swarm optimization
Citation: Wensi C, Shuo W, Chao M and Mingming X (2022) Research on Optimal Scheduling of VPP Based on Latin Hypercube Sampling and K-Means Clustering. Front. Energy Res. 10:848805. doi: 10.3389/fenrg.2022.848805
Received: 05 January 2022; Accepted: 23 February 2022;
Published: 16 March 2022.
Edited by:
Rui Wang, Northeastern University, ChinaCopyright © 2022 Wensi, Shuo, Chao and Mingming. This is an open-access article distributed under the terms of the Creative Commons Attribution License (CC BY). The use, distribution or reproduction in other forums is permitted, provided the original author(s) and the copyright owner(s) are credited and that the original publication in this journal is cited, in accordance with accepted academic practice. No use, distribution or reproduction is permitted which does not comply with these terms.
*Correspondence: Wang Shuo, MjA0MzY3NjMwN0BxcS5jb20=
 Cao Wensi1
 Wang Shuo