 Jiajia Liu
 Yang Zhang
 Shouqi Chen1
 Zishuo Nie
 Di Yang
94% of researchers rate our articles as excellent or good
Learn more about the work of our research integrity team to safeguard the quality of each article we publish.
Find out more
ORIGINAL RESEARCH article
Front. Energy Res. , 01 March 2022
Sec. Sustainable Energy Systems
Volume 10 - 2022 | https://doi.org/10.3389/fenrg.2022.846500
This article is part of the Research Topic Thermal Safety Research on Development and Utilization of Renewable Energy View all 6 articles
In ventilation working face, different ventilation way is one of the important factors affecting the propagation of gas explosion shock wave. In order to study the gas explosion shock wave propagation laws in coal mining faces with different ventilation methods, using Fluent simulation software, combined with pipeline gas explosion experiments and the actual situation of gas accumulation area explosion in the corner of 415 coal face in Chenjiashan coal mine, Shaanxi Province, and on the basis of building a three-dimensional mathematical and physical model, the gas explosion simulations under Y-type and W-type ventilation methods were carried out, respectively. The results are described as follows: (1) The attenuation trend of overpressure peak value of inlet roadway 1 and working face with Y-type ventilation conforms to the power function form. Intake airway 2 and return airway have the same peak overpressure attenuation trend, but the peak value of overpressure in return airway is generally 10.6% higher than that in intake airway 2, and its attenuation rate is a process from low to high and then to low. (2) The peak attenuation trend of overpressure in intake airways 1 and 2 with W-type ventilation conforms to the form of power function, and the peak attenuation trend of overpressure in return airway conforms to the form of exponential function. The peak value of overpressure decreases with the increase in the distance from the explosion source, and its attenuation rate decreases gradually. The research results have important theoretical significance for improving the prevention of gas explosion in coal mining face with different ventilation modes.
Coal mine is an extremely important link in China’s energy structure and has always occupied a very important position (Ding et al., 2020). When gas explosion accidents occur underground, high temperature, shock waves, and harmful gases are often generated, resulting in serious casualties, damage to equipment and ventilation facilities, and roadway collapse. From 2018 to 2020, a total of 517 accidents and 877 deaths occurred in China’s coal mines. Coal mine safety has always been a top priority in national work safety because of the complex occurrence conditions of coal seams, the high proportion of mining, and the imbalance between mining technology and management development (Zhu, 2021). At present, gas explosion accidents in coal mines in China are one of the most serious disasters (Xue, 2019). Therefore, it is very important to study the propagation law of gas explosion shock wave. At present, many domestic and foreign scholars have done a lot of research on the propagation law of gas explosion shock wave. For example, Wang and Du (2021) conducted gas explosion tests under different bifurcation angles and initial overpressure conditions, respectively, and systematically studied the propagation rules of shock waves generated by gas explosion in different ventilation pipe networks. Wang et al. (2015) and Wang et al. (2017) studied the distribution and propagation of gas explosion shock waves in the pipeline model. Qiu (2018) used a combination of theoretical analyses, experiments, and numerical simulations to study the propagation characteristics and attenuation laws of gas explosion shock waves in straight, bend, bifurcated, and abrupt cross-section pipelines; a-type networks; and parallel networks, and on this basis, the process of gas explosion disaster simulation system is developed, and a coal mine in our country was studied because of gas explosion accident cases to verify the application effect of the simulation system. Li et al. (2011) simulated the ignition and propagation characteristics of gas explosion by introducing basic chemical reactions. Zhu et al. (2012) studied the oscillation characteristics and variation rules of characteristic parameters of gas explosion in a pipeline, and gas explosion in a closed system showed obvious oscillation characteristics. Zhu and Ye (2019) used the fluid–solid coupling algorithm of ANSYS/LS-DYNA program and established a roadway gas explosion physical model, numerically simulated the gas explosion process in the roadway space, and studied the gas explosion shock wave in the roadway space propagation characteristics.
Kravtsov et al. (2015) studied the propagation law and dynamic response characteristics of methane gas explosion inside the pipeline and concluded that because of the variability of the medium, changes in the explosion process depend on turbulence factors. Ibrahim and Masri (2001) discussed the influence of different types of obstacles on shock wave propagation and proved that obstacles can aggravate the propagation of shock wave. Masri et al. (2000) qualitatively analyzed the attenuation law of shock waves in straight roadway and summarized the propagation characteristics of shock waves in straight roadway. Shao et al. (2015) found through experiments that under any vacuum condition, the vacuum chamber can effectively suppress explosive flame and overpressure. Zhao and Qi (2018) using L-shaped, T-shaped, and cross-shaped test pipelines to simulate underground roadway structures and a gas combustion explosion test system to conduct gas explosion simulation tests to monitor pressure values at different locations in the pipeline, explored the propagation law of gas explosion shock wave in different types of pipelines, and obtained the pressure variation law of gas explosion shock wave in different types of pipelines before and after turning and bifurcation structure. Jia and Xu (2015) analyzed the influence of overpressure and bifurcation angle before bifurcation of a one-way bifurcation pipeline on propagation of gas explosion shock wave in the pipeline. Wu et al. (2005) started from the three-dimensional N-S equation and used the TVD format to numerically simulate the process of pressure waves generated by the flame in the process of gas explosion. Ye et al. (2009) conducted theoretical and experimental studies on the propagation law of flame and shock wave in curves. Gieras et al. (2006) found in their study that initial temperature has an important influence on the basic parameters of explosion. Yan et al. (2011) carried out numerical simulation on the variation rule of precursor wave front and flame wave front by using Fluent software for fluid dynamics analysis and conducted numerical simulation analysis on the overpressure transfer rule in different types of roadway gas explosion.
At present, domestic and foreign scholars have studied the propagation law of gas explosion shock wave in coal mining face mainly for the U-type ventilation mode, but there are few studies on the propagation law of gas explosion shock wave in Y and W ventilation modes, and there are still gaps. Therefore, in this article, combined with the case of the 11.28 gas explosion accident in Chenjiashan Coal Mine in Shaanxi Province, fluid dynamics simulation software Fluent was used to build a three-dimensional mathematical physical model, set reasonable boundaries and initial conditions, study the propagation law of the gas explosion shock wave in coal mining face with Y-type and W-type ventilation mode, and further study and master the difference of propagation law of gas explosion shock wave in coal mining face under different ventilation modes. The research results have important guiding significance for improving the level of mine safety production and reducing the damage caused by gas explosion.
A reasonable mathematical and physical model is very important for the reliability of experimental results, and reasonable boundary conditions and initial conditions and other key parameters should be determined before numerical simulation. Combined with the actual situation of gas accumulation area explosion in a corner of 415 coal face in Chenjiashan coal mine, Shaanxi Province, the effective length of intake and return airway was determined, and the numerical simulation software Fluent was used to carry out the numerical simulation study of gas accumulation area explosion in Y- and W-type ventilation roadway with different cross-section shapes. The specific mathematical and physical models are determined as follows:
Gas explosion is a very complex fluid elastic–plastic process, accompanied by chemical reaction, turbulence changes, and other phenomena, so it is difficult to study the propagation law of mine gas explosion considering all the conditions. In order to ensure the reliability of gas explosion numerical simulation as far as possible, some basic assumptions must be made (Liu et al., 2020): (1) Both premixed gas and combustion products satisfy the ideal gas state equation; (2) the specific heat capacity of the mixed gas follows the mixing rule, and the specific heat capacity of each component is a function of temperature; (3) the wall of the physical model is a rigid adiabatic wall, which does not produce relative displacement; (4) the gas explosion reaction is one-way and irreversible; and (5) in the physical model, the gas-filling area is a normal uniform mixture of gas and air, and it is an ideal state.
The model parameters and boundary conditions of gas explosion numerical simulation are as follows: The boundary conditions: the pipe boundary is set as the adiabatic wall with the temperature of 300 K, and the outlet above the vertical pipe is set as the pressure outlet.
Basic model parameter: the initial conditions of the burned zone are as follows: T = 1,600 K, H2O volume fraction is 0.118, CO2 volume fraction is 0.145, and initial pressure is 101,325 Pa. The initial conditions of unburned zone are as follows: T = 300 K, CH4 volume fraction is 0.053, O2 volume fraction is 0.21, H2O and CO2 volume fraction is 0. The initial conditions of the air zone are as follows: the volume fraction of CH4, H2O and CO2 is 0, and the volume fraction of O2 is 0.233.
The Y-type ventilation method means that there is an intake airway at the upper and lower ends of the coal mining face and a return air roadway on each side of the gob. Research of Y-type ventilation type gas explosion shock wave propagation law, three into or return air roadway length of 40 m, tilted face length of 175 m, models the overall grid size of 0.5 m; according to the analysis and identification report of Chenjiashan Coal Mine gas explosion accident, the volume fractions of CH4 and O2 in the gas accumulation area are 0.095 and 0.212, respectively. The burned area is a spherical area with a radius of 0.5 m in the center of the gas accumulation area, in which the volume fraction of CO2 is 0.1456, and the volume fraction of H2O is 0.11925. The grid of gas-filling area and ignition area was refined by local grid encryption technology. The gas-filling area was infilled once. The ignition area was encrypted twice. The three-dimensional physical model of Y-type ventilation is shown in Figure 1. Intake airway 1, intake airway 2, and return airway. The gas accumulation area of Y-type ventilation is located at the corner of working face and return airway; after one encryption, the grid number of the gas accumulation area is 6,768, and the grid number of the ignition area is 226.
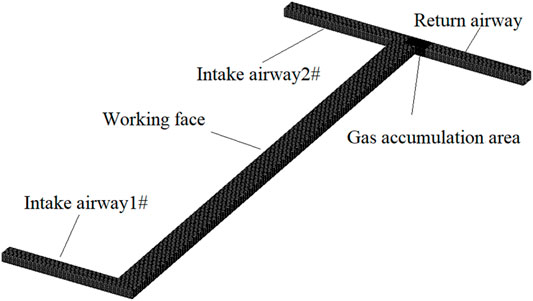
FIGURE 1. Three-dimensional physical model of Y-type ventilation.
In the W-type ventilation mode, there are three roadways, and two mining faces share one return airway, which is the same as the Y-type ventilation mode. The length of the roadway is 40 m, the inclined length of the working face is 175 m, and the overall mesh size of the model is 0.5 m. The three-dimensional physical model of W-type ventilation is shown in Figure 2. Intake airway 1 and intake airway 2 enter air simultaneously and return airway returns air. The W-type ventilation mode is different from the Y-type ventilation mode, according to the analysis and identification report of Chen Jiashan Coal Mine gas explosion accident, and the volume fractions of CH4 and O2 in the gas accumulation area are 0.095 and 0.212, respectively. The burned area is a spherical area with a radius of 0.5 m in the center of the gas accumulation area, in which the volume fraction of CO2 is 0.1456, the volume fraction of H2O is 0.11925, and the gas accumulation area is located in the middle of the working face. After one encryption, the grid number of the gas accumulation area is 8,978, and the grid number of the ignition area is 244.
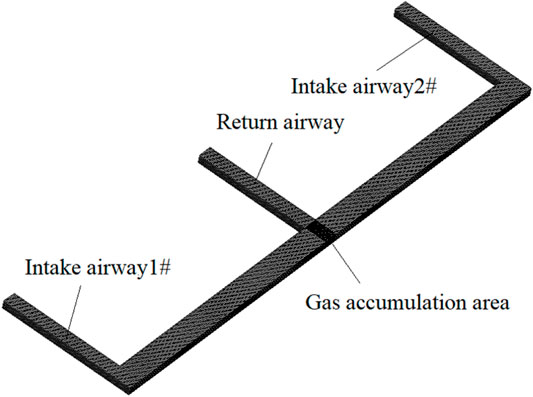
FIGURE 2. Three-dimensional physical model of W-type ventilation.
Air inlet and return air outlet are set as pressure outlet, and others are standard wall; According to the analysis and identification report of Chenjiashan coal mine gas explosion accident, the volume fractions of CH4 and O2 in the gas accumulation area are 0.095 and 0.212, respectively. The burned area is a spherical area with a radius of 0.5 m in the center of the gas accumulation area, in which the volume fraction of CO2 is 0.1456, the volume fraction of H2O is 0.11925, the standard atmospheric pressure is 101,325 Pa, and the temperature is 1,600 K. The SIMPLE algorithm was used for iterative solution, and the iteration step was 0.0005 s. SIMPLE algorithm is a widely used numerical method to solve flow field in computational fluid mechanics. It can not only solve nonlinear problems but also complete the coupling of velocity and pressure. Therefore, SIMPLE algorithm is used for iterative solution.
The basic equation of aerodynamics is also studied based on the law of conservation of mass, energy, and so on. Therefore, the basic governing equation used in numerical simulation of gas explosion in this article is as follows (Wu et al., 2017):
Continuity equation:
Energy equation:
Momentum equation:
Equation of state:
where p is pressure; T is time; x, y, and z are rectangular coordinate system parameters; u, v, and w are the velocities in three coordinate directions, respectively;
Gas explosion will lead to turbulent combustion, and the flow is unsteady turbulent flow. According to Wen et al. (2013), Li et al. (2015), and Wen et al. (2016), large eddy simulation can better simulate the required results. Therefore, the LES turbulence model is adopted in this article to describe the characteristics of turbulent flow field in the combustion process, and the standard wall surface function is adopted for wall surface. The eddy current dissipation model, whose reaction rate is controlled by turbulent mixing, is used for nonpremixed flames. In combination with literature (Hassan et al., 2010; Halouane and Dehbi, 2017; Hoste et al., 2019; Chen et al., 2020; Tian, 2020), the ED eddy dissipation model, which is applied to the LES turbulence model is adopted for combustion model, and the simple algorithm is used for iterative solution with an iterative time step of 0.0005 s. The reliability of the turbulence and combustion model is verified below.
According to the previous pipeline gas explosion experiment (Jing, 2017), the geometry and mesh modules in Ansys workbench are used to construct the full-size three-dimensional physical model and divide the grid. The cross-section of the physical model is shown in Figure 3.
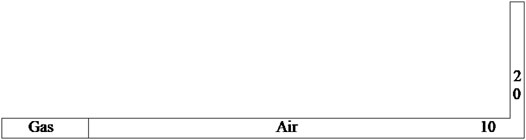
FIGURE 3. Section diagram of physical model.
The width and height of the pipe in the physical model are 80 mm, the length is 19.2 m, and the length of the vertical pipe is 5 m. Experimental monitoring point 1 is 19 m away from the leftmost end and located on the middle line of the horizontal pipeline; experimental monitoring point 2 is located on the middle line of the vertical pipeline and 0.5 m away from the middle line of the horizontal pipeline.
The initial conditions and boundary conditions of gas explosion numerical simulation are consistent with those of previous pipeline gas explosion experiments, as follows:
1) The initial conditions of the burned zone are as follows: T = 1,600 K, H2O volume fraction is 0.118, CO2 volume fraction is 0.145, and initial pressure is 101,325 Pa. The initial conditions of unburned zone are as follows: T = 300 K, CH4 volume fraction is 0.053, O2 volume fraction is 0.21, and both H2O and CO2 volume fractions are 0. The initial conditions of the air zone are as follows: the volume fractions of CH4, H2O, and CO2 are all 0, and the volume fraction of O2 is 0.233.
2) Boundary conditions: the pipe boundary is set as an adiabatic wall, the temperature is 300 K, and the outlet above the vertical pipe is set as a pressure outlet.
3) Calculation model: fluid flow is unsteady turbulent flow, LES turbulence equation is used for turbulence model, standard wall function is used for wall surface, the ED vortex dissipation model suitable for turbulent combustion is used for chemical reaction of methane combustion, and the SIMPLE algorithm is used for iterative solution.
According to experimental conditions, 4-, 5.5-, and 7-m gases were filled in the simulation of pipeline gas explosion. The simulation and experimental comparisons of measuring points 1 and 2 under different gas filling lengths are shown in Table 1 and Figure 4.
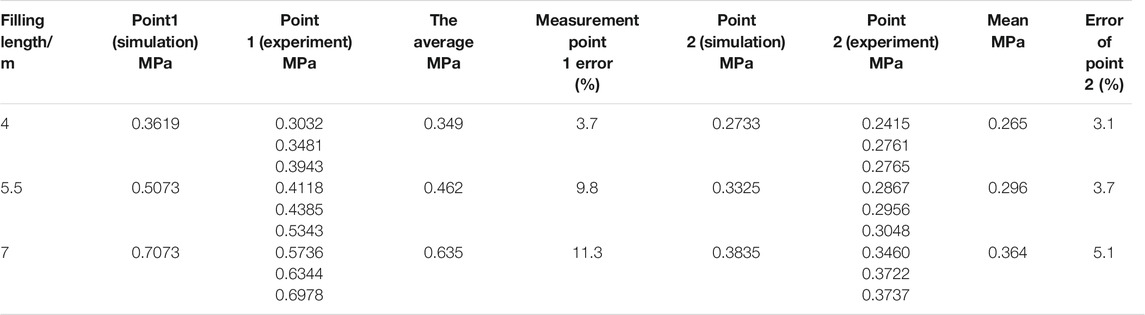
TABLE 1. Comparison between simulation and experiment at different gas filling lengths.
FIGURE 4. Comparison between simulation and experiment at different gas filling lengths. (A) Comparison between simulation and experiment at measuring point 1. (B) Comparison between simulation and experiment at measuring point 2.
By analyzing Table 1 and Figure 4, it can be seen that when the gas filling lengths are 4, 5.5, and 7 m, respectively; the numerical simulation results are larger than the experimental results by comparing the overpressure peaks at each measuring point, with the maximum error of 11.3% and the minimum error of 3.1%, both less than 15%. Considering the idealization of numerical simulation and the allowable error range of engineering, the reliability of LES turbulence model and ED vortex dissipation calculation model suitable for turbulent combustion in gas explosion numerical simulation is verified. Taking into account the idealization of numerical simulation and the allowable error range of engineering, the reliability of choosing the LES turbulence model and the ED vortex dissipation calculation model that is suitable for turbulent combustion in the numerical simulation of gas explosion is verified.
High-temperature ignition point was used to detonate the gas in the gas accumulation area of Y-ventilation mode. The cloud diagram of overpressure distribution of gas explosion shock wave at different times is shown in Figure 5.
FIGURE 5. Cloud diagram of gas explosion shock wave overpressure distribution at different times in Y-type ventilation mode. (A) t = 0.006 s. (B) t = 0.012 s. (C) t = 0.06 s. (D) t = 0.17 s. (E) t = 0.37 s. (F) t = 0.46 s.
After the gas in the gas accumulation area is detonated, the overpressure change of each measuring point is the process of oscillation from small to large to small, so there is a peak overpressure in each position. With the propagation of explosive shock wave, the variation of overpressure peak value in intake airway 1 with distance is shown in Figure 6. The peak value of overpressure in working face varies with distance as shown in Figure 7. The variation of overpressure peak value in intake airway 2 and return airway with distance is shown in Figure 8.
FIGURE 6. Variation of overpressure peak value with distance in intake airway 1.
FIGURE 7. Variation rule of overpressure peak value with distance in working face.
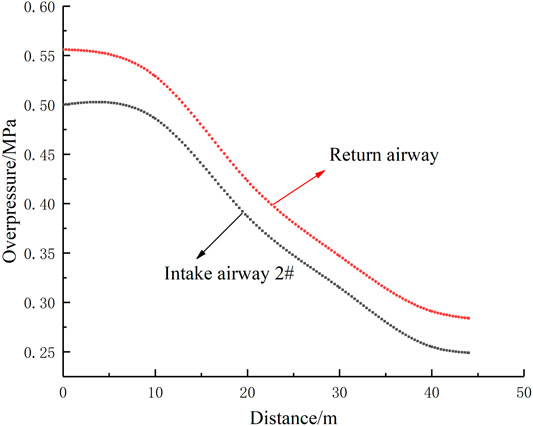
FIGURE 8. Variation of peak overpressure with distance in intake airway 2 and return airway.
Analysis (Figure 5) shows that when the gas is detonated, the impact overpressure of the gas explosion near the explosion source is the largest. As the shock wave propagates along intake airway 1 and the working face, the shock wave overpressure gradually decreases. It can be clearly seen from the cloud image of shock wave propagation that obvious reflection superposition of shock wave occurs at the junction between intake airway 1 and working face, resulting in a temporary increase in shock wave overpressure near the reflection superposition area.
The analyses shown in Figures 6 and 8 show that the attenuation of shock wave overpressure in working face and intake airway 1 is a process from intense attenuation to steady attenuation, and its attenuation law is a power function relationship. Through data fitting, the variation law of overpressure peak in working face with distance is y = 0.08 + 0.48*e(−x/27.84), and the correlation is 0.87. The variation law of overpressure peak value in intake airway 1 with distance is y = 0.07 + 0.06*e(−x/5.85), and the correlation is 0.98. The attenuation trend of shock wave overpressure in intake airway 2 and return airway is completely different from that in intake airway 1 and working face, and the peak value of shock wave overpressure in return airway is obviously larger than that in intake airway 2. Through calculation, the peak value of overpressure in all places in return airway is 10.6% higher than that in intake airway 2 on average. Combined with the shock wave cloud diagram at t = 0.012 s in Figure 5, part of the explosion shock wave in the gas accumulation area spreads along the working face, resulting in the diversion of the shock wave. Therefore, the peak value of overpressure of the shock wave at each position in the return airway is significantly larger than that in intake airway 2.
Statistical table of attenuation rate per 10 m of peak overpressure in intake airway 1, intake airway 2, and return airway and variation curve of attenuation rate are shown in Table 2 and Figure 9, respectively.
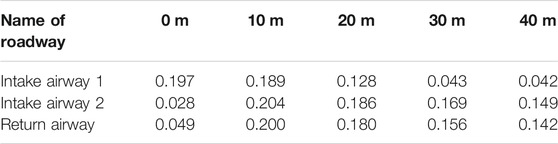
TABLE 2. Statistical table of attenuation rate of peak overpressure per 10 m in intake airway 1, intake airway 2, and return airway.
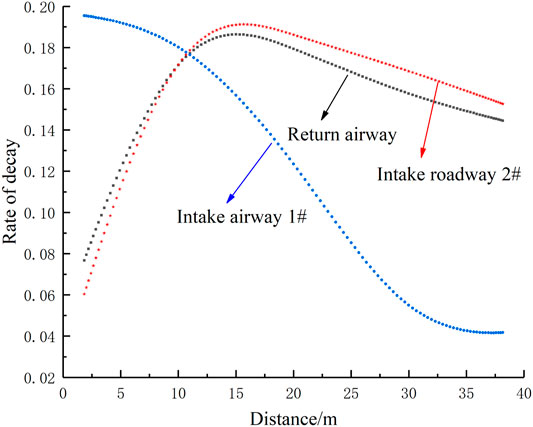
FIGURE 9. Variation rule of attenuation rate of peak overpressure per 10-m intake airway 1, intake airway 2, and return airway.
The statistical table of attenuation rate of overpressure peak at every 20 m in the working face and the variation curve of attenuation rate are shown in Table 3 and Figure 10, respectively.

TABLE 3. Statistical table of attenuation rate of overpressure peak at every 20 m in working face.

FIGURE 10. Variation curve of attenuation rate of overpressure peak at every 20 m in working face.
As can be seen from Figures 9 and 10, the attenuation rate curves of peak overpressure in intake airway 2 and return airway first rise and then decrease and reach the maximum at 15 m; that is, the peak overpressure attenuates slowly at the beginning, and the attenuation accelerates after the shock wave propagates for a certain distance, and then the attenuation rate decreases again. Because the air intake airway 1 is far from the explosion source, the overpressure in the roadway is relatively low, similar to the back end of the working face. The attenuation rate of the peak overpressure of intake airway 1 gradually decreases, and it starts to decay steadily when it approaches the fixed value of 0.04 at 40 m of the roadway; The peak value of overpressure in the working face attenuates rapidly from the beginning, and with the propagation of shock wave, its attenuation rate gradually decreases, and the farther away from the explosion source, the more gentle the curve of overpressure peak attenuation rate changes, gradually approaching 0.1.
The gas accumulated in the middle of the working face was detonated through the high-temperature ignition point, and the cloud diagram of the overpressure distribution of the gas explosion shock wave at different times is shown in Figure 11.
FIGURE 11. Cloud diagram of shock wave overpressure distribution at different time of gas explosion. (A) t = 0.006 s. (B) t = 0.012 s. (C) t = 0.06 s. (D) t = 0.17 s. (E) t = 0.2 s. (F) t = 0.26 s.
Because of the symmetry of W-type ventilation mode, when gas explosion occurs in the accumulation area in the middle of the working face, combined with the relevant assumptions of numerical simulation, the overpressure variation law of intake airways 1 and 2 is the same in theory. With the propagation of explosive shock wave, the variation of overpressure peak value in intake airways 1 and 2 with distance is shown in Figure 12. The variation rule of the peak overpressure in the working face with the distance from explosion source is shown in Figure 13. The peak value of overpressure varies with distance in the return airway, as shown in Figure 14.
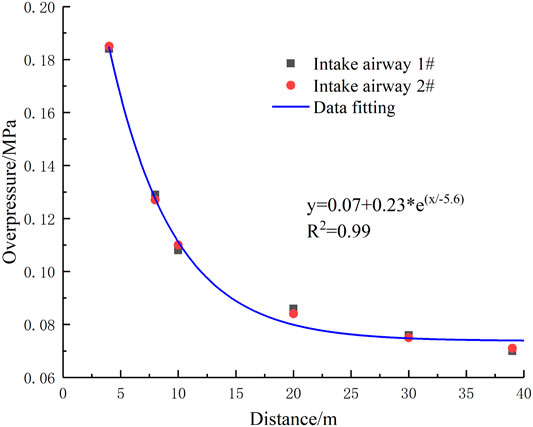
FIGURE 12. Variation of the peak value of overpressure with distance in intake airways 1 and 2.
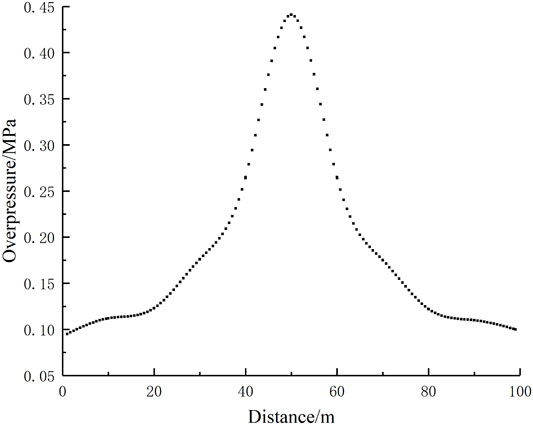
FIGURE 13. Variation of overpressure peak in working face with distance.
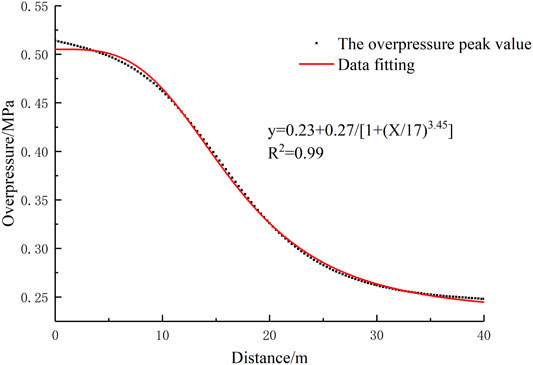
FIGURE 14. Variation of peak overpressure with distance in return airway.
Analyzing Figures 12 and 14, we can see the following: in intake airways 1 and 2, the peak value of overpressure of shock wave has the same variation pattern, and its attenuation is relatively rapid at the beginning. With the increase in propagation distance, the attenuation of the peak value of overpressure gradually slows down. Through data fitting, the variation law of overpressure peak value in intake airways 1 and 2 with distance is y = 0.07 + 0.23*e(x/−5.6), and the correlation is 0.99. In the working face, after the gas explosion occurs in the gas accumulation area, the blast wave propagates from the explosion source to both sides, and the attenuation law of the overpressure of the shock wave on both sides is the same. In the return airway, the peak value of shock wave overpressure is relatively high as it is close to the explosion source, and its attenuation trend is a process from gentle to severe and then to gentle. Its attenuation law is y = 0.23 + 0.27/[1+(x/17)3.45], and the correlation is 0.99. Statistical table of attenuation rates per 10 m of peak overpressure in intake airways 1 and 2 and variation curves of attenuation rates are shown in Table 4 and Figure 15 respectively. The statistical table of attenuation rate of overpressure peak in working face every 20 m and the variation law of attenuation rate are shown in Table 5 and Figure 16, respectively. The statistical table of attenuation rate per 10 m of peak overpressure in the return airway and the variation curve of attenuation rate are shown in Table 6 and Figure 17 respectively.
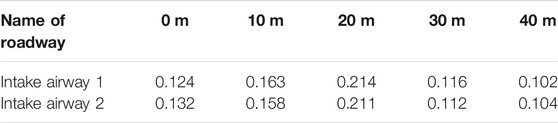
TABLE 4. Statistical table of attenuation rate of peak overpressure per 10 m in intake airways 1 and 2.
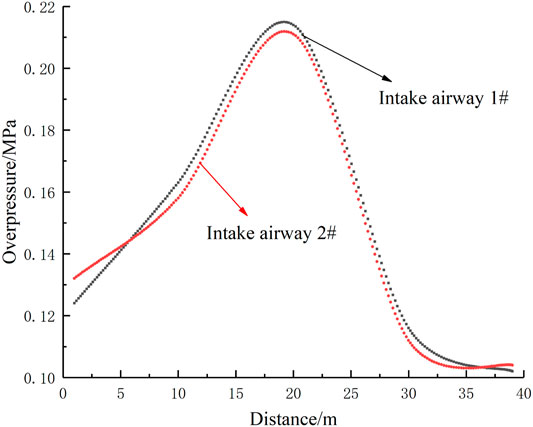
FIGURE 15. Variation rule of attenuation rate of peak overpressure per 10-m intake airways 1 and 2.

TABLE 5. Statistical table of attenuation rate of overpressure peak at every 20 m in working face.
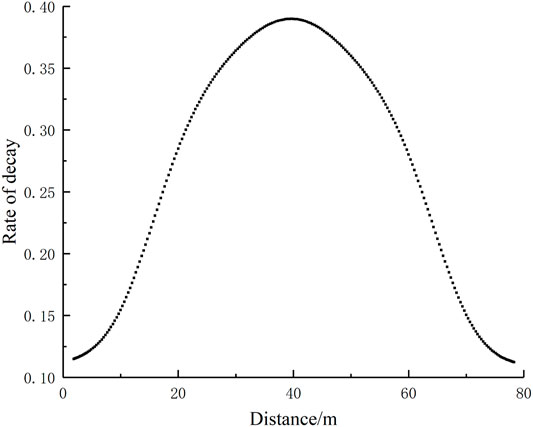
FIGURE 16. Variation curve of attenuation rate of overpressure peak at every 20 m in working face.

TABLE 6. Statistical table of attenuation rate of peak overpressure per 10 m in return airway.
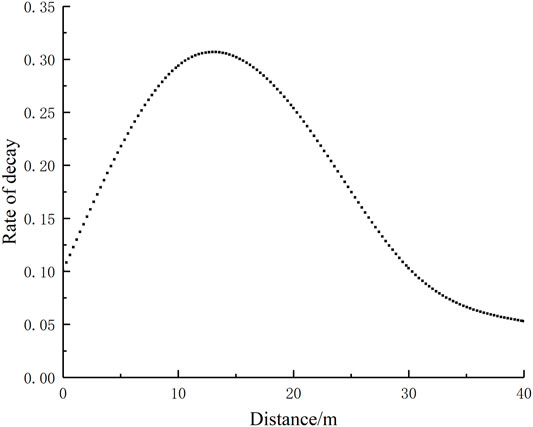
FIGURE 17. Variation curve of attenuation rate of peak overpressure per 10 m in return airway.
Analyzing Figures 15 and 17, it can be seen that when the gas exploded in the working face of W-type ventilation, the peak overpressure attenuation rate in intake airways 1 and 2 shows a law from low to high to low, reaching the maximum at 20 m and beginning to steadily decay at 40 m with an attenuation rate of approximately 0.1. The peak attenuation rate of overpressure in working face gradually decreases to close to 0.1 with the propagation distance of shock wave. The return airway with W-type ventilation is close to the explosion source, and the overpressure in the roadway is large after the explosion. The attenuation rate of the peak overpressure in the return airway of the W-type ventilation mode first increases and then decreases, and the attenuation rate is the largest at 15m, and it decays steadily at a rate of approximately 0.05 from 40 m.
1) Under the condition of Y-type ventilation mode: in the working face and intake airway 1, the shock wave overpressure is a process of attenuation from violent to steady attenuation, and their attenuation laws are the same and present a power function relationship. The change of pressure peak with distance is y = 0.08 + 0.48*e(−x/27.84). The change of the peak overpressure with distance in intake airway 1 is y = 0.07 + 0.06*e(−x/5.85). The attenuation trend of shock wave overpressure in intake airway 2 and return airway is completely different from that in intake airway 1 and working face, and the peak value of shock wave overpressure in all parts of return airway is 10.6% larger than that in intake airway 2 on average.
2) Under the condition of Y-type ventilation mode: the peak attenuation rate curve of overpressure in intake airway 2 and the return airway first rises and then drops, and the maximum is at 15 m. The overpressure in the air intake airway 1 is relatively low, similar to the back end of the working face. The attenuation rate of the peak overpressure of intake airway 1 gradually decreases, and it starts to decay steadily when it approaches the fixed value of 0.04 at 40 m of the roadway. The overpressure peak in the working face, with the propagation of shock wave, its attenuation rate gradually decreases, and the farther away from the explosion source, the more gentle the overpressure peak attenuation rate curve, gradually approaching 0.1.
3) Under the condition of W-type ventilation mode: in intake airways 1 and 2, the peak value of overpressure of shock wave has the same variation law, and its attenuation is relatively rapid at the beginning. With the increase in propagation distance, the peak value of overpressure attenuation gradually slows down. Through data fitting, the variation law of overpressure peak value in inlet roadways 1 and 2 with distance is y = 0.07 + 0.23*e(x/−5.6). In the working face, the shock wave propagates from the detonation source to both sides, and the attenuation law of overpressure of the shock wave on both sides is the same. In the return airway, the peak value of shock wave overpressure is relatively high as it is close to the explosion source, and its attenuation trend is a process from gentle to severe and then to gentle, and its attenuation law is y = 0.23 + 0.27/[1+(x/17)3.45].
4) Under the condition of W-type ventilation mode: the peak attenuation rate of overpressure in intake airways 1 and 2 shows a law from low to high and then to low, reaching the maximum at 20 m and beginning to steadily decay at approximately 0.1 at 40 m. The peak attenuation rate of overpressure in working face decreases gradually with the propagation distance of shock wave. In the return airway, the attenuation rate of peak overpressure increases at first and then decreases, and the attenuation rate reaches the maximum at 15 m and starts to decay steadily at approximately 0.05 from 40 m.
The original contributions presented in the study are included in the article/Supplementary Materials, further inquiries can be directed to the corresponding author.
Conceptualization, JL and SC; data curation, YZ and SC and ZN and DY; writing—original draft preparation, JL; writing—review and editing, JL.
This work was supported by National Natural Science Foundation of China (52074106; 51734007). This project was also supported by Zhongyuan Postdoctoral Innovative Talent (ZYQR201810171), supported by the China Postdoctoral Science Foundation Grant (2019M652536), the Henan Postdoctoral Foundation (001801016), Funded by the Doctoral Fund of Henan Polytechnic University (No.B2018-59).
The authors declare that the research was conducted in the absence of any commercial or financial relationships that could be construed as a potential conflict of interest.
All claims expressed in this article are solely those of the authors and do not necessarily represent those of their affiliated organizations, or those of the publisher, the editors and the reviewers. Any product that may be evaluated in this article, or claim that may be made by its manufacturer, is not guaranteed or endorsed by the publisher.
Chen, Y., Huang, Q., and Wang, P. (2020). Further Development of the Modified Eddy Dissipation Model. J. Phys. Conf. Ser. 1509 (1), 012014. doi:10.1088/1742-6596/1509/1/012014
Ding, G. F., Lv, Z. F., and Cao, J. C. (2020). Analysis of Development and Utilization Status of Large-Scale Coal Base in China [J]. Energ. Prot. 42 (11), 107–110. doi:10.19389/j.cnki.1003-0506.2020.11.023
Gieras, M., Klemens, R., Rarata, G., and Wolański, P. (2006). Determination of Explosion Parameters of Methane-Air Mixtures in the Chamber of 40dm3 at normal and Elevated Temperature. J. Loss Prev. Process Industries 19 (2), 263–270. doi:10.1016/j.jlp.2005.05.004
Halouane, Y., and Dehbi, A., (2017). CFD Simulations of Premixed Hydrogen Combustion Using the Eddy Dissipation and the Turbulent Flame Closure Models[J]. Int. J. Hydrogen Energ. 42 (34), 21990–22004. doi:10.1016/j.ijhydene.2017.07.075
Hassan, I. K., Khalid, M. S., and Hossam, S. A. (2010). Implementation of the Eddy Dissipation Model of Turbulent Non-Premixed Combustion in Open FOAM [J]. Int. Commun. Heat Mass Transfer 38 (3), 363–367. doi:10.1016/j.icheatmasstransfer.2010.12.012
Hoste, J. J. O. E., Fossati, M., Taylor, I. J., and Gollan, R. J. (2019). Characterisation of the Eddy Dissipation Model for the Analysis of Hydrogen-Fuelled Scramjets. Aeronaut. J. 123 (1262), 536–565. doi:10.1017/aer.2018.169
Ibrahirn, S. S., and Masri, A. R. (2001). The Effects of Obstructions on Overpressure Resulting from Premixed Flame Deflagration [J]. J. Loss Prev. Process Industries 14 (3), 213–221. doi:10.1016/S0950-4230(00)00024-3
Jia, Z. W., and Xu, S. M. (2015). Experimental Study on Propagation Law of Gas Explosion Shock Wave in Unidirectional Bifurcation Pipe [J]. China Saf. Sci. J. 25 (12), 51–55. doi:10.16265/j.cnki.issn1003-3033.2015.12.009
Jing, G. X. (2017). Propagation Law and Damage Model of Gas Explosion under Complex Conditions [M]. Beijing: Science Press.
Kravtsov, A. N., Zdebski, J., and Svoboda, P. (2015). “Numerical Analysis of Explosion to Deflagration Process Due to Methane Gas Explosion Inunderground Structures [C],” in Military Technologies (ICMT), 2015 International Conference on, Washington, DC, December, 2015 (IEEE), 1–9.
Li, C. Z., Yu, L. Z., and Ji, N. X. (2011). Numerical Simulation of Shock Wave Structure in Gas Explosion [J]. Proced. Eng. 26, 1322–1329. doi:10.1016/j.proeng.2011.11.2307
Li, Z. F., Yu, M. G., and Ji, W. T. (2015). Numerical Simulation of Turbulent Flame Induced by Obstacles in Gas Explosion [J]. J. Henan Polytechnic Univ. (Natural Sci. Edition) 34 (2), 167–170. doi:10.16186/j.cnki.1673-9787.2015.02.006
Liu, J. J., Chen, S. Q., and Ren, J. Z. (2020). Research on the Influence of Gas Accumulation Amount and Explosion Distance on Fan and Explosion Door [J]. China work Saf. Sci. Technol. 16 (9), 57–63. doi:10.11731/j.issn.1673-193x.2020.09.009
Masri, A. R., Ibrahim, S. S., and Nehzat, N. (2000). Experimental Study of Premixed Flame Propagation over Various Solid Obstructions [J]. Exp. Therm. Fluid Sci. 21 (1), 109–116. doi:10.1016/s0894-1777(99)00060-6
Qiu, J. W. (2018). Simulation Study on Propagation Characteristics and Disaster Process of Gas Explosion Shock Wave in Pipe Network [D]. Huainan: Anhui University of Science & Technology.
Shao, H., Jiang, S., Zhengyan, W., Weiqing, Z., and Kai, W. (2015). Influence of Vacuum Degree on the Effect of Gas Explosion Suppression by Vacuum Chamber [J]. J. Loss Prev. Process Industries 38, 214–223. doi:10.1016/j.jlp.2015.09.013
Tian, Z. D. (2020). Simulation of HiFIRE-2 Scramjet Based on Vortex Dissipation Model [J]. Electron. Test. 27 (7), 60–61.
Wang, C. L., and Du, J. (2021). Experimental Study on Propagation Law of Gas Explosion Shock Wave in Different Ventilation Pipe Network [J]. Mine Construction Technol. 42 (4), 32–38+26. doi:10.19458/j.cnki.cn11-2456/td.2021.04.007
Wang, K., Jiang, S., Ma, X., Wu, Z., Zhang, W., and Shao, H. (2015). Study of the Destruction of Ventilation Systems in Coal Mines Due to Gas Explosions [J]. Powder Technol. 286, 401–411. doi:10.1016/j.powtec.2015.08.020
Wang, C., Zhao, Y., and Addai, E. K. (2017). Investigation on Propagation Mechanism of Large Scale Mine Gas Explosions [J]. J. Loss Prev. Process Industries 49, 342–347. doi:10.1016/j.jlp.2017.07.011
Wen, X. P., Xie, M. Z., and Yu, M. G. (2013). Dynamic Characteristics of Gas Deflagration in Small-Scale Confined Space [J]. Combustion Sci. Technol. 19 (4), 347–351.
Wen, X. P., Yu, M. G., and Deng, H. X. (2016). Large Eddy Simulation of Gas Turbulence Deflagration in Small Scale Confined Space [J]. J. Chem. Industry Technol. 67 (5), 1837–1843. doi:10.11949/j.issn.0438-1157.20151219
Wu, B., Zhang, L. C., and Xu, J. D. (2005). Numerical Simulation of Shock Wave Induced by Moving Flame for Gas Explosion [J]. J. China Univ. Mining Technol. 34 (4), 423–426. doi:10.3321/j.issn:1000-1964.2005.04.004
Wu, T. R., Ye, Q., and Liu, W. (2017). Study on Seismic Absorption and Energy Absorption Performance of Borehole on Coal and Rock Roadway Wall [J]. China Saf. Sci. Technol. 1304, 81–86. doi:10.11731/j.issn.1673-193x.2017.04.014
Xue, S. S. (2019). Study on Cause Analysis and Control of Coal Mine Gas Accident Based on Probabilistic Reasoning [D]. Xuzhou: China University of Mining and Technology.
Yan, A. H., Nie, B. S., and Dai, L. C. (2011). Numerical Simulation on the Gas Explosion Propagation Related to Roadway [J]. Proced. Eng. 26, 1563–1570. doi:10.1016/j.proeng.2011.11.2339
Ye, Q., Lin, B. Q., and Jia, Z. Z. (2009). Propagation Law and Analysis of Gas Explosion in bend Duct [J]. Proced. Earth Planet. Sci. 1 (1), 316–321. doi:10.1016/j.proeps.2009.09.050
Zhao, D., and Qi, H. (2018). Experimental Study on Shock Wave Propagation of Gas Explosion in Different Types of Pipelines [J]. China Saf. Sci. J. 28 (3), 79–83. doi:10.16265/j.cnki.issn1003-3033.2018.03.014
Zhu, S. F., and Ye, Q. (2019). Numerical Simulation of Shock Wave Propagation of Gas Explosion in Roadway Space [J]. Mining Eng. Res. 34 (3), 23–30. doi:10.13582/j.cnki.1674-5876.2019.03.004
Zhu, C. J., Lin, B. Q., and Jiang, B. Y. (2012). Numerical Simulation of Shock and Oscillation Characteristics of Gas Explosion in Closed Pipe [J]. Vibration and shock 31 (16), 8–12. doi:10.13465/j.cnki.jvs.2012.16.009
Keywords: different ventilation modes, gas explosion, peak overpressure, shock waves, numerical simulation
Citation: Liu J, Zhang Y, Chen S, Nie Z and Yang D (2022) Simulation Study of Gas Explosion Propagation Law in Coal Mining Face With Different Ventilation Modes. Front. Energy Res. 10:846500. doi: 10.3389/fenrg.2022.846500
Received: 31 December 2021; Accepted: 24 January 2022;
Published: 01 March 2022.
Edited by:
Weiguang An, China University of Mining and Technology, ChinaReviewed by:
Zhang Leilin, Anhui University of Science and Technology, ChinaCopyright © 2022 Liu, Zhang, Chen, Nie and Yang. This is an open-access article distributed under the terms of the Creative Commons Attribution License (CC BY). The use, distribution or reproduction in other forums is permitted, provided the original author(s) and the copyright owner(s) are credited and that the original publication in this journal is cited, in accordance with accepted academic practice. No use, distribution or reproduction is permitted which does not comply with these terms.
*Correspondence: Jiajia Liu, bGl1amlhamlhQGhwdS5lZHUuY24=
Disclaimer: All claims expressed in this article are solely those of the authors and do not necessarily represent those of their affiliated organizations, or those of the publisher, the editors and the reviewers. Any product that may be evaluated in this article or claim that may be made by its manufacturer is not guaranteed or endorsed by the publisher.
Research integrity at Frontiers
Learn more about the work of our research integrity team to safeguard the quality of each article we publish.