 Shuangfeng Dai
 Ze Ye1*
 Wen Wei
- 1College of Economics and Management, Changsha University of Science and Technology, Changsha, China
- 2College of Economics and Management, Hunan University of Science and Technology, Yueyang, China
- 3College of Electrical and Information Engineering, Changsha University of Science and Technology, Changsha, China
Aiming at the impact of energy storage investment on production cost, market transaction and charge and discharge efficiency of energy storage, a research model of energy storage market transaction economic boundary taking into account the whole life cycle cost was proposed. Firstly, a peak-valley filling time division method based on equal capacity is proposed, which effectively improves the peak-valley time division and the accuracy of ES should scene switch. On this basis, a control strategy of “off-time reuse” is proposed to give full play to the function of “one standby multi-purpose” of energy storage, which improves the energy storage utilization rate and economic benefits. Secondly, an economic boundary model based on the life-cycle cost of energy storage and the evolution function of energy storage cost is constructed and solved by improved genetic algorithm. Finally, the simulation results show that compared with mono-peak control, the UTILIZATION rate of ES is increased by 16.25% and the investment recovery life is shortened by 1.17 years with “off-time reuse” strategy. Compared with the fixed division method, the investment recovery life of “peak clipping and valley filling” period division method is shortened by 1.75 years. In 2022, compared with the critical value of 0.76 yuan/kWh for fixed charge-discharge efficiency and cost, the critical value of the life-cycle cost model is 0.8 yuan/kWh, with an error of up to 5.26%.
1 Introduction
The peak valley difference of load increases significantly with the continuous increase in industrial and residential load levels and the implementation of the “dual carbon” policy, which poses great challenges to the peak regulation of power systems (Chen et al., 2021). In recent years, based on the rapid response capacity of ES and the function of peak cutting and valley filling, it has been widely used in assisting peak shaving in power systems (Aneke and Wang, 2016; Ould Amrouche et al., 2016). As a result, the economic benefits of ES primarily come from the “peak-valley price difference” of peak regulation. Therefore, how to construct the “peak-valley price difference” boundary value model in electricity market transactions has become a research focus (Cao et al., 2021; Cai and Li, 2021).
Scholars have carried out a series of studies on the economics of ES in peak shaving. In literature (El-Zonkoly, 2014; Chen and Song, 2015), according to the peak load shaving demand for the power grid, the peak load filling function of ES and the advantages of market participation in the business model and economic scheduling of charge and discharge can bring considerable benefits to the power system. It shows the economic and technical feasibility of ES participating in peak regulation. Literature (Sigrist et al., 2013) developed the economic operation optimization model of a centralized, isolated system, and evaluated the economic benefit and the effect of peak regulation of ES systems. From a demand-side management perspective, research (Fazelpour et al., 2013; Finn et al., 2012) proposed that charging ES devices during off-peak load periods can reduce charging costs and studied the charging and discharging strategies of ES according to peak and valley pricing. The literature (Zhang et al., 2020; Padmanabhan et al., 2019) believes that accurate estimation of battery degradation cost is one of the primary obstacles to batteries participating in the energy arbitrage market. Therefore, a model-free deep reinforcement learning method was proposed to solve the battery degradation model and optimize the battery energy arbitrage problem. Literature (Zhang et al., 2021) proposed a bilateral auction model named the “Average Pricing Market” mechanism, aiming to solve the problem of loss of energy transaction income caused by the large difference between time-of-use power price and grid purchase price. Meanwhile, to handle the uncertainty in electricity price, a scenario-based stochastic formulation was developed in (Krishnamurthy et al., 2017) for battery energy arbitrage in both day-ahead and real-time markets. To analyze the impact of ES on the Danish electricity market, a schedule optimization model was developed with the objective function of minimizing the ES system’s operation costs (Dai et al., 2014). To solve the charging economics problem, accurately forecast future power prices, and reduce the ES charging cost using dynamic programming theory (Fekri Moghadam et al., 2015). A supply chain management method based on a low-carbon economy, combined with game theory, is used to study the pricing of ES and promotion plans. To analyze the interest relationship between ES equipment manufacturers, ES equipment operators, and power users, the literature (Song et al., 2019) used the game analysis approach to determine the benefit equilibrium state for the three elements. Research (Attarha et al., 2018; Jiang and Peng, 2021) proposed an affinely adjustable, robust bidding approach for solar power with battery storage to address the uncertainties of both PV solar power production and electricity prices.
While the above literature review shows that prior studies have made significant contributions to promoting ES’s participation in power market services, there are still some problems: 1) At the present stage, the benefits of energy storage’s participation in electricity market services mainly depend on “peak clipping and valley filling”, but there are few reports on how to determine the peak and valley period, and the fixed peak and valley period is basically used for calculation. However, in different seasons, load curves are different, and the peak and valley period has deviation, thus affecting the economy of ES auxiliary service. 2) At present, fixed energy storage cost and charge-discharge efficiency are mostly used to solve the economic boundary value of energy storage, and the research on the evolution trend of energy storage cost and charge-discharge efficiency is still in the initial stage.
To this end, the main contributions of this paper are as follows: 1) It proposes a peak-valley splitting method based on equal capacity, which effectively improves the peak-valley splitting and the accuracy of ES should scene switching. On this basis, a control strategy of “off-time reuse” is proposed to give full play to the function of “one standby multi-purpose” of energy storage, which improves the energy storage utilization rate and economic benefits. 2) Construct an economic boundary value model based on the life-cycle cost and cost evolution function of energy storage, which fully considers the cost variation of energy storage and the charge and discharge efficiency, and uses the improved genetic algorithm to solve. To make it more in line with the actual project, for investment enterprises to make decisions to provide more reliable theoretical basis.
2 Economic Model of ES in Electricity Market Trading
The charging and discharging efficiency of ES varies with the charging and discharging times and operating time. The investment and construction costs of an ES power station vary with the power station’s operating time, as does the cost ratio. Therefore, this study proposes a life-cycle cost economic model to accurately describe the economic benefits of ES in electricity market transactions.
2.1 ES Cost Model
Based on the existing research on ES costs, a dynamic life-cycle cost model is created by factoring in the natural aging of ES batteries and the cost components in different stages of the battery’s life. The definitions and calculating methods of each component are as follows:
2.1.1 Power Station Investment Cost CIC
where Cic is the construction cost; Cie is the cost of equipment purchase; Cii is installation engineering fee, and Cio is other expenses.
2.1.2 Operating Cost COC
where Coe is energy consumption and Coh is labor cost.
2.1.3 Maintenance Cost CMC
where Cmr is the cost of daily equipment maintenance and Cml is the cost of scheduled maintenance.
2.1.4 Replacement Cost
The actual service life of some batteries may be shorter than the rated service life. Battery change is required to ensure the normal operation of the system. The cost can be expressed as follows:
where Cex is ES replacement cost, α represents the annual cost reduction rate of each battery replacement, β is the number of replacement, η is the charge and discharge efficiency.
2.1.5 Failure Costs CFC
where cf is the average repair cost per failure per unit time, N1 is the number of failures, Tm is the average repair time, λ is the average penalty cost per failure per unit time, and Tf is the duration of the fault.
2.1.6 Scrap Cost CDC
where Cdl is the scrap disposal cost, K0 is initial value, d is rate of depreciation, Kd is surplus value at the end of T, and T is life cycle.
2.1.7 Cost Depletions CPC
Where nc = nf is the charge and discharge efficiency, PC = PF is the amount of charge and discharge each time, and μ is the unit price of charge.
2.2 ES Revenue Model
The National Development and Reform Commission and the National Energy Administration jointly issued the Notice on Actively Promoting the Work of Wind Power and Photovoltaic Power Interconnection without Subsidies on 9 January2001, proposing to accelerate the development of wind and photovoltaic power interconnection. Based on the antipeak-shaving characteristics of new energy, ES revenue will primarily rely on “peak cutting and valley filling” to earn the peak-valley price difference in the next few years. It earns subsidies by working as a grid backup (auxiliary service) during idle periods. Therefore, ES revenue is divided into peak cutting and valley filling, as well as revenue from the ancillary service market.
2.2.1 Revenue From Peak Cutting and Valley Filling
Peak cutting and valley filling mostly refer to ES charging during off-peak load periods and discharging during peak load periods to earn the grid price difference. Additionally, fuel costs and environmental governance costs are reduced by reducing the thermal power unit’s peak load. Therefore, the benefits of peak-cutting and valley-filling are both direct and indirect.
2.2.1.1 Direct Benefits of Peak Cutting and Valley Filling
where Pprice is the real-time peak-valley price difference of power grid.
2.2.1.2 Direct Benefits of Peak Adjustment Compensation
In 2016, the National Energy Administration issued a notice “about promoting the auxiliary electric ES to participate in the” three north area peak service notice provisions: construction of ES facilities, storage and joint participation in peak shaving or as an independent subject in the peakload ancillary services market, discharge power according to the power plant’s contract price settlement. Compensation income is calculated as follows.
where B2 is the annual peak adjustment compensation income, Ei is the peak regulating electric quantity on that day, i.e., the contract price, and N2 refers to peak adjustment days in a year.
2.2.1.3 Indirect Benefits of Sewage Costs
Here K is the total number of pollutants, αk is the emission density of pollutant K, and price, k is the unit emission cost of pollutant K.
2.2.1.4 Indirect Benefits of Fuel Costs
The function of “peak clipping and valley filling” of ES can effectively reduce the peak load of thermal power units, thus reducing the fuel cost. The equivalent benefit is as follows:
where Pfuel is the generating capacity per unit and Cfuel is the unit price of fuel.
The benefits of ES peak cutting and valley filling can be summed up as follows:
2.2.2 Ancillary Services Market Revenue
If ES is used exclusively for “peak cutting and valley filling,” ES income will be reduced. Hence, to reflect the ES’s “one standby multipurpose” function, this study proposes the technique of “idle time reuse,” in which ES participates in auxiliary grid service when it is not involved in peak regulation, acting as a backup power source for the grid. At the moment, the income primarily comes from the grid subsidy, which can be expressed:
where Re is the reserve compensation price of the ES, and PF is spare the capacity.
2.2.3 Delay Grid Investment Construction Income
As the load increases, new equipment is needed to upgrade the distribution network. By constructing ES power stations on the grid side that can release power during peak load, it is possible to reduce the load rate of substations and the capacity demand of the distribution network, thereby replacing the traditional power network expansion scheme.
where Pm is the capacity delayed power grid expansion due to ES investment and construction, that is, the rated power of ES, and Cinv is the cost of building additional capacity for the unit, RMB ten thousand/MW, it is the rate of inflation.
Summing up the above, dynamic lifetime Net Present Value (NPV) can be represented as:
where k is the total number of stages in the life cycle, which includes the construction period, trial run period, stable period, and decline period. CIC occurs primarily in the construction period, COC, CMC, CFC, CPC, and Cex occurs in the trial operation period, stable period, and decline period. CDC occurs during a recession; Bk is ES revenue. V0k is the coefficient of the sum of the present values of stage K. V1k is the discount coefficient of residual value at the end of stage K. r is the social discount rate. g(k) is the duration of phase k. f (k) is the operating life of the storage stage K before operation.
2.3 Economic Evaluation Index of ES
The following economic evaluation indexes are constructed to better evaluate the feasibility of the proposed method.
2.3.1 Payback Period
Project investment PP is the time required for a project to recover its initial investment in full. The longer the PP, the higher the investment risk.
If the investment project has the same net cash flow each year, the calculation formula of PP is
where PP is the static investment payback period, (CI–CO)t is the net cash flow in year T, CI is cash inflow, CO is cash outflow, and CF0 is the initial investment. If the net cash flow of the investment project is not equal each year, the PP calculation formula is as follows:
where A is the unrecovered investment at the end of t-1, and T is the year when cumulative net cash flow was positive for the first time.
The dynamic PP calculation formula must meet the following requirements:
where i0 is the discount rate, usually the industry benchmark rate of return.
2.3.2 Net Present Value
NPV is the sum of the present value of the discounted project at the beginning of maturity. It is a method for evaluating investment proposals; if the NPV is positive, the investment scheme is acceptable; if the NPV is negative, the investment scheme is theoretically unacceptable.
2.3.3 Implied Rate of Return
The Internal Rate of Return (IRR) is the actual expected rate of return of a project investment. The bigger the IRR, the better the investment. IRR is calculated as follows:
3 Peak-Valley Period Division Method and Control Strategy of ES
3.1 ES Control Strategy
This effectively improves ES efficiency and income. This study proposes a control strategy based on “idle time reuse,” in which ES participates in the power grid dispatching as reserve resources to increase its income during the idle phase. It fully uses the ES function of the “one standby multipurpose” mode. The working state division of ES in a day is shown in Figure 1.
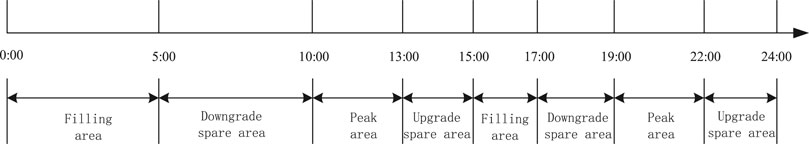
FIGURE 1. Trading period division of ES’s participation in the electricity market.
3.2 Peak-Valley Period Division Method of ES
Currently, research on “peak cutting and valley filling” for ES is highly advanced. However, most of them are based on fixed peak and valley periods and peak and valley values, but peak and valley periods vary slightly throughout seasons. As a result, this study proposes a variable power “peak clipping and valley filling” method for determining the peak and valley period and subsequently improving the accuracy of the model.
The mismatch between ES output and actual load peak adjustment occurs when ES’s historical constant power charging and discharging approach, as well as the local reverse peak phenomenon, are used. This study proposes a variable power “peak cutting and valley filling” method that can dynamically adjust the charge–discharge power according to the load peak adjustment requirement, thus smoothing the load curve and improving the accuracy of peak and valley time division. The specific procedure is as follows:
Step 1: Import the original load PL to obtain the maximum and minimum load values, Pmax and Pmin.
Step 2: The rated power and capacity of the ES are Pm and Em, respectively, while the current available capacity of the storage is En. By starting with the initial value of the peak clipping line Px = Pmax and decreasing the step size △P, the intersection points t1 and t2 of Px = Pmax-k×△P and the load curve can be obtained. Then, the energy released by ES during peak cutting is as follows:
When peak clipping capacity Sf = En, Px is peak clipping line; If Sf < En, the number of iterations k = k + 1, update peak cutting line Px until Sf = En. The peak cutting output of ES is as follows:
Step 3: Take the initial grain filling line Pt = Pmin, and move up with step △P.The intersection points t3 and T4 of the filling line Pt = Pmin + k × △P, the load curve, and the energy absorbed by ES during valley filling is as follows:
When the filling capacity is Sg = En, Pt is the filling line. If Sg < En, iteration times k = k + 1, update peak clipping line Pt until Sg =En. The absorption power of ES during valley filling is as follows:
Thus, the amount of charge and discharge and peak and valley periods of ES during “peak cutting and valley filling” can be determined. Its control process is shown in Figure 2.
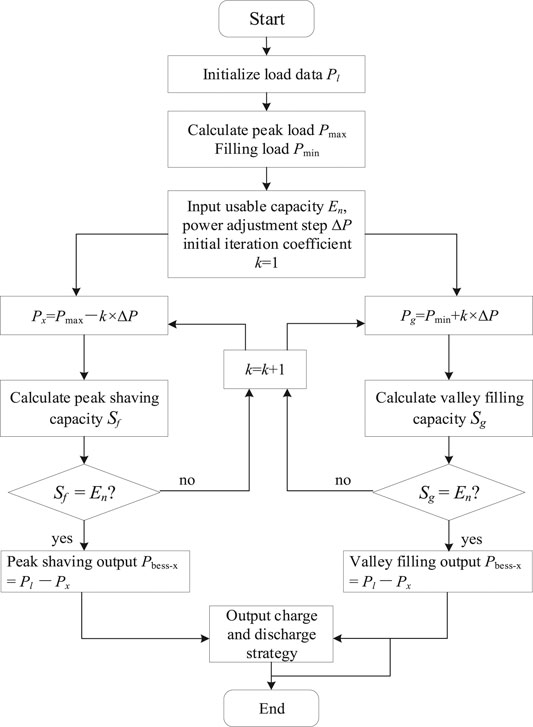
FIGURE 2. ES peak-valley period flow chart of division method.
4 An Economic Bound Model Based on the Cost Evolution of ES
The unit production costs will gradually decrease with the development of ES technology. If the fixed cost is used to calculate the investment benefit, it will not give an accurate investment decision. This study develops an economic bound model of electricity market transactions based on the evolution of ES costs to give an accurate investment decision.
4.1 Mathematical Model of ES Cost Evolution
This section uses the learning curve theory to fit the ES cost evolution function (Qin, 2020) as follows:
Y is the product unit of wood, A is the unit cost of the first product, X is the cumulative output of the product, and b represents the learning rate index, usually 0 < b < 1.
Currently, development scale and research and development investment are two key factors affecting the cost of ES. Therefore, this study constructs the two-factor learning curve, for example.
where C (x0, y0) and C (xt, yt) are the initial unit and the unit cost of ES in the t year, respectively. X0 and Xt are the cumulative production scales in the initial and t years, respectively. Y0 and YT are the accumulated R&D investment in the initial and t years respectively; m and n are the elasticity coefficient of cumulative output and R&D investment, respectively.
To facilitate fitting, take the logarithms of both sides of Eq. 24 and convert them into a linear function, which can be expressed as:
According to relevant parameters in literature (Qin, 2020), the cost evolution function can be expressed as:
4.2 Economic Boundary Mathematical Model of ES
4.2.1 Annual Limit Value Model of Investment Income
It is proposed in this section that the sum of the present value of the benefits of charging and discharging of an ES system in each period equal the present value of the cost of the whole life cycle of charging and discharging in each period be used to determine the economic boundary of ES (Qin, 2020). Namely:
where Ri is the income of ES system in the i year; Ci is the i th annual cost of ES system, and n is the life of ES system.
Additionally, the sum of the discounted value of the product of the annual leveling KWH cost of ES Pdj and the current electricity production En is equal to the sum of the discounted value of the annual life-cycle cost of the ES, namely:
The return on the investment period may be computed using Eqs 27, 28 for a certain level of electricity cost and power production En.
4.2.2 Economic Income Boundary Model
To enhance the economic border mathematical model of ES, this part develops a crucial value model for resolving the equalization KWH cost Pdj over the entire life cycle. Assuming that the leveling KWH cost Pdj remains constant during the life of the ES system, it may be calculated using Eq. 1. To enhance the economic bounder mathematical model of ES, this section develops a critical value model for resolving the equalization KWH cost Pdj in the whole life cycle. Assuming that the leveling KWH cost Pdj remains unchanged throughout the whole life cycle of ES, it can be calculated using Eq. 28:
Additionally, when taken with the life-cycle cost of ES in Section 2:
Where EN is the rated capacity of ES, hi and η I are the utilization hours and efficiency of ES in the first year, respectively.
5 The GA Algorithm Improved the Model
To save space, this section will not go into detail about traditional GA. However, its process analysis is covered in literature (Basu, 2013). This section discusses ways to optimize and improve the GA algorithm and the mechanism through which it solves problems.
Traditional GA algorithms include concepts such as elite selection, fast nondominated sorting, and crowded distance to perform their work (Srinivas and Deb, 1994). The superiority, diversity, and convergence of a population are directly determined by the elite selection operator (Jiang and Tu, 2019). Therefore, this section focuses on optimizing the elite selection operator in the GA algorithm. The following are the specific operations:
In the literature (Dhanalakshmi, et al., 2011; Jeyadevi, et al., 2011), the following operators are proposed to improve it.
where Nm is the number of reserved populations in m rank of non-dominant order, N is the population size, and k is the total number of non-dominant ranking levels.
Although the problem of population diversity is effectively solved in the preceding equation, Nm and gt exists. Nm* (where Nm* is the actual number of individuals in the nondominant ordering m level), which leads to the decrease of the selected population level by level, until the final population number is less than N, or even no solution. Based on this, the literature (Wang, 2020) proposed adding a fault-tolerant term to accommodate the difference between the two values and accumulating the difference to the next level until N individuals are taken, which not only increases computational complexity but also makes it difficult to select an appropriate fault-tolerant variable factor. Based on this, the optimization operator proposed in this study is shown in Eq. 37, as shown in Figure 3, which is the selection probability of individuals of different grades under different R parameters of the optimization elite selection operator.
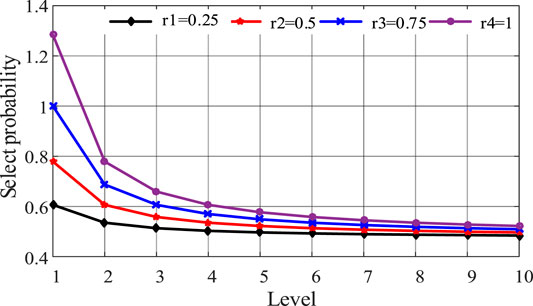
FIGURE 3. Probability of individual selection at different.
It is not difficult to find from the figure that when r = 0.75 and k = 10 are selected, the optimization effect of the elite selection operator is the best. Therefore, r = 0.75 and k = 10 were selected for further simulation. At the same time, it can be further found that in all grades, the number of individuals selected in the population is greater than 1/2, which effectively ensures that the optimal population number meets the requirement of N. At the same time, the probability of individual selection decreases with the increase in rank, which effectively ensures that the characteristics of elite individuals are inherited and accelerates the convergence speed (Qin, 2020). The solving process based on the improved GA algorithm is shown in Figure 4.
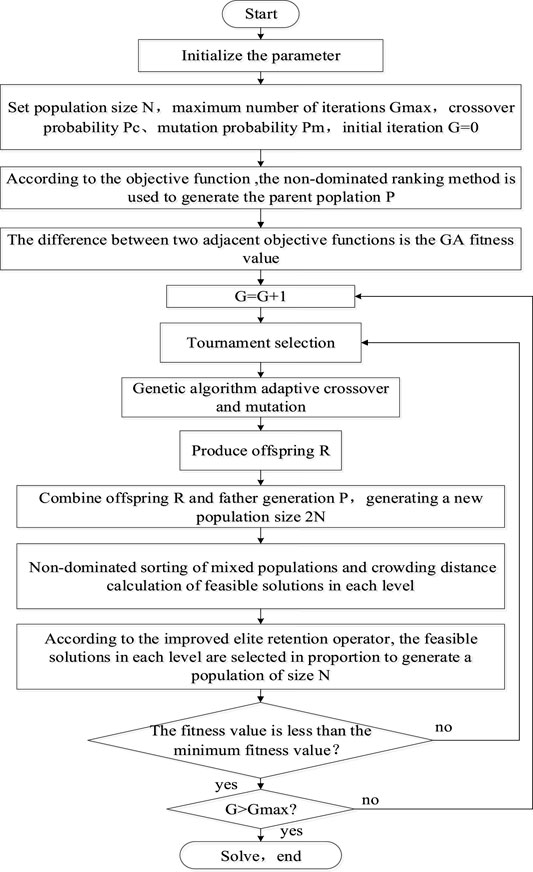
FIGURE 4. Improved GA algorithm solving process.
In section 6.2 and 6.3, economic comparative analysis simulation is mainly carried out, so Eq. 16 is taken as the objective function. In section 6.4 simulation analysis, economic boundary value is mainly solved. After the objective function value of Eq. 16 is worked out, Eq. 32 is substituted for solution.
6 The Simulation Analysis
6.1 Simulation Parameter Basis
This paper takes an ES station in Jiangsu province as an example for analysis. Pm = 27.7 MW, rated capacity EN = 80 MWh, adopt two charge and two discharge mode, charge and discharge 270 days a year, ES battery parameters are shown in Table 1. The peak-shaving compensation standard is 2 yuan/MW, and the deep peak-shaving compensation standard is 0.5 yuan/MWh. The participants participate in deep peak shaving for 140 days throughout the year. The subsidy price of auxiliary services is shown in Figure 5, and the participants participate in the auxiliary services for 240 days throughout the year. The TOU power price are shown in Table 2, and the carbon emissions of thermal power units are shown in Table 3. The construction period, trial operation period, stable period, and decline period of an ES battery are 1, 1, 6, and 2 years, respectively.
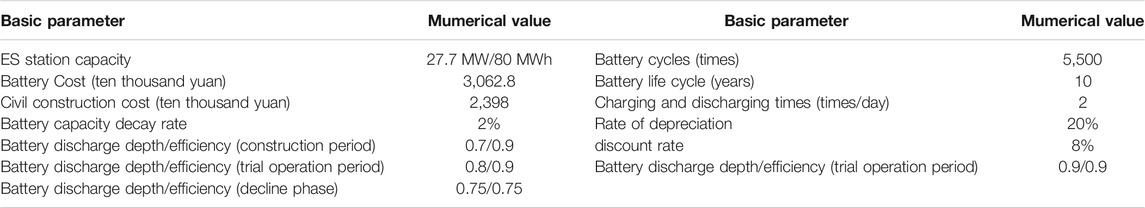
TABLE 1. Basic parameters of an ES battery.

TABLE 2. TOU power price.
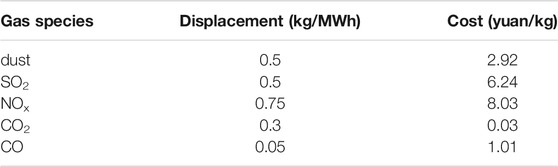
TABLE 3. Type and cost of emissions.
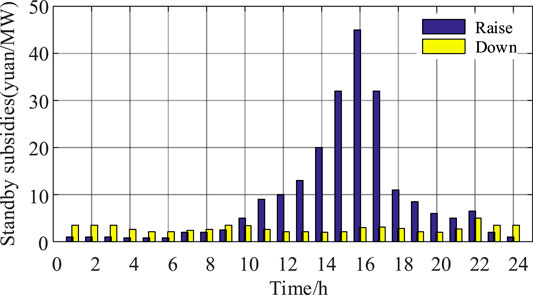
FIGURE 5. ES reserve compensation price.
6.2 Economic Comparative Analysis of the “Idle Time Reuse” Control Strategy
6.2.1 Economic Analysis of “Cutting Peak and Filling Valley”
It is assumed that the maximum iteration number of the GA algorithm is 500, the iteration termination error is 10–10, the population size is 200, and the crossover probability is 0.3 and 0.1, respectively. Annual costs and revenue are shown in Table 4. The curve of “peak cutting and valley filling” is shown in Figure 6.
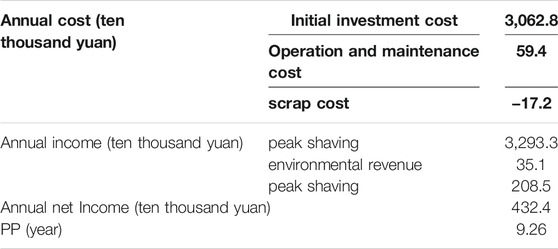
TABLE 4. Annual costs and benefits of “peak cutting and valley filling”.
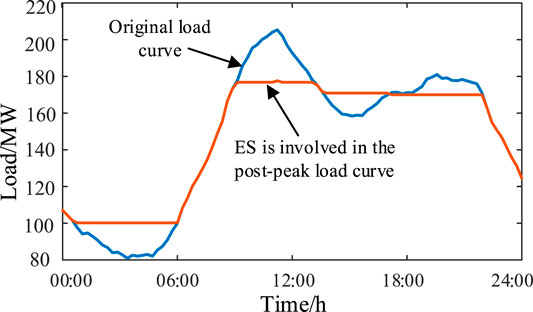
FIGURE 6. Load curve.
It can be seen from Figure 6 that the peak value of the load curve is reduced from 205.32 to 177.24 MW through the function of ES peak clipping and valley filling, and the peak clipping rate reaches 13.68%, alleviating the peak load pressure of the power grid. When combined with Table 4, the initial investment cost accounts for 98% of the total cost, and the scrap cost includes the residual value provided by the ES battery resource recovery, which is negative, showing that the scrap cost can bring additional revenue. It has a 9.26 year investment recovery duration and a 10 year ES life cycle, indicating that the cost can be recovered within the life span.
6.2.2 Economic Analysis of “Leisure Time Reuse”
Figure 7 shows the output value of ES after adopting the control strategy of “idle time reuse,” where standby is mainly to suppress equivalent load disturbance. The ES operation times and utilization rates of “peak clipping and valley filling” and “disturbance suppression” are shown in Table 5. Table 6 shows the annual cost, annual income, and annual net income under the control strategy of “off-time reuse.”
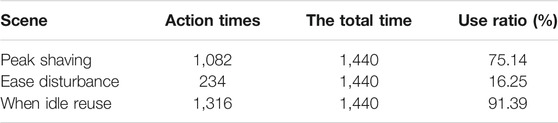
TABLE 5. ES efficiency.
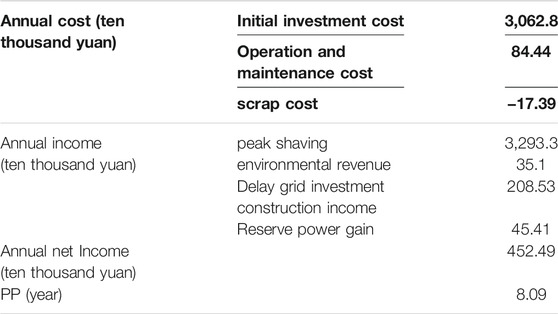
TABLE 6. Annual cost and benefit of “idle time reuse” control strategy.
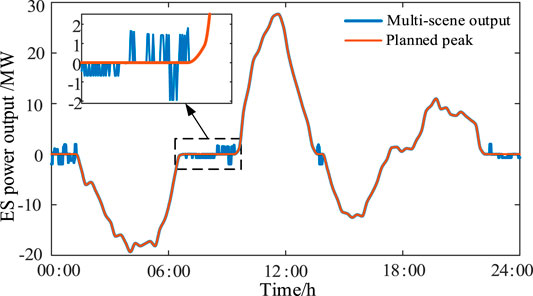
FIGURE 7. ES output in multiple peak and frequency modulation scenarios.
When the “off-time reuse” control strategy is adopted for ES, the output power of ES is consistent in the period of “peak cutting and valley filling,” as seen in Figure 7. When the system load increases, the ES discharges, and when the load decreases, the ES utilization rate effectively increases by 16.25%.
When Table 4 and Table 6 are compared, the investment and construction costs remains unchanged, while the operation and maintenance costs increase slightly, due to the standby state contributing to load disturbance suppression and increasing the number of operations. However, because the ES contributes to suppressing load disturbance during idle periods, the reserve power gain is greater than the cost. Therefore, annual net income increased by 201,200 yuan when only “peak cutting and valley filling” were used, and the investment recovery life was reduced by 1.17–8.09 years.
To summarize, by using an “off-time reuse” control method for ES, not only can annual net income be increased and the investment recovery period shortened, but also the use of ES can be effectively increased. Then, realize the dual purpose of improving ES use and grid economy, which has good research value.
6.3 Analysis of the Impact of Peak-Valley Division on ES Economy
To further analyze the impact of peak-valley time division on ES economics, an “off-time reuse” control method for ES has been adopted. Load curves in different seasons are shown in Figure 8, and curve division in peak and valley periods is shown in Figure 9. The fixed peak-valley period (see Table 2) and the “peak clipping and valley filling” period proposed in this study are divided into two periods, as shown in Table 7. PP, NPV, and IRR are shown in Table 8.
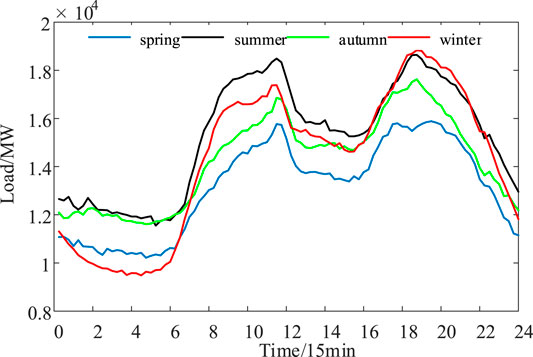
FIGURE 8. Load curves in different seasons.
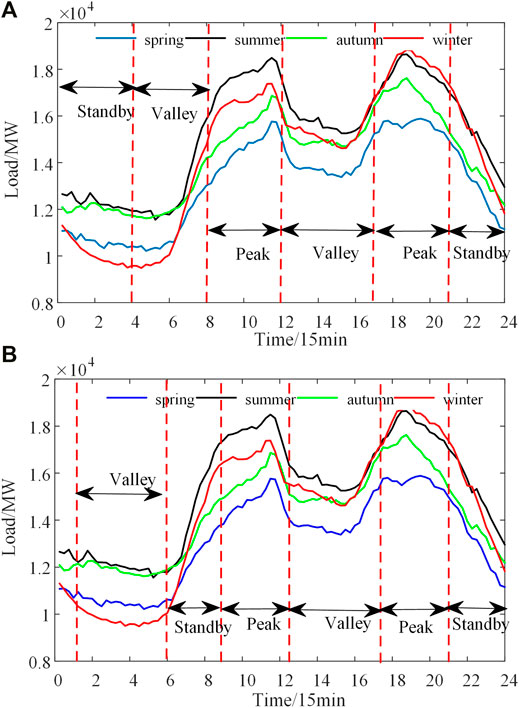
FIGURE 9. Division curves of peak and valley periods of different seasonal loads. (A) Fixed peak-valley period. (B) The improved method divides peak and valley periods.

TABLE 7. Distribution table of peak cutting and valley filling period.
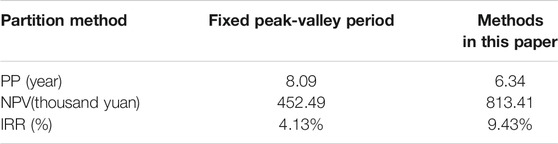
TABLE 8. Results of economic indicators.
As shown in Table 8, the PP of the ES station using the peak-valley division method presented in this study is 6.34 years, and the investment can be recovered before the battery life expires, which is 1.75 years shorter than the fixed division method. Additionally, the NPV of the ES power station is 8.1341 million yuan, which is far more than the fixed division method. Meanwhile, the IRR of ES power stations is 9.43%, which is higher than the 3.97% interest rate on 5 year Treasury bonds issued in 2020. It fully shows that the “peak cutting and valley filling” time division method with equal capacity proposed in this paper effectively improves the ES utilization rate. This is mainly because of the equal-capacity period division method. It effectively improves the peak-valley time division and the accuracy of ES scene switch, giving full play to the role of ES. However, the fixed time division method fails to give full play to the capacity of ES in the peak-valley cutting and valley filling period, thus reducing economic benefits.
6.4 Analysis of the Impact of ES Cost Evolution on Economic Critical Value
To further analyze the impact of ES cost evolution on economic critical value, assuming that the life of ES facilities is 10 years, the critical value of the peak-valley price difference between fixed and evolving costs is compared and analyzed. The cost of ES can be calculated using Eq. 31, as shown in Figure 10. The impact of ES efficiency on the profit critical price difference is shown in Figure 11. The critical value of the peak-valley price difference between an investment over its whole life cycle and fixed cost is shown in Figure 12.
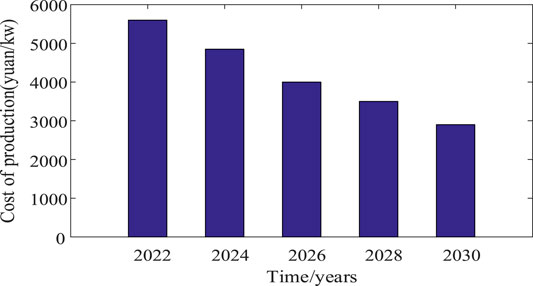
FIGURE 10. Variation trend of ES cost.
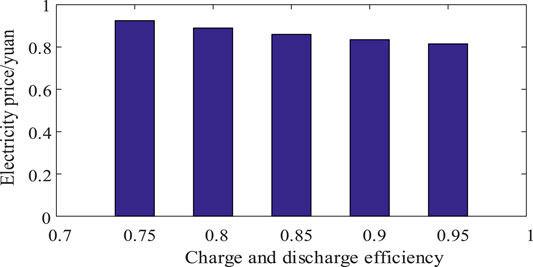
FIGURE 11. Relationship between ES efficiency and critical peak-valley price difference.
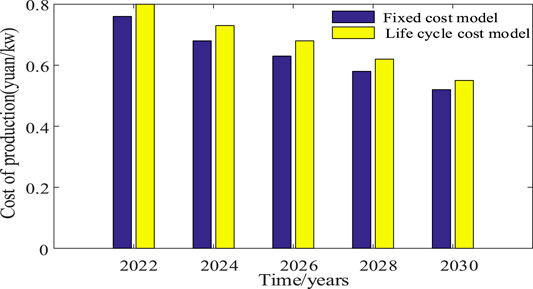
FIGURE 12. Critical peak-valley price difference under different ES cost models.
As ES technology advances, the cost of ES will gradually decrease, as shown in Figure 11. By 2030, the cost of lithium batteries will drop to about 3,000 yuan/kW. As shown in Figure 12, the charge and discharge efficiency of ES is negatively correlated with the critical peak-valley price difference for ES profit. When the efficiency is increased by 5%, the critical peak-valley price difference decreases by 0.005 yuan/kWh. This also indicates that while resolving the important peak-valley difference in ES investment profit, the charge–discharge efficiency of ES, i.e., the influence of the entire life cycle of ES, should be fully considered. The critical values of ES efficiency decline and remain constant during the entire life cycle of ES. When the influence of the entire life is considered, the critical value is relatively high, because the charge and discharge efficiency of ES decreases significantly during the construction period, and especially during the decline period.
7 Conclusion
In view of the influence of ES construction investment decision on ES production costs, market peak-valley price difference, and ES charge and discharge efficiency, a method for determining the economic boundary value of ES power market transactions is proposed. Using simulation analysis, the following conclusions can be drawn:
1) Based on the multi-purpose function of ES power station. Compared with monotone peak control, the utilization rate is increased by 16.25%, NPV is increased by 201,200 yuan and investment recovery life is shortened by 1.17 years. The proposed “peak clipping and valley filling” time division method improves the accuracy of peak and valley time division, and then realizes the accurate switch between peak and frequency modulation working state. Compared with the fixed division method, the investment recovery life is shortened by 1.75 years.
2) The whole life-cycle cost model of ES and the evolution function model of ES cost are constructed, which effectively improve the reliability of critical value, as shown in Figures 11, 12. If fixed charge–discharge efficiency is used, critical value results will be seriously affected; the critical value in 2022 is 0.76 yuan/kWh when the whole life cycle, ES aging, and other factors are not considered, while the critical value is 0.8 yuan/kWh when the aging effect is considered, and the error is as high as 5.26%.
To summarize, the method proposed in this study improves the solution model for ES investment critical value by taking into account actual operating conditions, making it consistent with the actual project, improving the reliability of the results, and providing a theoretical basis for investment enterprises to make decisions.
Data Availability Statement
The original contributions presented in the study are included in the article/Supplementary Material, further inquiries can be directed to the corresponding author.
Author Contributions
All authors have made direct contributions to the work. ZY proposed the research direction and guided the project. SD and FJ were the primary writers of the manuscript. WW and YW compiled the literature review, and proofread the manuscript.
Conflict of Interest
The authors declare that the research was conducted in the absence of any commercial or financial relationships that could be construed as a potential conflict of interest.
Publisher’s Note
All claims expressed in this article are solely those of the authors and do not necessarily represent those of their affiliated organizations, or those of the publisher, the editors and the reviewers. Any product that may be evaluated in this article, or claim that may be made by its manufacturer, is not guaranteed or endorsed by the publisher.
References
Aneke, M., and Wang, M. (2016). Energy Storage Technologies and Real Life Applications - A State of the Art Review. Appl. Energ. 179, 350–377. doi:10.1016/j.apenergy.2016.06.097
Attarha, A., Amjady, N., and Dehghan, S. (2019). Affinely Adjustable Robust Bidding Strategy for a Solar Plant Paired with a Battery Storage. IEEE Trans. Smart Grid 10 (3), 2629–2640. doi:10.1109/TSG.2018.2806403
Basu, M. (2013). Combined Heat and Power Economic Emission Dispatch Using Nondominated Sorting Genetic Algorithm-II. Int. J. Electr. Power Energ. Syst. 53 (3), 135–141. doi:10.1016/j.ijepes.2013.04.014
Cai, S., and Li, Y. (2021). Incentive Policy for Battery Energy Storage Systems Based on Economic Evaluation Considering Flexibility and Reliability Benefits. Front. Energ. Res. 9, 634912. doi:10.3389/fenrg.2021.634912
Cao, S., Zhang, H., Cao, K., Chen, M., Wu, Y., and Zhou, S. (2021). Day-Ahead Economic Optimal Dispatch of Microgrid Cluster Considering Shared Energy Storage System and P2P Transaction. Front. Energ. Res. 9, 645017. doi:10.3389/fenrg.2021.645017
Chen, J., and Song, X. (2015). Economics of Energy Storage Technology in Active Distribution Networks. J. Mod. Power Syst. Clean. Energ. 3 (4), 583–588. doi:10.1007/s40565-015-0148-5
Chen, Q., Xie, R., Chen, Y., Liu, H., Zhang, S., Wang, F., et al. (2021). Power Configuration Scheme for Battery Energy Storage Systems Considering the Renewable Energy Penetration Level. Front. Energ. Res. 9, 718019. doi:10.3389/fenrg.2021.718019
Dai, Q., Cai, T., Duan, S., and Zhao, F. (2014). Stochastic Modeling and Forecasting of Load Demand for Electric Bus Battery-Swap Station. IEEE Trans. Power Deliv. 29 (4), 1909–1917. doi:10.1109/TPWRD.2014.2308990
Dhanalakshmi, S., Kannan, S., Mahadevan, K., and Baskar, S. (2011). Application of Modified NSGA-II Algorithm to Combined Economic and Emission Dispatch Problem. Int. ournal Electr. Power Energ. Syst. 33 (4), 992–1002. doi:10.1016/j.ijepes.2011.01.014
El-Zonkoly, A. (2014). Intelligent Energy Management of Optimally Located Renewable Energy Systems Incorporating PHEV. Energ. Convers. Management 84, 427–435. doi:10.1016/j.enconman.2014.04.050
Fazelpour, F., Vafaeipour, M., Rahbari, O., and Rosen, M. A. (2014). Intelligent Optimization to Integrate a Plug-In Hybrid Electric Vehicle Smart Parking Lot with Renewable Energy Resources and Enhance Grid Characteristics. Energ. Convers. Management 77, 250–261. doi:10.1016/j.enconman.2013.09.006
Fekri Moghadam, M., Metcalfe, M., Dunford, W. G., and Vaahedi, E. (2015). Demand Side Storage to Increase Hydroelectric Generation Efficiency. IEEE Trans. Sustain. Energ. 6 (2), 313–324. doi:10.1109/TSTE.2014.2371053
Finn, P., Fitzpatrick, C., and Connolly, D. (2012). Demand Side Management of Electric Car Charging: Benefits for Consumer and Grid. Energy 42, 358–363. doi:10.1016/j.energy.2012.03.042
Jeyadevi, S., Baskar, S., Babulal, C. K., and Willjuice Iruthayarajan, M. (2011). Solving Multiobjective Optimal Reactive Power Dispatch Using Modified NSGA-II. Int. J. Electr. Power Energ. Syst. 33 (2), 219–228. doi:10.1016/j.ijepes.2010.08.017
Jiang, F., Peng, X., Tu, C., Guo, Q., Deng, J., and Dai, F. (2021). An Improved Hybrid Parallel Compensator for Enhancing PV Power Transfer Capability. IEEE Trans. Ind. Electron. 1, 1. doi:10.1109/TIE.2021.3121694
Jiang, F., Tu, C., Guo, Q., Shuai, Z., He, X., and He, J. (2019). Dual-functional Dynamic Voltage Restorer to Limit Fault Current. IEEE Trans. Ind. Electron. 66 (7), 5300–5309. doi:10.1109/TIE.2018.2868254
Krishnamurthy, D., Uckun, C., Zhou, Z., Thimmapuram, P. R., and Botterud, A. (2017). ES Arbitrage under Day-Ahead and Real Time Price Uncertainty. IEEE Tran. Power Syst. 33 (1), 84–93. doi:10.1109/TPWRS.2017.2685347
Ould Amrouche, S., Rekioua, D., Rekioua, T., and Bacha, S. (2016). Overview of Energy Storage in Renewable Energy Systems. Int. J. Hydrogen Energ. 41 (45), 20914–20927. doi:10.1016/j.ijhydene.2016.06.243
Padmanabhan, N., Ahmed, M., and Bhattacharya, K. (20202019). Battery Energy Storage Systems in Energy and Reserve Markets. IEEE Trans. Power Syst. 35, 215–226. doi:10.1109/TPWRS.2019.2936131
Qin, Y. F. (2020). Research on the Economic Evaluation and Transaction Optimization Model of ES System under the Market Environment. [dissertation/master’s thesis]. [Beijing(China)]: North China Electric Power University.
Sigrist, L., Lobato, E., and Rouco, L. (2013). Energy Storage Systems Providing Primary reserve and Peak Shaving in Small Isolated Power Systems: An Economic Assessment. Int. J. Electr. Power Energ. Syst. 53, 675–683. doi:10.1016/j.ijepes.2013.05.046
Song, Z., Zhang, J., Zheng, Z., and Xiao, X. (2019). Peak Dispatching for Wind Power with Demand-Side Energy Storage Based on a Particle Swarm Optimization Model. Utilities Policy 56, 136–148. doi:10.1016/j.jup.2018.12.003
Srinivas, N., and Deb, K. (1994). Muiltiobjective Optimization Using Nondominated Sorting in Genetic Algorithms. Evol. Comput. 2 (3), 221–248. doi:10.1162/evco.1994.2.3.221
Wang, L. (2020). Research on Multi-Objective Optimization Algorithm Based on Genetic Algorithm [dissertation/master’s Thesis. [Wuhan(HB)]. Wuhan University of Technology.
Zhang, C., Qiu, J., Yang, Y., and Zhao, J. (2021). Trading-oriented Battery Energy Storage Planning for Distribution Market. Int. J. Electr. Power Energ. Syst. 129, 106848. doi:10.1016/j.ijepes.2021.106848
Keywords: accumulation energy, peak shaving, idle hours reuse, cost evolution function, peak-valley price difference boundary, genetic algorithm
Citation: Dai S, Ye Z, Wei W, Wang Y and Jiang F (2022) Economic Analysis of Transactions in the Energy Storage Power Market: A Life-Cycle Cost Approach. Front. Energy Res. 10:845916. doi: 10.3389/fenrg.2022.845916
Received: 30 December 2021; Accepted: 25 January 2022;
Published: 03 March 2022.
Edited by:
Liansong Xiong, Nanjing Institute of Technology (NJIT), ChinaReviewed by:
X. Gao, University of Kiel, GermanyHuiming Zhang, Nanjing University of Information Science and Technology, China
Copyright © 2022 Dai, Ye, Wei, Wang and Jiang. This is an open-access article distributed under the terms of the Creative Commons Attribution License (CC BY). The use, distribution or reproduction in other forums is permitted, provided the original author(s) and the copyright owner(s) are credited and that the original publication in this journal is cited, in accordance with accepted academic practice. No use, distribution or reproduction is permitted which does not comply with these terms.
*Correspondence: Ze Ye, eWV6ZTIwMDNAcXEuY29t