- 1Department of Automation, Hangzhou Dianzi University, Hangzhou, China
- 2School of Electrical and Control Engineering, Henan University of Urban Construction, Pingdingshan, China
- 3Electric Power Research Institute, Beijing, China
With increasing penetration of renewable energy, it is important to source adequate system flexibility to maintain security of supply and minimize renewable generation curtailment. Power to hydrogen (P2H) plays an important role in the low-carbon renewable dominated energy systems. By blending green hydrogen produced from renewable power into the natural gas pipelines, it is possible to help integrate large-scale intermittent generation and smooth the variability of renewable power output through the interconnection of the natural gas network, hydrogen energy network, and electric network. A two-stage stochastic mixed-integer nonlinear planning framework for P2H sizing and siting is proposed in this paper, considering system flexibility requirements. The problem is then reduced to a mixed-integer second-order cone (MISOC) model through convex transformation techniques in order to reduce the computation burden. Then, a distributed algorithm based on Bender’s decomposition is applied to obtain the optimal solution. A modified hybrid IEEE 33-node and Gas 20-node system is then used for simulation tests. The results showed that investment of P2H can significantly reduce the total capital and operational costs with lower renewable generation curtailment and electricity demand shedding. Numerical tests demonstrated to demonstrate the validity of the proposed MISOC model.
1 Introduction
Over the recent years, various renewable energies, such as solar power and wind power, have seen rapid development. However, the connection of large-scale renewable energy to the electric network has dramatically changed the characteristics and increased the uncertainty of power flow, posing significant challenges to system operations in terms of power balancing and load following. Flexible resources, such as demand-side response, large-scale energy storage, power to hydrogen, etc., are the key to integrating large-scale renewable generation.
For environmental reasons, coal-fired generations are gradually being phased out, leading to a scarcity of flexible resources. As a result, energy storages, such as pumped storage, compressed air energy storage, chemical battery storage, etc., have developed by leaps and bounds in recent years. However, the development of large-scale pumped storage and compressed air storage is constrained by geographic and geological conditions. Chemical battery storage is not limited by geography, but their discharge time is 1 min–8 h (Mongird et al., 2019) and is suitable for medium- or short-term (Zablocki, 2019) use. As hydrogen has the appealing characteristics of being stored for the longer term and on a large scale, hydrogen energy storage has the prospects of being used as a long-term or seasonal energy storage. With the high penetration of renewable energy, the green hydrogen produced by P2H using surplus renewable energy can be stored on a large scale or used as an industrial raw material.
As a result, over the past few years, the development of green hydrogen has attracted the increasing attention of researchers and governments due to its characteristics of a high energy density and the ability to store it in large quantities. The total abandoned renewable energy has decreased from 312.523 to 66.797 MWH with the presence of power to hydrogen (Heris et al., 2020). To reduce CO2 emissions, the cost-optimal design and operation of power to gas in Germany are studied in depth (Welder et al., 2018). In addition, the value of hydrogen storage in pipes and salt caverns has been analyzed (Welder, 2018).
In addition, Ref. Dolci et al. (2019) and Hu et al. (2020) present the power-to-hydrogen pathways, and the technical advances and barriers to green hydro development are also given. The green hydrogen-based power-to-gas facility is investigated in Germany and Texas in Glenk and Reichelstein (2019), which shows that green hydrogen production is already cost-competitive in niche applications. With ultra-high penetration of renewable energy, an optimal planning model (Pan, 2020) for electricity–hydrogen integrated energy systems considering power to hydrogen and seasonal storage is constructed in Pan et al., (2020). Li et al. (2019) have developed operation optimization modeling of power to hydrogen in active distribution networks coordinated with the district heating network (Li et al., 2019). Gils et al. (2019) have investigated the transition pathway toward a climate-neural energy system in Germany and concluded that hydrogen plays a critical role in the seasonal balance of power supply and demand but cannot completely replace other coupling options (Gils et al., 2021).
Hydrogen is an important industrial raw material, and it is only economically beneficial to convert hydrogen into methane when subsidies are provided (Robinius et al., 2017). Liu et al. (2020) indicate that both power to hydrogen (P2H) and power to methane (P2M) help to reduce operational costs and decrease CO2 emissions. From the perspective of energy system operation, the impact of P2H on the system flexibility is analyzed (Cloete and Hirth, 1922) in Cloete et al. (2020) and Ge et al. (2020) . With the increasing penetration level of renewable energy, the traditional grid is evolving into a new energy system with widespread participation of variable generation and flexible demand (Gea-Bermúdez et al., 2021). The large-scale, long-duration energy storage devices will be one of the key enablers in the low-carbon renewable-dominated energy systems. To improve the management efficiency and deal with the stochastic nature of renewable energy, this paper aims to investigate the site selection and optimal capacity determination approach of large-scale energy storage technologies, also known as P2H, and their role in enhancing system flexibility.
The contributions and innovations of this article are as follows: first, a two-stage stochastic mixed-integer planning framework for P2H sizing and siting is proposed, considering the uncertainty of the renewable energy output and the investment cost of the P2H equipment. The model’s objective was to minimize the investment cost, operation cost, renewable output curtailment cost, and electricity demand shedding cost. Second, by blending permissible green hydrogen produced from surplus renewable energy into the natural gas pipelines, the effects of the injected hydrogen concentration on the gas pipeline transmission coefficient, that is, gas specific gravity, net calorific value, gas compressibility factor, etc., were investigated. Third, based on the system flexibility supply–demand balance mechanism, we quantified the enhanced effect of P2H on hourly system flexibility.
The rest of this article is organized as follows: the low-carbon-emission hybrid renewable energy system structure is proposed in Section 2, and the modeling of renewable energy and load demand uncertainties are also described. In Section 3, a two-stage stochastic planning model of P2H has been constructed, considering system flexibility and hydrogen injections. The nonlinear nonconvex terms are simplified to obtain a mixed-integer second-order cone (MISOC) programming model in Section 4. In Section 5, a distributed algorithm for the model is designed based on Bender’s decomposition and cut plane. Simulations are carried out to verify the effectiveness of the proposed MISOC model and solution algorithm in Section 6. The conclusion is illustrated in Section 7.
2 Integrated Electricity–Hydrogen-Gas System
2.1 System Description
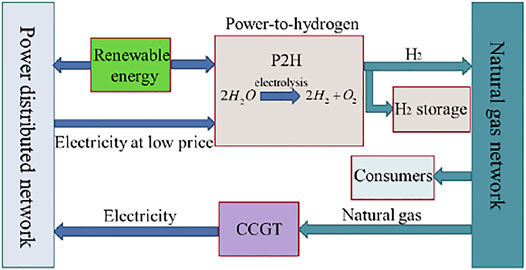
The integrated electricity–hydrogen-gas energy system is illustrated in Figure 1. It consists of the power system, natural gas distribution system, and carbon-free hydrogen system. The interaction between the power system and the natural gas system is realized mainly through a combined cycle gas turbine (CCGT). The CCGT generation unit with a fast-responding, high efficiency uses natural gas from the distribution gas system to generate electricity. The connection of large-scale renewable energy to the distribution network makes it possible to produce hydrogen by electrolyzing water with renewable energy. It is worth noting that hydrogen is more accessible to store for long periods than electricity. Therefore, hydrogen storage technology can be used as a medium- or long-term energy storage option for excess renewable energy. In this article, green hydrogen produced by surplus renewable energy sources plays a vital role in the integrated electricity distribution system, natural gas system, and hydrogen energy system. Power-to-hydrogen devices make full use of surplus renewable energy, and it is then blended and injected into the existing gas distribution pipeline with a maximal volumetric limit proportion of 15% hydrogen.
In future high-renewable energy penetration scenarios, the uncertainty and intermittence of renewable energy output will significantly impact supply power reliability. To deal with these problems, the system’s flexibility needs to be enhanced urgently. Based on the characteristics of flexible resources in the distribution network, we have developed a system flexibility supply and demand balance model. In addition, considering the direct injection of hydrogen produced by P2H into the natural gas pipelines, the hydrogen concentration on the gas specific gravity, the calorific value, and the compressibility factor have been investigated. Finally, a two-stage stochastic planning model is constructed with the objective of minimizing the investment and operation costs during the planning horizon. In the proposed hybrid energy system, we consider several renewable energy generation units, such as wind turbines and photovoltaics, equipped in the system. To promote renewable energy consumption and enhance the system’s flexibility, the investment cost of P2H and the renewable energy curtailment cost are included as one of the optimization objectives. Scenario generation and reduction methods have been utilized to address renewable energy sources and load uncertainty.
2.2 Uncertainty Modeling and Scenario Generation
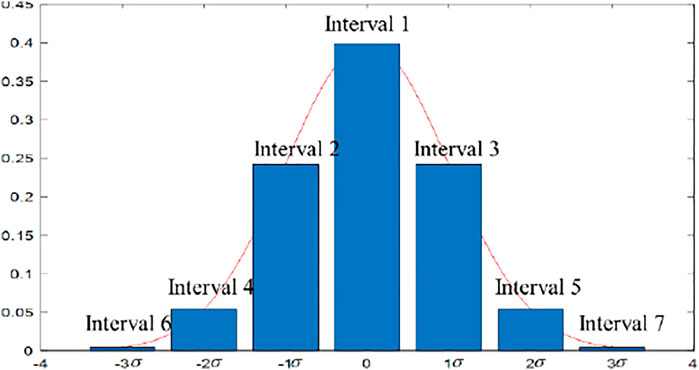
A scenario-based approach is adopted to deal with the uncertainty and stochastic characteristics of renewable output and electrical load demand (Dagoumas and Koltsaklis, 2019). For the sake of simplicity, renewable generation output and load can be modeled as follows:
The forecast errors,
where
Then, the corresponding cumulative distribution functions (CDFs) are calculated separately using the probability density functions for the discrete intervals described above. Based on Monte Carlo simulations, two random variables,
The probabilities of the generated scenarios are listed as follows, and the sum of the probabilities of all scenarios equals to 1
Due to a large number of scenarios, it will lead to the burden of computation. It is generally essential to balance the solving tractability and the modeling accuracy. Therefore, the scenario reduction techniques using the fast forward algorithm (Hajiabbas and Mohammadi-Ivatloo, 2020) are listed as follows:
where
After obtaining the first selected scenarios through the above steps, the distance between the chosen and nonselected scenarios is calculated, and the set of scenes chosen is updated
Finally, the probabilities of the reduced scenarios are calculated. The probability of a nonselected scenario is added to the probability of a selected scenario that is close to it. The specific calculation is as follows:
3 Optimal P2H Planning Considering Flexibility Requirements in an Integrated Multi-Vector Energy System
In this section, a two-stage stochastic dynamic mixed-integer nonlinear programming model is constructed for optimal P2H planning to minimize the investment and annual operation costs (Bramstoft et al., 2020) of integrated multi-vector energy systems.
3.1 The Objective Function
The optimal P2H planning problem considering the system flexibility requirement can be formulated as the following stochastic model:
subject to
The objective function (9) comprises two terms: P2H investment cost
3.2 Operation Constraints
3.2.1 Power Distribution Network
The power flow equations of the radial distribution network can be presented by the DistFlow model, which can be seen as follows (Li et al., 2020):
Eq. 17 above can be modified with high penetration renewable energy connection as follows:
where
We can depict the boundary constraints in the power distribution network as follows:
Equation 21 constrains the power balance at node
3.2.2 Natural Gas Distribution Network
The steady-state flow equation Eq. 20 related to the pressure of gas and the flow rate in the distributed gas network is depicted as follows:
where
It is important to note that the gas thermal–physical properties change with its composition (Deymi-Dashtebayaz et al., 2019). When green hydrogen produced from renewable energy sources is injected into a natural gas pipeline, the gas thermo-physical properties vary with the hydrogen concentration, which can be described below:
where
In addition to the above constraints, certain boundary constraints need to be considered
Equations 35, 36 enforce limits on the pressure of the gas node and the flow rate in each pipeline. Equations 37, 38 indicate the upper and lower bounds for natural gas source output and shedding gas load.
Pressure drops occur during the transmission of natural gas. Therefore, a compressor is placed in the natural gas pipeline to maintain the nodal pressure at the required level. Equation 39 indicates the gas pressure relationship at nodes i and j.
Considering the effect of hydrogen injection, the energy balance equation for each natural gas distribution network node is formulated as follows:
where
3.2.3 Flexibility Supply and Demand Balance
When renewable energy’s share is relatively low, the volatility and uncertainty have less impact on the energy system. At this stage of the planning process, the flexibility supply and demand balance in the system is usually not considered for the time being. However, with a high proportion of renewable energy, insufficient flexibility supply can lead to a large number of renewable energy curtailments, which prevents the system from operating correctly (Koltsaklis and Dagoumas, 2018). Therefore, the system’s flexibility is quantified in the process of optimizing the size of P2H.
Flexibility in the integrated energy system is characterized by multiple time scales, locations, and directions (Agbonaye et al., 2021). From the prospect of time scale, system flexibility can be categorized into very short-term ramp (
Flexibility resources such as P2H, CCGT, etc., are introduced to supply flexibility. Of these, P2H, CCGT, and system power purchase can provide both upward and downward flexibility, while wind abandonment can only provide downward flexibility, and shedding load can only supply upward flexibility. The detailed formulae are shown below:
where
Equations 43, 45, 47, 49 define the upward flexibility capacity, and Eqs 44, 46, 48, 50 explain the downward flexibility capacity. It is also observed that Eqs 51, 52 give the total flexibility supply capacity.
The flexibility demand arises mainly from fluctuations in the net load. Therefore, the proposed hybrid system’s upward and downward flexibility demand can be described by the following equations:
The system flexibility supply–demand equilibrium equation is as follows:
Equations 56, 57 emphasize that the system’s ability to supply flexibility is greater than the demand for flexibility.
3.2.4 Modeling of Energy Coupling Devices
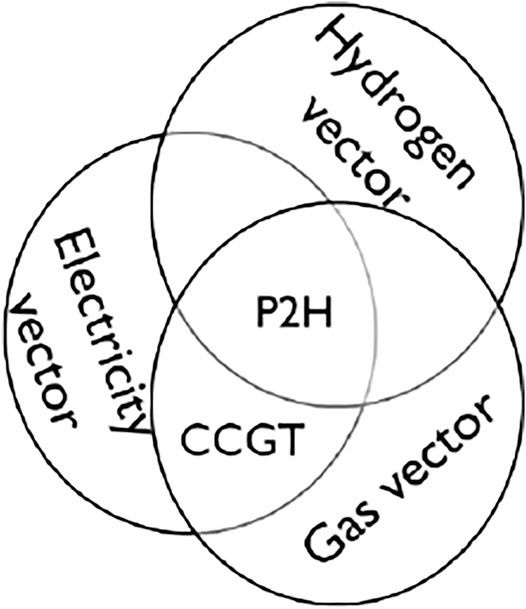
A schematic of the coupling relation between electricity–gas-hydrogen energy networks is illustrated in Figure 3. P2H plays a crucial role in coupling multi-energy networks, and CCGT links the gas networks and power grid effectively.
The simplified P2H and CCGT models are given in the following equations:
where
4 Model Simplications
The model constructed above is a mixed-integer nonlinear nonconvex programming model, which is difficult to solve quickly and efficiently. It is therefore essential to simplify the model to reduce the computational burden.
The nonlinear terms
There are quadratic terms in Eq. 30, so Eq. 30 is nonlinear and nonconvex. The results tend to fall into the local optimum, and it is not easy to obtain the global optimum exactly. Here, Eq. 30 can be reformulated as follows:
Let
Let
Equation 66 can be further relaxed to
For the line
5 Distributed Algorithms Based on Bender’s Decomposition and Cut Plane
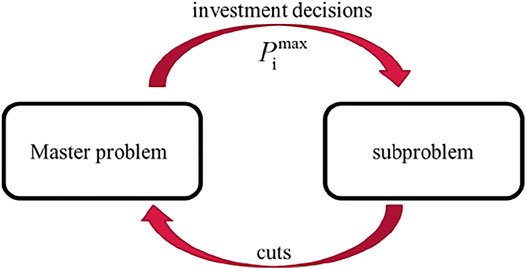
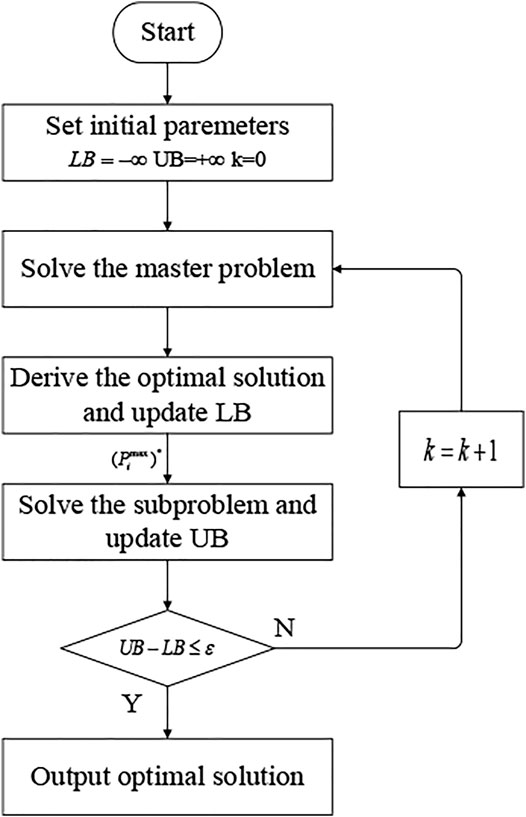
Since large-scale mixed-integer programming models are difficult to solve in an efficient and quick manner, this section develops a distributed algorithm based on Bender’s decomposition (Gharaei et al., 2019). The basic idea of the distributed algorithm is to group the constraints and variables of a complex problem into more minor and easily tractable master problems and subproblems, which is shown in Figure 4.
The section below details the master problem and the subproblem based on Bender’s decomposition and cut plane. The master problem with respect to the problem Eq. 9 is formulated as follows (Conejo et al., 2006):
This is subject to constraints Eq. 12–Eq. 15, Eq. A3, and Eq. 74.
The subproblem related to Eq. 9 is depicted below:
The dual variables
The detailed interactions between the master problem and the subproblem are presented below.
Step 1. Initialization. Set
Step 2. Solve the aforementioned master problem Eq. 76 to obtain the optimal values
Step 3. Call the commercial solver Gurobi to solve the subproblem in (78) and update the upper bound
Step 4. If
6 Case Study and Discussion
6.1 Description of Test Systems
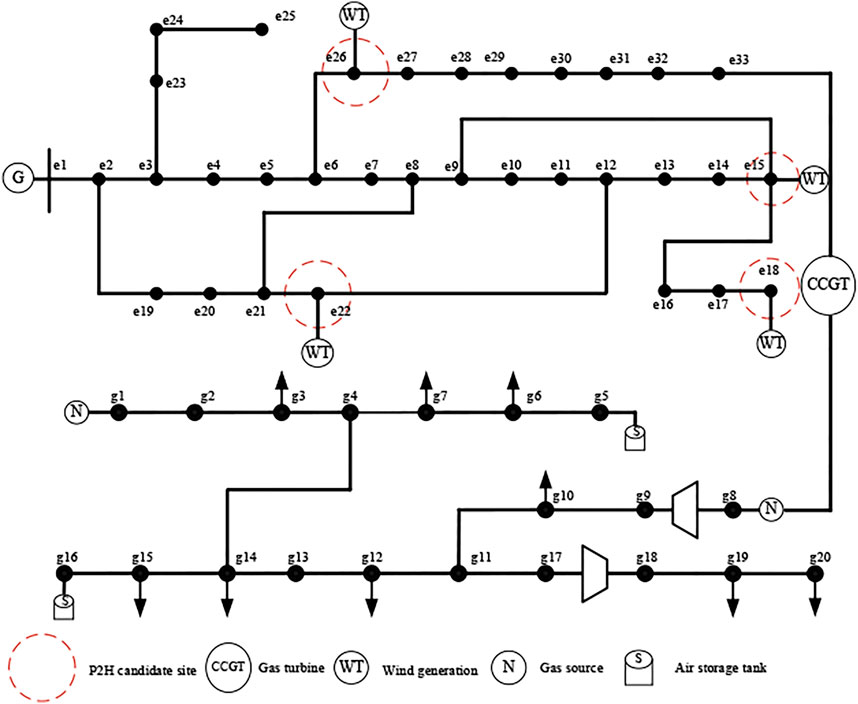
In this section, simulations are carried out to verify the effectiveness of the proposed MISOC model and solution algorithm. The configuration of the simulation test systems is presented in Figure 6, which is composed of a modified IEEE 33-bus distributed network and a Belgian 20-node gas network comprising two gas compressors, four gas sources, and 1 CCGT. The wind turbine capacity installed at bus 15 is 3 MW, and the other three 1 MW wind units are located at buses e18, e22, and e26. The installed capacity of the CCGT unit at bus e33 is 1 MW, which obtains its gas supply from node g8. In addition, two gas compressors are employed in the distribution gas network to manage the gas pressures in the gas network. The CCGT unit is the coupling device between the electricity and gas system. It is worth noting that the variables
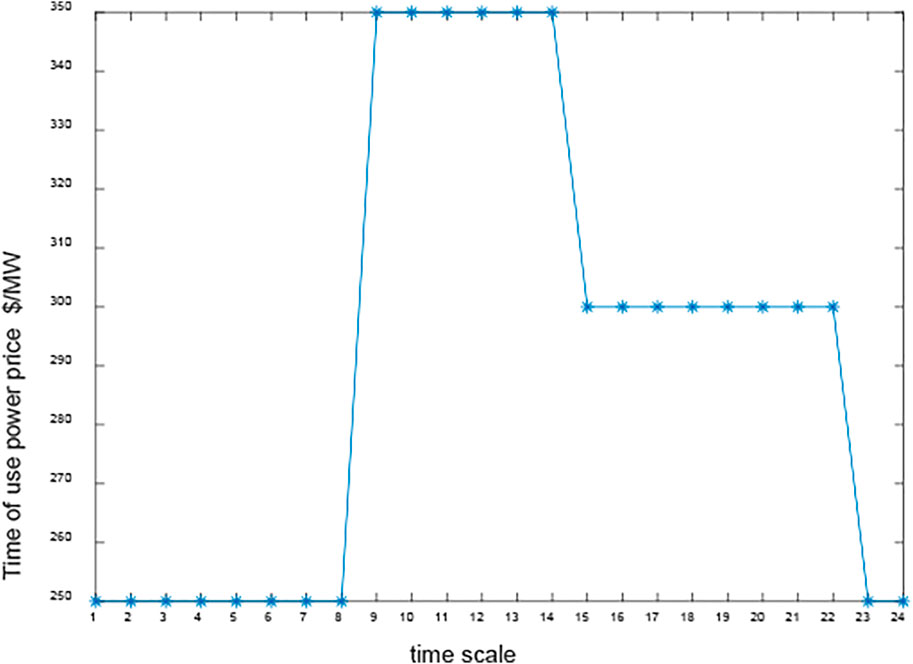
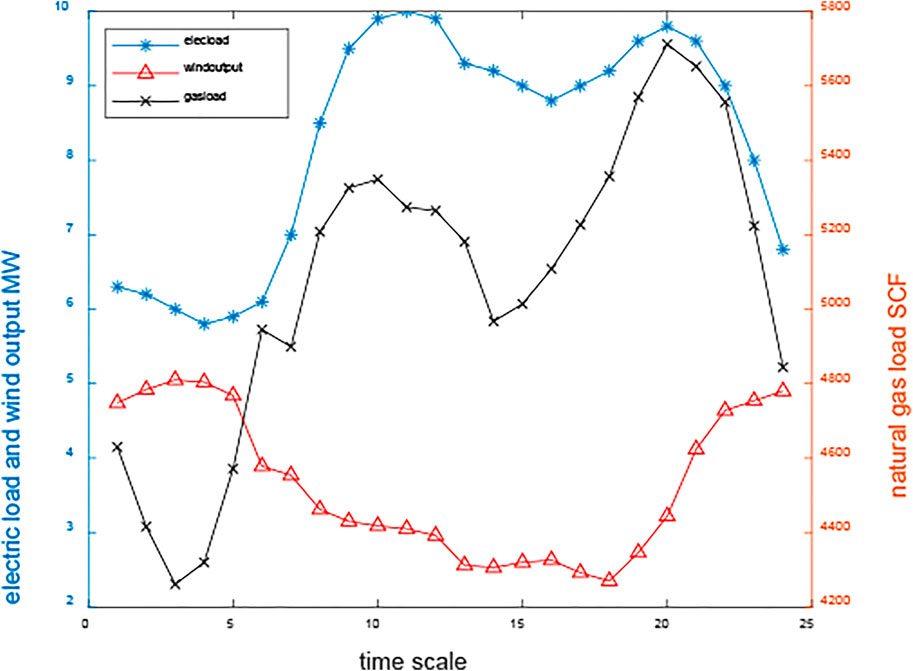
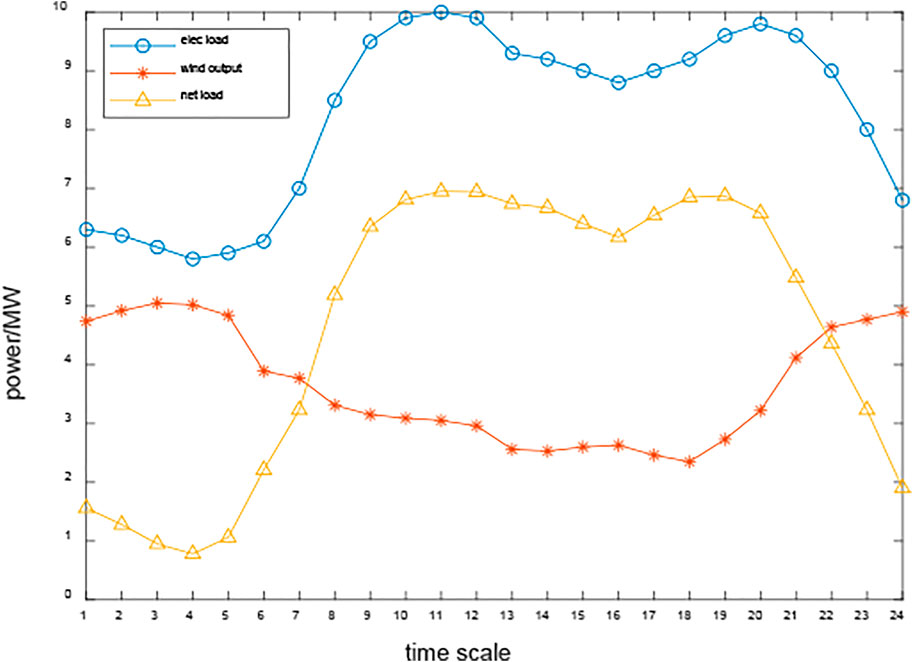
The time-of-use electricity price is illustrated in Figure 7. The predicated electrical load, the wind output power, and the gas load of the hybrid renewable energy system are shown in Figure 8. Based on Monte Carlo simulation and scenario reduction techniques, these data were used to generate the 10 operation scenarios for the study. The system net load is depicted in Figure 9. With high penetration renewable energy connection, it can be seen that the peak-valley difference of the demand becomes greater. At the same time, the net load profile varies more steeply. Therefore, it is urgent to enhance the system’s flexibility and promote the consumption of renewable energy.
The other parameters used in the simulation are depicted in Table 1, and some of them can be found in Ref. Menon, 2005.
6.2 Simulation Results
In order to verify the performance and effectiveness of the two-stage MISOC model and the distributed solution algorithm proposed in this article, two cases are designed for comparative analysis. The simulations are carried out on a laptop with Intel i7-9750H CPU and 16 GB memory.
Case 1. Basic scenario, optimal operation of the hybrid renewable energy system without P2H. The case mainly analyzes the total operation costs without P2H.
Case 2. Comprehensive scenario, coordinated operation, and planning of the hybrid renewable energy system with P2H, the flexibility, and hydrogen injections are also taken into account. The case primarily discusses the total investment and operation costs of the system, and it also focuses on the impact of P2H on the system flexibility.
6.2.1 Planning and Operation Result Analysis
The annual total costs of the two cases are provided in Table 2, including investment costs, purchased electricity costs, purchased gas costs, renewable energy curtailment costs, the electricity load-shedding cost, and the gas load-shedding cost. A comparison of the data in the sixth and seventh columns of Table 2 shows that after the construction of P2H, the renewable output curtailment cost drops from M$ (million dollars) 0.6524 to M$0.027705, and the electricity demand shedding cost decreases from M$0.21681 to M$0. It can also be seen that the annual total cost of case 2 is reduced by M$0.794 compared to case 1 by reducing the renewable energy curtailment costs and the load-shedding costs. Although the capital costs of P2H exist in Case 2, the annual total cost is still lower than that of case 1. In the meantime, we conclude that the abandoned wind power reaches 0.1814 and 0.1981 MW in Case 2, which occurs at wind turbines 1 and 2 at 3 a.m. 4 a.m., respectively. This phenomenon occurs largely because the wind speed is higher, and wind turbines produce more power when the electrical load is lower.
The planning results of P2H in Case 2 are shown in Table 3. It is shown that the installed capacity of P2H at buses 15, 18, and 26 is 469.7, 803, and 189 kW, respectively. The total investment cost of P2H is M$1.8998. The life cycle of P2H is assumed to be 10 years. Therefore, the annual investment cost is M$0.28313, considering the interest rate. It is worth noting that the capacity of the wind generator equipped at bus 15 is 3 MW, which is larger than the other three. Meanwhile, the electricity demand in this area is high, and the wind power output is mainly supplied to the electrical consumers. Thus, the capacity of P2H installed at bus 15 is lower than that of bus 18.
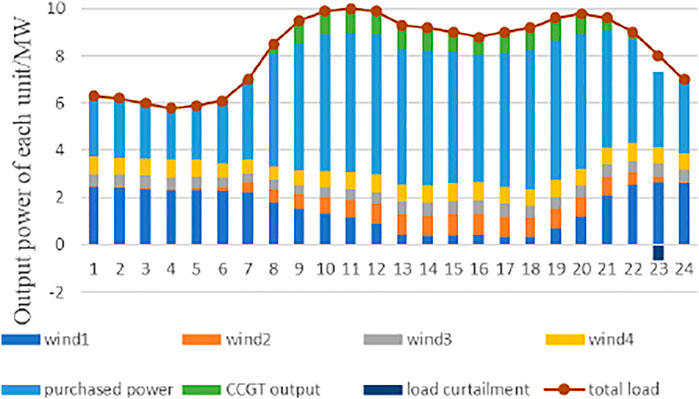
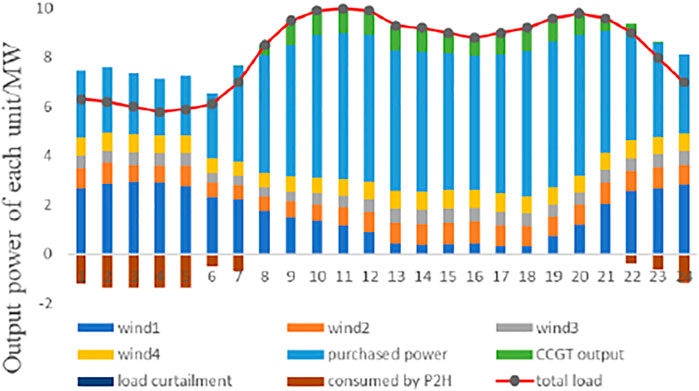
Take scenario 5 as an example. The optimal generator outputs of two cases in the hybrid renewable energy system are shown in Figures 10, 11. In this scenario, the renewable energy penetration level is 40%. As demonstrated from Figures 4, 10, wind generators, the distribution system operator, and the CCGT unit supply the electrical load demand to the end users, and the electrical load shedding mainly occurs at 11 p.m. P2H participates in the operation of the system as a flexible unit in Case 2. As shown in Figure 11, in Case 2, four wind generators, one CCGT unit, and the distributed system operator serve as the source to supply electricity to the consumers and P2H. The higher wind speeds from 1 to 7 a.m. make the wind turbine generators output more power. However, the power demand of end users is low during this time. P2H produces hydrogen using surplus wind power to reduce renewable curtailment. At 8 in the morning, the electrical load demand increases sharply, and the output of the wind turbines decreases, at which point the CCGT unit starts to supply the electrical load. The electrical load peaks at 10 a.m. and 11 a.m. When the CCGT unit output reaches its maximum power, P2H does not consume power. The electricity price is high at this stage, so the electricity purchase is less. With the gradual reduction of power load demand, the output power of the CCGT unit decreases. From 10 to 12 p.m., the electricity load gradually decreases. On the contrary, the wind generators’ output increases. The P2H units consume surplus renewable energy to produce hydrogen during this period, and the CCGT generator does not supply electricity to consumers.
As can be seen from Figure 11, case 2 yields smaller load-shedding and renewable energy curtailment than case 1. P2H plays a vital role in promoting the consumption of renewable energy.
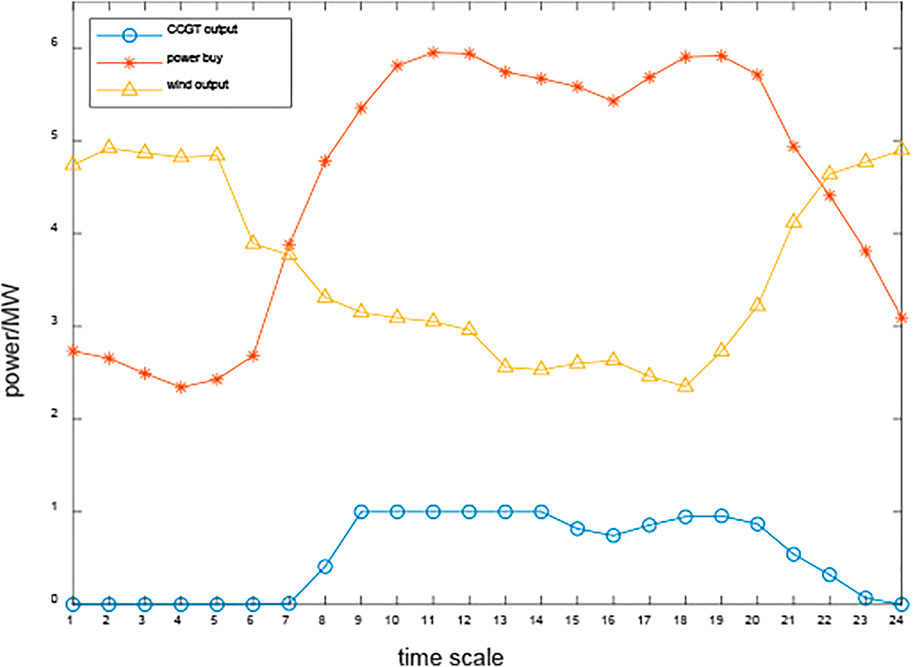
The power output of the CCGT unit, the power purchased from the grid, and the four wind generators of case 2 are shown in Figure 12.
6.2.2 System Flexibility Analysis
This part investigates the hybrid renewable energy system’s flexible supply and demand balance. The effect and role of P2H in system flexibility supply are evaluated by comparing the results of the two cases.
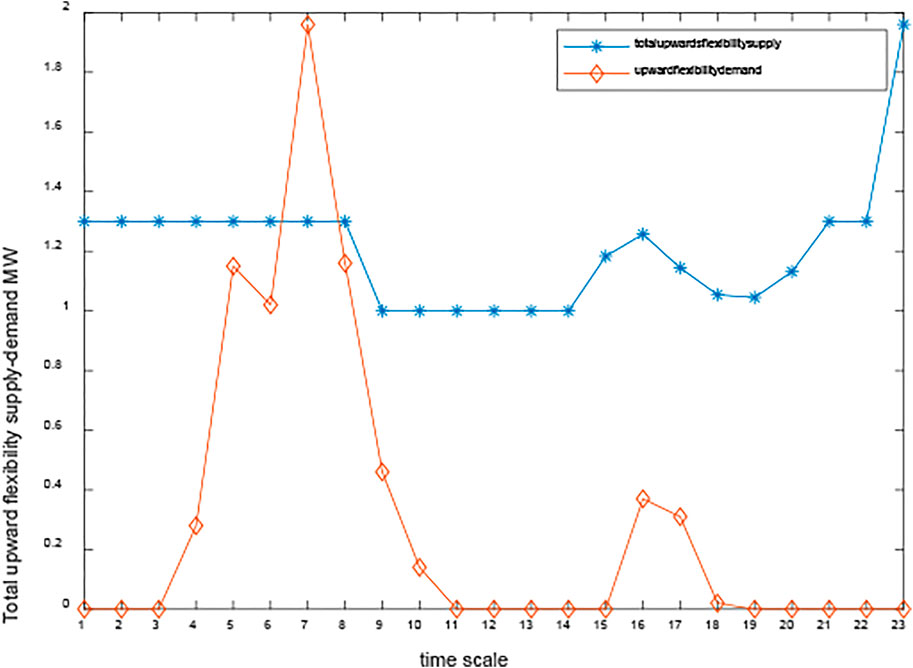
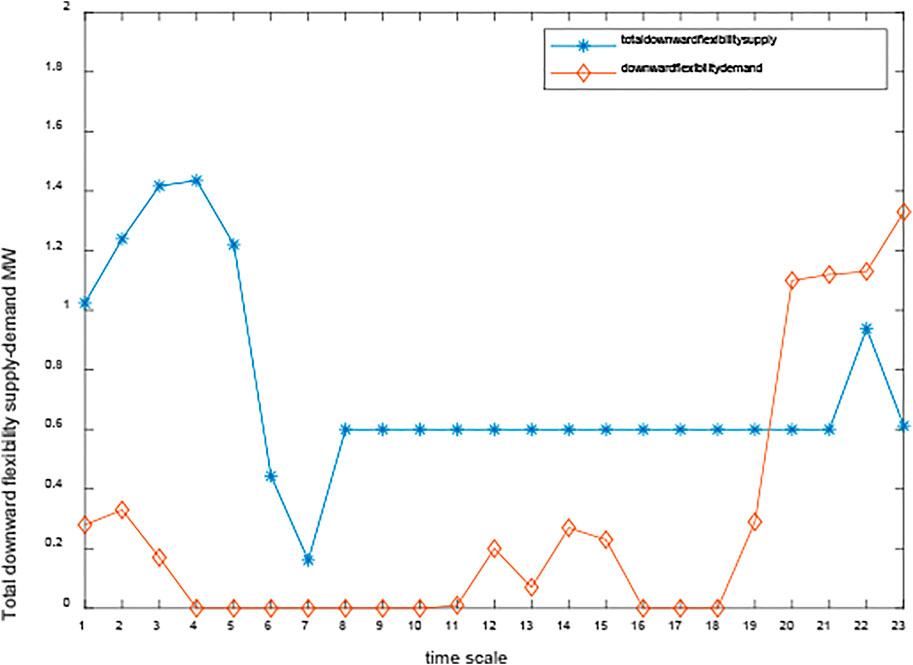
The total upward/downward flexibility supply and demand of case 1 are comparatively studied in Figures 13, 14. As shown in Figure 13, the blue line represents the total upward flexibility supply, and the orange line indicates the upward flexibility demand. We can also learn from Figure 13 that the demand for upward flexibility is greater at 6, 7, and 8 a.m. and reaches its maximum at 7 a.m. At 7 in the morning, the upward flexibility adequacy is less than 0, which indicates that upward flexibility supply is less than upward flexibility demand. Figure 14 illustrates the total downward flexibility supply and demand of case 1. We can learn from the following figure that there is a greater need for downward flexibility from 8 to 11 p.m. During this period, the supply of downward flexibility has not been able to meet the demand for downward flexibility, and there has been a shortage of downward flexibility.
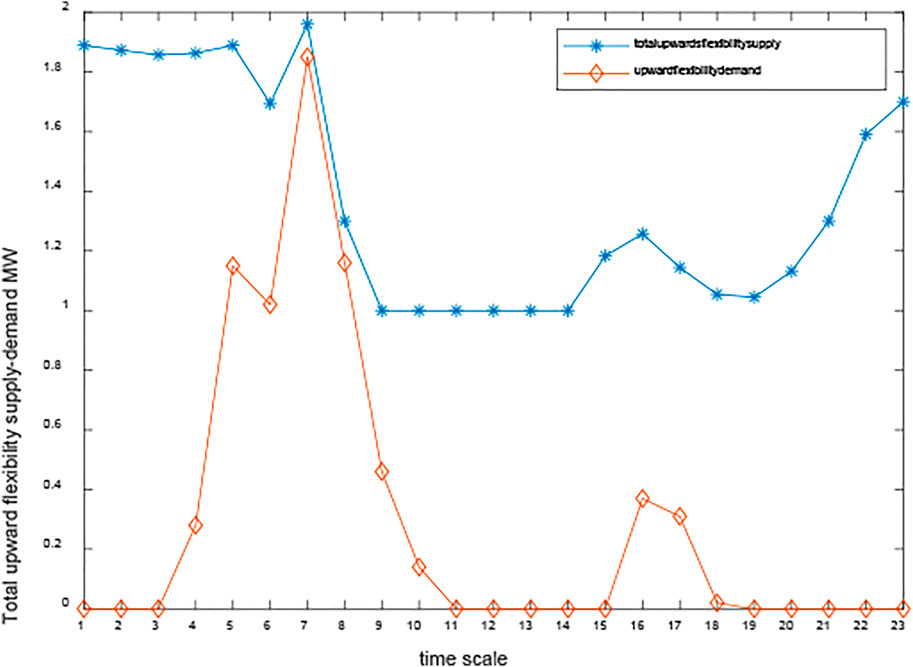
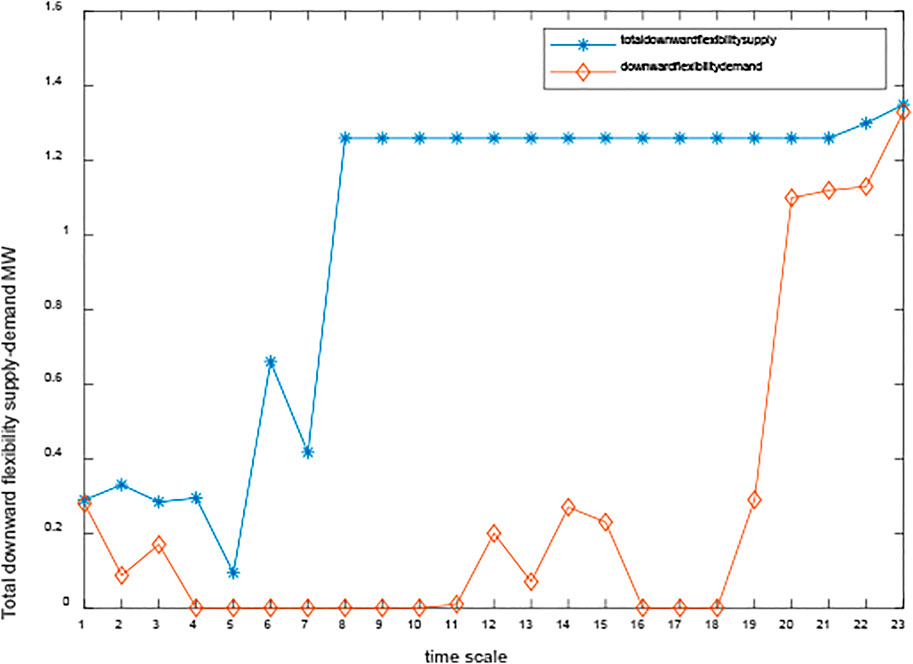
The total upward/downward flexibility supply and demand of case 2 are shown in Figures 15, 16, respectively. It is shown in Figure 15 that there is a greater need for upward flexibility during the period from 6 to 8 a.m. However, after the construction of P2H, the lack of upward flexibility no longer exists with the coordinated optimization of flexibility resources. As can be seen in Figure 15, the same phenomenon is present in downward flexibility. By comparing Figure 13 with Figure 15 and Figure 14 with Figure 16, we can conclude that the system flexibility can be effectively enhanced after the construction of P2H, which helps promote the consumption of renewable energy.
7 Conclusion
This article proposes a low-carbon-emission hybrid renewable energy system to utilize power, hydrogen, and natural gas in an integrated mode. The P2H element serves as a key multi-energy coupling device connecting the distributed power network and gas and hydrogen networks.
In order to cope with the uncertainty of power load and renewable energy output, multiple operating scenarios are generated based on Monte Carlo simulations and the fast forward algorithm. Then, a two-stage stochastic planning model is constructed to consider the hybrid energy system flexibility and hydrogen injections. The nonlinear, nonconvex terms in the model are simplified, and a MISOC programming model is constructed to reduce the computation burden and further improve the solving efficiency. The results obtained by solving the above MISOC model using the distributed algorithm validate the effect of the construction of P2H.
Simulation results show that P2H can effectively reduce renewable energy curtailment, thus promoting the renewable energy consumption. On one hand, the upward/downward flexibility of the system has been enhanced by coordinating P2H and other flexibility resources. On the other hand, by injecting the hydrogen produced by P2H into the gas-distributed pipeline, the cost of hydrogen is effectively decreased, while reducing the system’s CO2 emissions.
Due to fluctuations in renewable energy output, the operational efficiency of electrolysis equipment is challenging to achieve in practice, and the actual available capacity of the equipment is reduced.
Data Availability Statement
The original contributions presented in the study are included in the article/Supplementary Material, further inquiries can be directed to the corresponding author.
Author Contributions
JW, writing the original draft, conceptualization, formal analysis, methodology and writing programs; PZ, writing, review and editing, conceptualization and investigation; YL, funding acquisition, project administration, supervision; JL, conceptualization, writing, review and editing.
Funding
This work was supported by funds provided via the National Key Research and Development Program of China (Grant No. 2018YFE0208400). The authors are also grateful for the support from the Science and Technology Project of State Grid Corporation of China (Key Technologies of Novel Integrated Energy System Considering Cross-border Interconnection).
Conflict of Interest
The authors declare that the research was conducted in the absence of any commercial or financial relationships that could be construed as a potential conflict of interest.
Publisher’s Note
All claims expressed in this article are solely those of the authors and do not necessarily represent those of their affiliated organizations or those of the publisher, the editors, and the reviewers. Any product that may be evaluated in this article or claim that may be made by its manufacturer is not guaranteed or endorsed by the publisher.
References
Agbonaye, O., Keatley, P., Huang, Y., Ademulegun, O. O., and Hewitt, N. (2021). Mapping Demand Flexibility: A Spatio-Temporal Assessment of Flexibility Needs, Opportunities and Response Potential. Appl. Energ. 295, 117015. doi:10.1016/j.apenergy.2021.117015
Bobo, L., Venzke, A., and Chatzivasileiadis, S. (2021). Second-order Cone Relaxations of the Optimal Power Flow for Active Distribution Grids: Comparison of Methods. Int. J. Electr. Power Energ. Syst. 127, 106625. doi:10.1016/j.ijepes.2020.106625
Bramstoft, R., Pizarro-Alonso, A., Jensen, I. G., Ravn, H., and Münster, M. (2020). Modelling of Renewable Gas and Renewable Liquid Fuels in Future Integrated Energy Systems. Appl. Energ. 268, 114869. doi:10.1016/j.apenergy.2020.114869
Cloete, S., and Hirth, L. (1922). Flexible Power and Hydrogen Production: Finding Synergy between CCS and Variable Renewables. Energy 192, 116671. doi:10.1016/j.energy.2019.116671
Conejo, A. J., Baringo Morales, L., Kazempour, S. J., and Siddiqui, A. S. (2016). Investment in Electricity Generation and Transmission. Springer Nat. doi:10.1007/978-3-319-29501-5
Conejo, A. J., Castillo, E., Minguez, R., and Garcia-Bertrand, R. (2006). Decomposition Techniques in Mathematical Programming:Engineering and Science Applications. Springer, 558.
Dagoumas, A. S., and Koltsaklis, N. E. (2019). Review of Models for Integrating Renewable Energy in the Generation Expansion Planning. Appl. Energ. 242, 1573–1587. doi:10.1016/j.apenergy.2019.03.194
Deymi-Dashtebayaz, M., Ebrahimi-Moghadam, A., Pishbin, S. I., and Pourramezan, M. (2019). Investigating the Effect of Hydrogen Injection on Natural Gas Thermo-Physical Properties with Various Compositions. Energy 167, 235–245. doi:10.1016/j.energy.2018.10.186
Dolci, F., Thomas, D., Hilliard, S., Guerra, C. F., Hancke, R., Ito, H., et al. (2019). Incentives and Legal Barriers for Power-To-Hydrogen Pathways: An International Snapshot. Int. J. Hydrogen Energ. 44, 11394–11401. doi:10.1016/j.ijhydene.2019.03.045
Ge, P., Hu, Q., Wu, Q., Dou, X., Wu, Z., and Ding, Y. (2020). Increasing Operational Flexibility of Integrated Energy Systems by Introducing Power to Hydrogen. IET Renew. Power Generation 14, 372–380. doi:10.1049/iet-rpg.2019.0663
Gea-Bermúdez, J., Jensen, I. G., Münster, M., Koivisto, M., Kirkerud, J. G., Chen, Y.-k., et al. (2021). The Role of Sector Coupling in the green Transition: A Least-Cost Energy System Development in Northern-central Europe towards 2050. Appl. Energ. 289, 116685. doi:10.1016/j.apenergy.2021.116685
Gharaei, A., Karimi, M., and Hoseini Shekarabi, S. A. (2019). Joint Economic Lot-Sizing in Multi-Product Multi-Level Integrated Supply Chains: Generalized Benders Decomposition. Int. J. Syst. Sci. Operations Logistics 7, 309–325. doi:10.1080/23302674.2019.1585595
Gils, H. C., Gardian, H., and Schmugge, J. (2021). Interaction of Hydrogen Infrastructures with Other Sector Coupling Options towards a Zero-Emission Energy System in Germany. Renew. Energ. 180, 140–156. doi:10.1016/j.renene.2021.08.016
Glenk, G., and Reichelstein, S. (2019). Economics of Converting Renewable Power to Hydrogen. Nat. Energ. 4, 216–222. doi:10.1038/s41560-019-0326-1
Hajiabbas, M. P., and Mohammadi-Ivatloo, B. (2020). Optimization of Power System Problems _Methods, Algorithms and MATLAB Codes. Springer 262. doi:10.1007/978-3-030-34050-6
Heris, M.-N., Mirzaei, M. A., Asadi, S., Mohammadi-Ivatloo, B., Zare, K., Jebelli, H., et al. (2020). Evaluation of Hydrogen Storage Technology in Risk-Constrained Stochastic Scheduling of Multi-Carrier Energy Systems Considering Power, Gas and Heating Network Constraints. Int. J. Hydrogen Energ. 45, 30129–30141. doi:10.1016/j.ijhydene.2020.08.090
Hu, G., Chen, C., Lu, H. T., Wu, Y., Liu, C., Tao, L., et al. (2020). A Review of Technical Advances, Barriers, and Solutions in the Power to Hydrogen (P2H) Roadmap. Engineering 6, 1364–1380. doi:10.1016/j.eng.2020.04.016
Koltsaklis, N. E., and Dagoumas, A. S. (2018). State-of-the-art Generation Expansion Planning: A Review. Appl. Energ. 230, 563–589. doi:10.1016/j.apenergy.2018.08.087
Li, J., Lin, J., Song, Y., Xing, X., and Fu, C. (2019). Operation Optimization of Power to Hydrogen and Heat (P2HH) in ADN Coordinated with the District Heating Network. IEEE Trans. Sustain. Energ. 10, 1672–1683. doi:10.1109/tste.2018.2868827
Li, R., Chen, L., Yuan, T., and Li, C. (2020). Optimal Dispatch of Zero-Carbon-Emission Micro Energy Internet Integrated with Non-supplementary Fired Compressed Air Energy Storage System. J. Mod. Power Syst. Clean Energ. 4, 566–580. doi:10.1007/s40565-016-0241-4(2016).20Menon
Liu, J., Zeng, P. P., Xing, H., Li, Y., and Wu, Q. (2020). Hierarchical Duality-Based Planning of Transmission Networks Coordinating Active Distribution Network Operation. Energy 213, 118488. doi:10.1016/j.energy.2020.118488
Lu, Z., Li, H., and Qiao, Y. (2018). Probabilistic Flexibility Evaluation for Power System Planning Considering its Association with Renewable Power Curtailment. IEEE Trans. Power Syst. 33, 3285–3295. doi:10.1109/tpwrs.2018.2810091
Mongird, K., Fotedar, V., Viswanathan, V., and Koritarov, V. (2019). Energy Storage Technology and Cost Characterization Report.
Pan, G., Gu, W., Lu, Y., Qiu, H., Lu, S., and Yao, S. (2020). Optimal Planning for Electricity-Hydrogen Integrated Energy System Considering Power to Hydrogen and Heat and Seasonal Storage. IEEE Trans. Sustain. Energ. 11, 2662–2676. doi:10.1109/tste.2020.2970078
Robinius, M., Welder, L., and Ryberg, D. S. (2017). “Power-to-hydrogen and Hydrogen-To-X:Which markets?Which Economic potential?Answers from the Literature,” in 14th International Conference on the European Energy Market (EEM).
Singh, M. K., and Kekatos, V. (2020). Natural Gas Flow Solvers Using Convex Relaxation. IEEE Trans. Control. Netw. Syst. 7, 1283–1295. doi:10.1109/tcns.2020.2972593
Welder, L., Ryberg, D. S., Kotzur, L., Grube, T., Robinius, M., and Stolten, D. (2018). Spatio-temporal Optimization of a Future Energy System for Power-To-Hydrogen Applications in Germany. Energy 158, 1130–1149. doi:10.1016/j.energy.2018.05.059
Zablocki, A. (2019). Fact Sheet Energy Storage. Washington, DC: Environmental and Energy Study Institute.
Appendix AModel Simplifications
Term
Equations 43–48 are of the form
where
The nonlinear term
where
Nomenclature
Binary Variable
I The P2H device is built or not (1:‘built’, 0:‘not’)
x Gas flow direction, (1:‘the gas flow rate is positive’ and 0: ‘otherwise’)
Sets
Continuous variables
Parameters
Keywords: power to hydrogen (P2H), hydrogen injections, system flexibility, low carbon, benders decomposition
Citation: Wang J, Zeng P, Li Y and Liu J (2022) Optimal Capacity Planning of Power to Hydrogen in Integrated Electricity–Hydrogen–Gas Energy Systems Considering Flexibility and Hydrogen Injection. Front. Energy Res. 10:845637. doi: 10.3389/fenrg.2022.845637
Received: 30 December 2021; Accepted: 10 March 2022;
Published: 12 April 2022.
Edited by:
Weihao Hu, University of Electronic Science and Technology of China, ChinaReviewed by:
Yanfei Li, Hunan University of Technology and Business, ChinaNikolaos Koltsaklis, Czech Technical University in Prague, Czechia
Shutang You, The University of Tennessee, Knoxville, United States
Copyright © 2022 Wang, Zeng, Li and Liu. This is an open-access article distributed under the terms of the Creative Commons Attribution License (CC BY). The use, distribution or reproduction in other forums is permitted, provided the original author(s) and the copyright owner(s) are credited and that the original publication in this journal is cited, in accordance with accepted academic practice. No use, distribution or reproduction is permitted which does not comply with these terms.
*Correspondence: Pingliang Zeng, cGx6ZW5nQGhvdG1haWwuY29t
 Jinpeng Wang
 Pingliang Zeng1*