 Jun Wu
 Rui Qiu
 Mingyue Wang2
- 1School of Electrical Engineering and Automation, Wuhan University, Wuhan, China
- 2School of Electronic Information and Electrical Engineering, Shanghai Jiao Tong University, Shanghai, China
To realize low-carbon energy systems, distributed energy storage systems and flexible loads have been integrated into power grids. System reliability, economy, and resilience, therefore, face significant challenges. This article presents modeling of a distributed energy micro-grid including wind turbines, micro gas turbines, waste heat recovery devices, electric boilers, direct-fired boilers, battery energy storage, interruptible loads, and transferable loads. At the same time, the optimal configuration of energy storage and the demand-side response modeling are studied, and the combined optimization control strategy of the two is demonstrated. The simulation results indicate that the proposed control strategy has better performance than the traditional operation. In addition, this article also clarifies the impact of control strategy on distribution system resilience. The results show that the control strategy proposed in this article can achieve the resource complementarity of demand-side response and energy storage, and realize the integrated coordination of source, network, load, and storage. The distributed energy micro-grid under this control strategy has the best overall economic benefit and the best capacity to accommodate load growth.
Introduction
It has been extensively reported that distributed renewable energy power generation technology provides useful solutions to the energy crisis and excessive carbon emissions (Iqbal and Siddiqui, 2017). However, the direct connection between distributed renewable energy units and distribution networks will affect the original power flow distribution status and short-circuit current characteristics (Zho et al., 2021). The uncertainty of renewable energy is likely to cause problems in the reliability of the energy supply, leading to the reconfiguration of protection and control systems (Tian et al., 2020). A distributed energy micro-grid is a good solution to these problems. The United States Electrical Reliability Technical Measures Solutions Association and the European Union Micro-grid Project define a micro-grid (Muhammad Arif et al., 2020) as a small energy system composed of distributed units, loads, energy storage, power electronic devices, communication equipment, power transmission lines, and other facilities. It supplies users with energy such as cooling, heating, and electricity and can be regarded as a unified and schedulable whole. The distributed energy micro-grid is mainly divided into two types according to the operation mode: grid-connected and independent (Wenwu et al., 2018). The independent micro-grid has a weak connection with the utility grid. Because of its small scale and great sensitivity to uncertain factors, it has high requirements on flexible resource utilization, operating economy, and energy supply reliability. With the help of the independent micro-grid, it is possible to supply loads in areas far from the utility grid such as mountainous areas, islands, offshore oil platforms, etc. Besides, it can achieve complementary coordination of cooling, heating, and electricity. This micro-grid can bring superior social benefits (FENG et al., 2020). Therefore, it is of great significance to study the modeling of distributed energy micro-grid and explore how to establish a control strategy for fully and flexibly calling toward the various resources in the micro-grid, which makes the micro-grid better in operational reliability, economy, and resilience.
Power system resilience is an important criterion to assess the ability of a system to adapt and recover from the significant power outages caused by accidents, deliberate attacks, or natural disasters. During this period, electric utilities desire to serve as much load as possible and to minimize the penalty cost for load shedding, which is a critical measure of distribution system resilience (Ma et al., 2018). There are approaches to enhance resilience, one of them is to increase the penetration of distributed energy resources (Shi et al., 2020). For some areas, rapid load growth is also a threat to system resilience. Therefore, studying the impact of a distributed energy system on load growth after adopting a control strategy can reflect the impact on system resilience. The operation of a micro-grid requires the support of various resources that can be flexibly invoked. In terms of power supply, the scheduling technology for conventional units has matured. However, problems such as uncertain output and wind abandonment still exist. As far as energy load, demand-side response (DR) resources can be flexibly invoked, and the DR technology enables both sides of supply and demand to participate in the optimal scheduling simultaneously. Qi et al. (2021) proposed a scheduling strategy that considers DR classification and segmented participation in multi-timescale source–load coordination. This method can effectively reduce the cost of scheduling operations and promote the utilization of renewable energy. Duan (2016) introduced a price-based demand bidding mechanism, which effectively stabilizes load fluctuations in dispatch. This bidding mechanism brings the surplus adjustable capacity to the source side and increases the social welfare of the power system. China has already implemented guidelines and interface standards for power systems and DR technology. Nonetheless, large-scale and automatic DR cannot be carried out with the limitation of imperfect policies and regulations (Zhang et al., 2014). Meanwhile, the personalized demand on the load side prevents excessive interference in energy usage upon scheduling. Therefore, only a few loads can participate in DR. When considering DR in the process of optimizing operation, it is necessary to arrange an appropriate load response plan to achieve a win–win situation between supply and demand. In addition, energy storage has attracted attention due to its advantages including bidirectional power flow, energy transfer across time, and low environmental impact. The configurations of electric energy storage and power control in the micro-grid can resolve uncertainties and improve the reliability of the energy supply (Bahramirad et al., 2012). Hajipour et al. (2015) carried out a micro-grid electric energy storage plan based on the Monte Carlo method. This plan proved that electric energy storage can effectively handle uncertain factors and possess economic competitiveness. Ding et al. (2011) adopted a new type of battery to optimize the operation of the micro-grid. This type of energy storage has a special operating environment and high management costs, and it has little effect on the cost cutting of the micro-grid operation. Considering the high cost and environmental pollution, it is important to configure electrical energy storage rationally before optimizing an operation. In the process of optimizing the configuration of energy storage, the complementation of resources in the distributed energy micro-grid should be considered. At this time, considering DR is expected to make the plan more economical and has better operating performance. Tao et al. (2017) employed variable participation frequency to control refrigerator temperature control load and optimized the configuration of electric energy storage based on the probability planning method. The results demonstrated that the DR resource can partially replace the electric energy storage and improve the economics of the micro-grid. Shi (2018) optimized the dual-layer configuration of wind power and energy storage with the load transfer, translation, and reduction being considered. The result proved that the proposed DR method can cut operating costs, improve power supply reliability, and reduce the configuration requirements for electrical energy storage.
Existing research does not comprehensively consider factors such as reservation of conventional units, thermal power compensation, and waste heat depletion of the combined heat and power (CHP) system or clarify the impact on distribution system resilience. Based on the establishment of a distributed energy micro-grid model, the control strategy introduced in this article explores the abovementioned problems. The strategy uses the integrated time series of typical days in the four seasons and the idea of cost discounting to optimize the configuration of energy storage. It also implements the flexible deployment of multiple resources such as conventional units, wind turbines, DR, and electrical energy storage in multiple time nodes. In the process of energy storage configuration optimization, this article compares the difference between whether to involve DR. The results show that involving DR is beneficial to reduce energy storage configuration capacity. This article creates four combination modes of DR and energy storage, and the control model is solved by GAMS to minimize the accumulative cost for dispatchable DER operation. According to the results, the operational reliability, economy, and interference to energy consumption behavior of the four modes are compared. Calculations are performed to illustrate the impact on distribution system resilience. This article reveals a control strategy that comprehensively considers reservation of conventional units, thermal power compensation, waste heat depletion of the combined heat and power system, optimal configuration of energy storage and the DR, and the impact on distribution system resilience. The strategy shows good performance in promoting the integrated coordination of source, network, load, and storage of a distributed energy micro-grid, improving the reliability of energy supply, cutting operating costs, reducing the interference to energy consumption, increasing system resilience, and advocating a way to guide the planning of work in areas with a high load growth rate.
Resource Modeling in Independent Micro-Grid
Main Structure of Independent Micro-Grid
The main structure of a CHP-independent micro-grid is shown in Figure 1. The micro gas turbine is a gas–electric coupling device. The waste heat recovery device is a gas–heat coupling device. The direct-fired boiler is a gas–heat coupling device, and the electric boiler is an electric–heat coupling device. The electric load is divided into conventional electric load and electric boiler. Both conventional electric load and heat load participates in DR partly. The electric energy storage is treated as an electric energy transfer station.
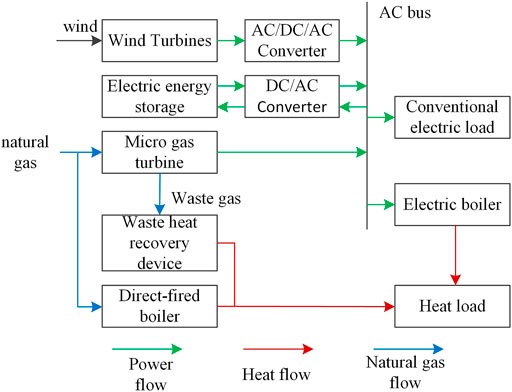
FIGURE 1. Schematic diagram of an isolated combined heat and power micro-grid.
Unit Modeling
The mathematical models of conventional controllable distributed thermal power units such as micro gas turbines and waste heat recovery devices, electric boilers, and direct-fired boilers are given in Supplementary Appendix (Tao et al., 2017). And the active power output characteristics of wind turbines can be found in the Supplementary Appendix (Shi, 2018).
DR Resources
The current DR strategy is mainly composed of price type and incentive type (Luo et al., 2020). The price-based DR uses a pricing mechanism to guide users to respond to changes in energy supply prices actively. Incentive DR signs an agreement between the energy supply side and the user side and grants subsidies to users to obtain direct load management rights. The real-time power balance of the system is maintained by invoking interruptible and transferable loads and other resources. The agreement routinely stipulates the limit on the number of loads participating in DR and other factors. Compared with the price-based DR, incentive type one has a shorter response time, more flexible method, and more obvious effect. The subsidy paid in this way is smaller than the penalty fee caused by load shedding, which is beneficial to cutting operating costs. In this article, the independent micro-grid does not involve electronic transactions with the utility grid. The user-side information is not transparent. The responses under the price-based DR cannot be certainly described and is difficult to be reflected in the optimization model. Therefore, the incentive-based DR is selected. Taking into account the incentive-type DR, the electric and heat load components are decomposed as in Eqs 1, 2:
where
Q represents the heat load, where the subscripts have the same meaning as those mentioned above, and the units of the above load items are all kW.
Electric Energy Storage
Electric energy storage is mainly divided into power type and energy type according to their technical characteristics. As far as the independent micro-grid optimization, the main consideration is the energy-type electric energy storage possessing high energy density. Pumped water storage and compressed air energy storage are not commonly used due to the constriction of resource and geographical conditions. Battery storage (BS) has been widely used in modern power systems owing to its characteristics of commercialization and large-scale energy storage. For example, BS can be used for the operating power supply of power plants and substations or as the backup energy of AC uninterrupted power supply (Zhu et al., 2014). Recently, the performance of BS has been improved, and the cost has declined. With rational configuration, its technical benefits and economic investment can be balanced. Therefore, we selected BS to form an electric energy storage system and involved the flexible invocation of BS resources in the independent micro-grid optimal scheduling.
For BS unit b, the main technical parameters are as follows: rated capacity
Optimization Model
Cost Calculation
1) Total cost of independent micro-grid operating expenses:
The calculation of the total cost of independent micro-grid operating expenditures within the simulation duration
where
The specific calculation formula of the above variables are given in Supplementary Appendix.
2) Cost of BS configuration conversion:
The calculation of the cost of optimizing the configuration of the BS converted to the value
where
Constraints
3) The switch state of the micro-gas turbine and action variable constraints can be found in Yun et al. (2020), and the specific computational formulas are provided in the Supplementary Appendix.
4) The upper and lower limits of the active output of the micro gas turbine:
Standby is the additional unit capacity of the power system to ensure safe and stable operation when the power system is subject to uncertain factors. The adjusted reserve is used to balance the forecast error of the wind turbine output, and the spinning reserve is used to deal with accidents. The upper and lower limits of the active power output of the micro gas turbine are shown in Eq. 7:
where
5) The climbing constraints of micro gas turbines are detailed in the Supplementary Appendix.
6) The upper and lower limits of the power of the electric boiler and the heating power of the direct-fired boiler are given in the Supplementary Appendix.
7) The actual active power output of the wind turbine and the wind curtailment power constraints are given in the Supplementary Appendix.
8) The load shedding power constraints are given in Eqs 8, 9:
where
9) The DC power flow constraints are provided in the Supplementary Appendix. The independent micro-grid in this work has less load and the phenomenon of branch power flow exceeding the limit is not easy to occur. Thus, only the direct current wave is considered, and this can meet the requirements for the electric network part.
10) Constraints in DR:
(a) The upper and lower limits of interruptible and transferable load are given in Eqs 10–15:
where
(b) Interruption duration constraint of the interruptible load is given by:
where
(c) Constraint on the total number of cut offs of interruptible loads is given by:
where
(d) Interruption time interval constraint of the interruptible load is given by:
where n(i) is the minimum value of the time interval between the two load cut off of the node, and V(i,t) is the 0–1 variable that indicates whether the node is interrupted during the t period.
(e) Constraints of transferable load balance
It is assumed that the transferable load needs to be met within 1 day to control the impact of load movement on users. Then, the total load moved in by a node in 1 day should equal the total load moved out by the node:
where L is the number of days included in the simulation duration.
11) BS operation constraints:
Assuming that the parameters of all BS units are the same and that the initial state of charge and charging and discharging behaviors of the BS units of the same node are consistent, the constraints that need to be met by the BS unit group of a node can be listed as follows:
(a) The upper and lower limits of charge and discharge power and the upper and lower limits of the state of charge are given in the Supplementary Appendix.
(b) BS power constraint at the end of the cycle:
At the end of a BS work cycle (1 day), the power stored in the BS unit group of each node
12) BS configuration constraints which include constraints on the number of BS units allowed to be installed on a single node and the total number of BS units allowed to be installed in the network has been provided by Yun et al. (2020). See the Supplementary Appendix for specific formulas.
13) Power balance constraint
(a) Considering the active power balance constraint of DR and BS configuration at the same time, as given in Eq. 21:
where
(b) Considering the thermal power balance constraint of the DR and BS configuration at the same time, as given in Eq. 22:
Because heat is easy to lose during transmission, a thermal power compensation coefficient
Strategy of BS Optimal Configuration Considering DR
The BS optimal configuration based on specific data is an important prerequisite for optimal scheduling. The modeling of configuration includes two aspects: constraints and optimization goals.
14) Constraints: all constraints listed in Constraints.
15) Optimization goals: solving the number of access nodes and units of the BS to minimize the value of
Control Strategy Considering DR and BS Configuration
16) Constraints: constraints (1)–(9) and (11) in Constraints.
17) Optimization objective: solving the planned output value of the thermal power unit, the consumed wind power and abandoned wind power, and the thermal power load removal during the day to be dispatched. To formulate the BS charge and discharge, load interruption, and transfer plan to minimize the value of
Calculation Examples and Analysis
Basic Parameter Settings
We built an independent micro-grid model of combined heat and power based on the IEEE 33-node system. Based on the optimized configuration of BS, the independent micro-grid optimized dispatching takes into account DR and the configuration of BS. The model contains 30 load nodes, 32 lines (numbered branch1–branch32), 16 micro gas turbines and the corresponding heat recovery devices (numbered CG1–CG16), two wind turbines (WT1 and WT2), one direct-fired boiler (DB), and two electric boilers (EB1 and EB2). Assuming that the access node of the unit has been given, the information of each node in the micro-grid can be obtained and is provided in Supplementary Appendix Table SB1. The system voltage is 10 kV, and the reference capacity S base is 10 MVA. Thus, the standard unit value of the electrical network parameters can be obtained and is listed in Supplementary Appendix Table SB2. The configuration of the independent micro-grid network is shown in Figure 2. Node 13 is a phase reference node.
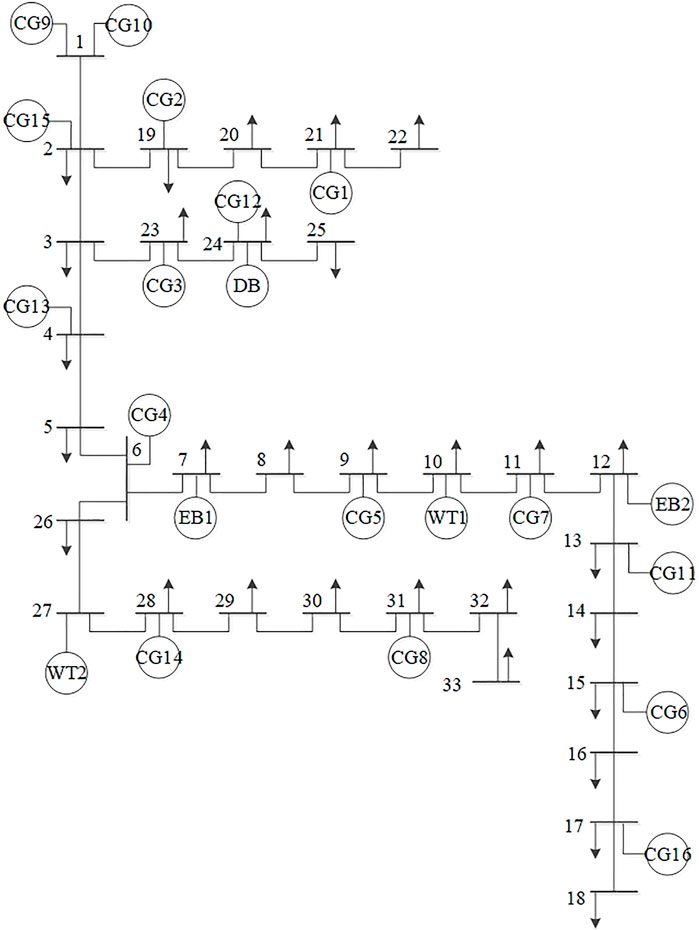
FIGURE 2. Diagram of network of the isolated micro-grid.
WT1 and WT2 have the same parameters:
It is assumed that the predicted values of the electrical load and thermal load of node i in time period t are expressed in the form of “load base value at node i predicted value of load rate in time period t.” The base value of the electrical load and thermal load of each node is shown in Supplementary Appendix Table SB4. The DR related parameters were set as follows:
The BS unit parameters are selected as follows:
BS Optimized Configuration Parameter Settings
Considering long-term operation and multiple load conditions, we selected the typical daily data of the independent micro-grid for the four seasons to optimize the configuration of the number of BS access nodes and units. To avoid the different configuration results of each typical day caused by solving in the unit of day, the four curves of typical days in the four seasons are integrated into a single curve which are in the order of spring, summer, autumn, and winter. The forecast values of the output of a single wind turbine is shown in Figure 3, and the forecast values of the electric and heat load rate are shown in Figure 4. Then, the simulation time of the BS optimal configuration model T(96 h) can be obtained, including the number of BS working cycles, L = 4. Additionally, both are set as 0.1%.
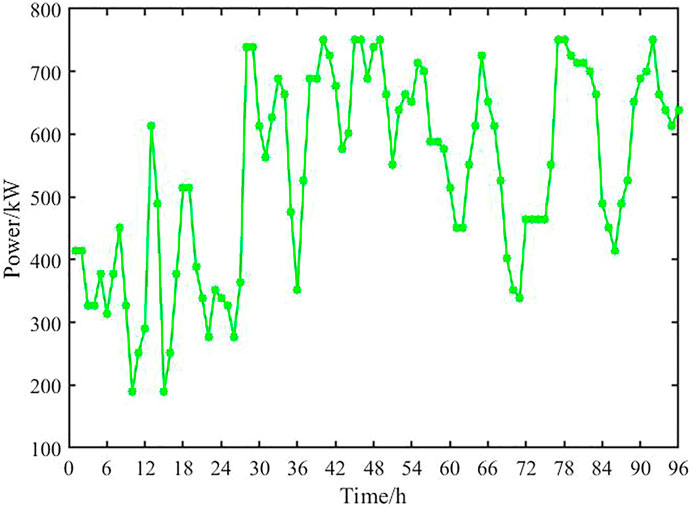
FIGURE 3. Forecast values of the output of single wind turbine during typical days of four seasons.
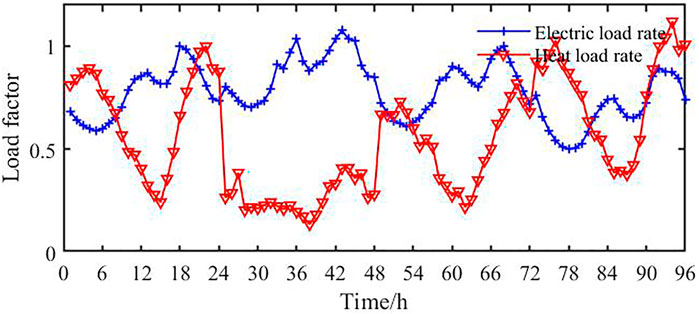
FIGURE 4. Forecast values of electric and heat load rate during typical days of four seasons.
Solution and Analysis of BS Optimal Configuration
The CPLEX solver in GAMS is used to solve the independent micro-grid BS optimal configuration model that takes DR into account. The model is a mixed integer linear programming problem, and the results are given in Table 1.

TABLE 1. Optimal configuration results of battery storage (BS) in the isolated micro-grid considering DR.
Regardless of DR, the same parameter settings are used to solve the BS optimal configuration model, and the results are provided in Table 2.

TABLE 2. Optimal configuration results of battery storage (BS) in the isolated micro-grid without considering demand-side response (DR).
Under the same conditions, compare the total number of configured BS units in Tables 1, 2, and it can be seen that the total number has reduced by 45.14% after the implementation of the incentive-type DR, indicating that the incentive-type DR can effectively reduce the overall configuration requirements of the independent micro-grid.
Optimized Scheduling Parameter Setting of Independent Micro-Grid
We take the simulation duration of the scheduling model as T = 24 h. Assuming that the forecasted wind speed of the area where the independent micro-grid is located in each period of the day that needs to be dispatched is given, the forecasted value of the active power output of a single wind turbine can be calculated according to the model in Main Structure of Independent Micro-Grid. The results are presented in Figure 5. The predicted values of the electric load and heat load rate on the day that needs to be dispatched are shown in Figure 6. Both
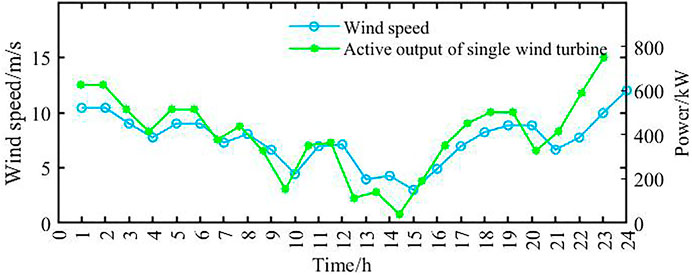
FIGURE 5. Forecast values of wind speed and a single wind turbine's output during the day to be dispatched.
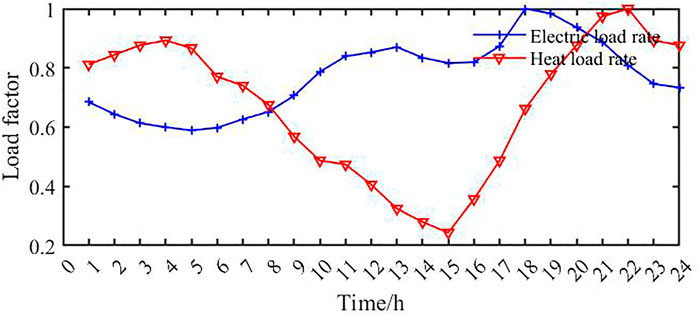
FIGURE 6. Forecast values of electric and heat load rate during the day to be dispatched.
Solution and Analysis of Optimal Scheduling of Independent Micro-Grid
Taking the results in Table 1 as the BS configuration scheme, the CPLEX solver in GAMS is utilized to solve the mixed integer linear programming problem. Taking the BS of node 11 as an example, the planned charging and discharging, and state-of-charge curves are shown in Figure 7. The BS characteristics of the other nodes are analogous to node 11.
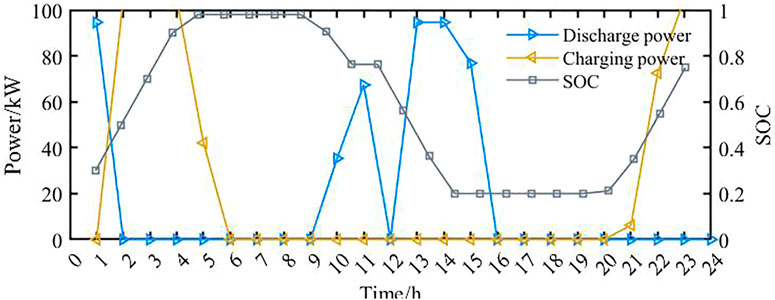
FIGURE 7. Charging or discharging behaviors and state of charge of battery storage units at node 11.
Considering the DR and BS configuration of independent micro-grid, the results of the plan values of heat power, active power, and thermal power on the scheduling day are shown in Figures 8, 9, 10, respectively. If the total active power of the BS is negative, it is in the charging state. On the other hand, the total active power indicates the discharging state.
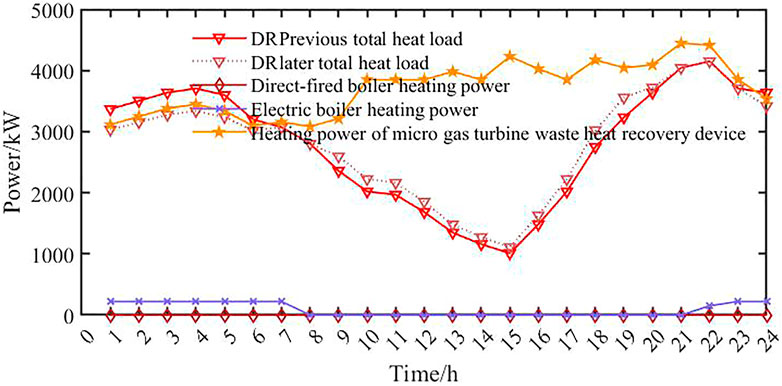
FIGURE 8. Planned values of heat power items during the day to be dispatched.
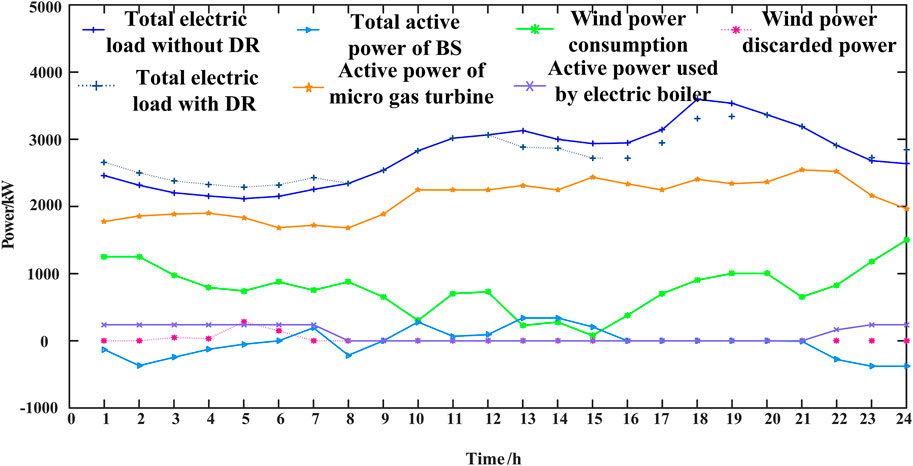
FIGURE 9. Planned values of active power items during the day to be dispatched.
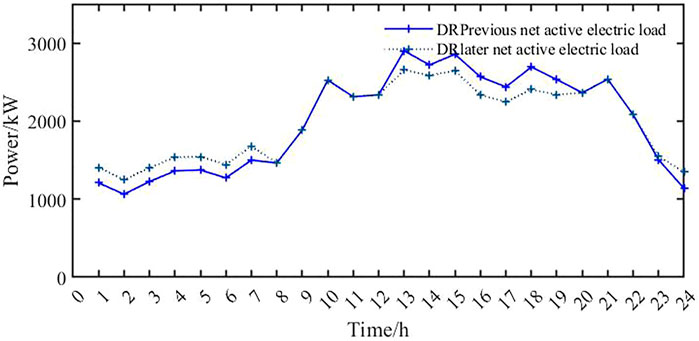
FIGURE 10. Net active load values before and after considering demand-side response (DR).
It can be seen from Figure 8 that the removed heat load is satisfied when it is transferred to a low heat load rate and a high electric load rate. On this occasion, the increase in heat load helps to make effective use of waste heat. It can be seen from Figure 9 that the overall BS is charged from 1 to 6 o'clock and 21 to 24 o'clock when the electricity load rate is low and wind power resources are abundant. On the other hand, it is discharged from 9 to 16 o'clock when the electricity load rate is high and wind power resources have been consumed and cooperate with the micro gas turbine to supply the electric load in the grid.
In addition, the following configurations are taken for independent micro-grids: 1) DR is not implemented, and BS is not connected; 2) DR is not implemented, and BS is configured according to Table 2; 3) DR is implemented, and BS is not connected. Subsequently, the same parameters are used to solve the independent micro-grid optimization scheduling. The comparison of the planned expenditures of the independent micro-grid on the day of scheduling and the total cost of operating expenditures in the four scenarios are given in Table 3. For each scenario, the comparison of the total cost of independent micro-grid expenditures considering the BS investment converted to the value on the day that needs to be scheduled is shown in Figure 11. In addition, to give priority to the stable operation of the power system, the remaining heat of the micro gas turbine is dissipated when the heat load is light and the heat resources are abundant (not “using heat to determine electricity”). The comparison of the remaining heat dissipated in each scenario is shown in Figure 12.
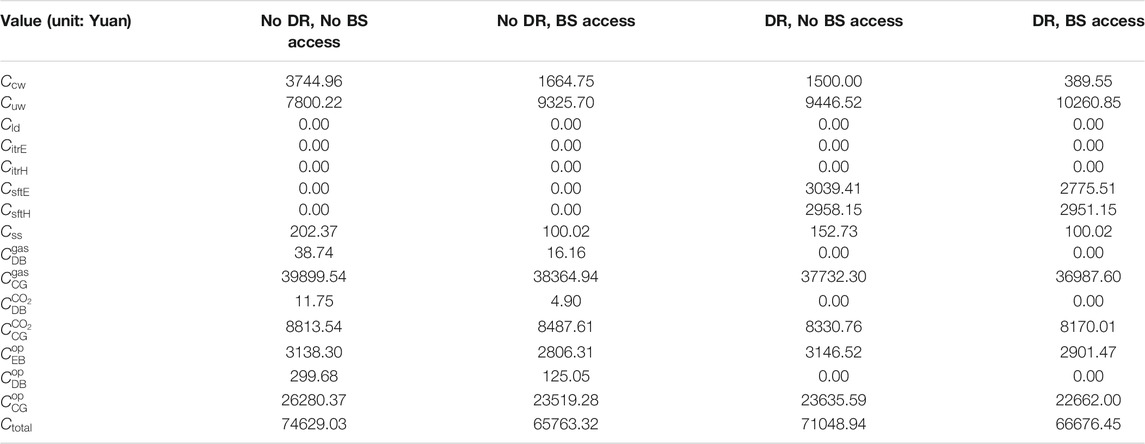
TABLE 3. Comparison of cost items of optimized dispatching plans under various scenarios.
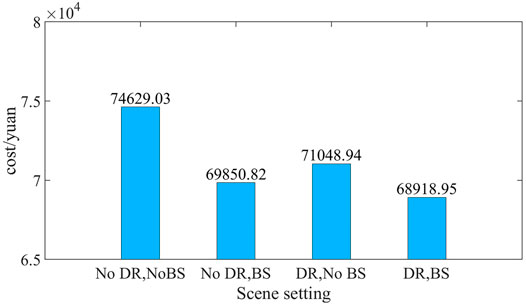
FIGURE 11. Total expenditures of the isolated micro-grid considering the cost of electrical energy storage.
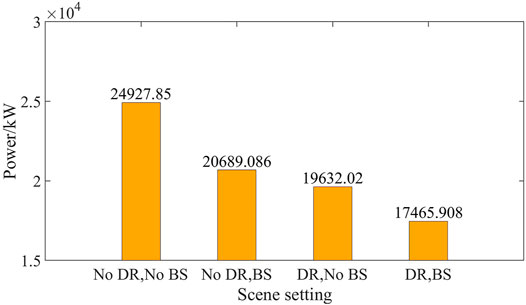
FIGURE 12. Residual heat dissipation under various scenarios.
For the same calculation example, after the independent micro-grid implements the incentive DR and optimally configures the BS, the comparison results with other scenarios are as follows:
(1) It can be seen from Table 3 that there is no load removal and interruption in the plan, indicating that the model can guarantee the reliability of energy supply at the plan level and realize economic dispatch on the source side. From Figures 8–10, it can be seen that the transferable load makes the thermal and electrical load curves achieve “peak shaving and valley filling.” Regarding the electric load, the rise of the trough section allows part of the wind power that was originally abandoned due to surplus to be absorbed. The reduction in the peak section reduces the power supply pressure of the unit and the dissipation of the waste heat. Regarding the heat load, the reduction of the peak period reduces the heating pressure, and the cost of the direct-fired boiler is reduced to zero.
(2) It can be concluded from Table 3 that
(3) It can be concluded from Table 3 that for the same incentive type DR, the transferable load is reduced after the BS is optimized, especially for the transferable electric load, which is reduced by 8.683%. This shows that the introduction of BS can reduce the interference to energy consumption. Combined with the analysis in Solution and Analysis of BS Optimal Configuration, the simultaneous use of the two resources has achieved complementary effects.
Impact on the Distribution System Resilience
In the real system, the load will increase over time, and the source side needs to be upgraded regularly to meet the load demand. As mentioned earlier, studying the impact on load growth after adopting a control strategy can reflect the impact on system resilience. By examining the data reported here, we can see that there exist redundant configurations of energy in the network, indicating that a certain load increase is acceptable. After considering the incentive DR or the configuration of BS (see Solution and Analysis of Optimal Scheduling of Independent Micro-Grid), the reduction of the energy supply pressure during the peak load period means the redundant capacity of the source side increases, and it has the potential to accommodate more load growth. In this section, the typical days of the four seasons are selected as the time series, and the thermal load and electrical load of each period are set to increase at the same rate (
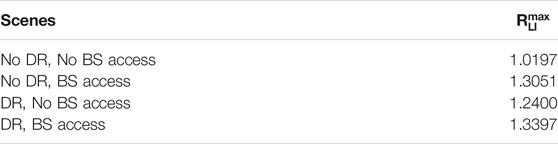
TABLE 4. Critical rate of load growth in the isolated micro-grid under various scenarios.
It can be seen from Table 4 that
Conclusion
Based on the establishment of a distributed energy micro-grid model, this article carried out the control strategy for flexible invocation of multiple types of resources such as conventional thermal power generators, wind turbines, and incentive-type DR, BS, etc. The interference of different resources combination on network reliability, economy, and energy consumption behavior was also compared. The impact on distribution system resilience was demonstrated. Our simulation results show:
(1) The method we proposed realizes the unified and flexible call of various resources in the distributed energy micro-grid and the integrated coordination of the elements of source, network, load, and storage.
(2) The incentive DR reduces the configuration requirements of the BS when optimizing the operation of micro-grid. The access of the BS can reduce the interference to the energy consumption behavior during the optimization schedule. The two resources achieve complementary effects.
(3) Without sacrificing the reliability of energy supply, our method enables the distributed energy system to achieve economically optimal operation, greatest energy saving, emission reduction, and the best system resilience.
This article expects the coordination and optimization of active and reactive resources of distributed energy micro-grid, more detailed energy storage models, more complex DR strategies, and uncertainty modeling of wind turbine and load in subsequent research so that the performance of the micro-grid can be further optimized.
Data Availability Statement
The original contributions presented in the study are included in the article/Supplementary Material, and further inquiries can be directed to the corresponding author.
Author Contributions
JW was mainly responsible for article guidance and modeling optimization work, RQ was responsible for the writing part and data analysis of the article, MW was responsible for part of the data collection and part of the writing, and the other authors were responsible for the material arrangement and part of the writing of the article.
Funding
This work was supported by the National Key Research and Development Program of China, China (No. 2018YFB0904800).
Conflict of Interest
The authors declare that the research was conducted in the absence of any commercial or financial relationships that could be construed as a potential conflict of interest.
Publisher’s Note
All claims expressed in this article are solely those of the authors and do not necessarily represent those of their affiliated organizations, or those of the publisher, the editors, and the reviewers. Any product that may be evaluated in this article, or claim that may be made by its manufacturer, is not guaranteed or endorsed by the publisher.
Supplementary Material
The Supplementary Material for this article can be found online at: https://www.frontiersin.org/articles/10.3389/fenrg.2022.841269/full#supplementary-material
References
Bahramirad, S., Reder, W., and Khodaei, A. (2012). Reliability-constrained Optimal Sizing of Energy Storage System in a Microgrid[J]. IEEE Trans. Smart Grid 03 (04), 2056–2062. doi:10.1109/tsg.2012.2217991
Chen, Cixuan., and Xiang, Tieyuan. (2016). Fundamentals of Electrical Engineering. Third Edition, Vol. II. Beijing: China Electric Power Press, 150–158. [M].
Ding, Ming., Zhang, Yingyuan., Mao, Meiqin., and Liu, X. (2011). Economic Operation Optimization for Microgrids Including Na/S Battery Storage [J]. Proc. CSEE 31 (04), 7–14.
Duan, Qinwei. (2016). in A price-based demand response scheduling model in day-ahead electricity market[C]//2016 IEEE Power and Energy Society General Meeting (PESGM), July 17-21, 2016 (Boston, MA, USA, 1–5.
Feng, Lejun., Dai, Xiaoye., Junrong, M. O., and Lin, S. H. I. (2020). Feasibility Analysis of the Operation Strategies for Combined Cooling,Heating and Power Systems (CCHP) Based on the Energy-Matching Regime[J]. J. Therm. Sci. 29 (05), 1149–1164. doi:10.1007/s11630-020-1314-2
Gilani, Mohammad. Amin., Kazemi, Ahad., and Ghasemi, Mostafa. (2020). Distribution System Resilience Enhancement by Microgrid Formation Considering Distributed Energy Resources[J]. Energy 191 (C). doi:10.1016/j.energy.2019.116442
Hajipour, E., Bozorg, M., and Fotuhi-Firuzabad, M. (2015). Stochastic Capacity Expansion Planning of Remote Microgrids with Wind Farms and Energy Storage [J]. IEEE Trans. Sust. Energ. 06 (02), 491–498. doi:10.1109/tste.2014.2376356
Iqbal, F., and Siddiqui, A. S. (2017). Optimal Configuration Analysis for a Campus Microgrid-A Case Study. Prot. Control. Mod. Power Syst. 2 (03), 245–256. doi:10.1186/s41601-017-0055-z
Luo, Yanhong., Zhang, Xinwen., Yang, Dongsheng., and Sun, Qiuye. (2020). Emission Trading Based Optimal Scheduling Strategy of Energy Hub with Energy Storage and Integrated Electric Vehicles[J]. J. Mod. Power Syst. Clean Energ. 8 (02), 267–275. doi:10.35833/mpce.2019.000144
Ma, S., Su, L., Wang, Z., Qiu, F., and Guo, G. (2018). Resilience Enhancement of Distribution Grids against Extreme Weather Events. IEEE Trans. Power Syst. 33 (5), 4842–4853. doi:10.1109/tpwrs.2018.2822295
Muhammad Arif, Syed., Hussain, Akhtar., Syed Muhammad Ahsan, Tek. Tjing. Lie., and Khan, Hassan. Abbas. (2020). Analytical Hybrid Particle Swarm Optimization Algorithm for Optimal Siting and Sizing of Distributed Generation in Smart Grid[J]. J. Mod. Power Syst. Clean Energ. 8 (06), 1221–1230.
Phylicia, Cicilio., David, Glennon., Adam, Mate., Arthur, Barnes., Vishvas, Chalishazar., Eduardo, Cotilla. Sanchez., et al. (2021). Resilience in an Evolving Electrical Grid[J]. Energies 14 (3).
Qi, Jianghao., Li, Fengting., and Zhang, Gaohang. (2021). Multi-time Scale Scheduling Strategy for Source-Load Coordination Considering Demand Response Block Participation [J]. Power Syst. Prot. Control. 49 (11), 61–69.
Shi, Nian. (2018). Research on Coordinated Planning of Wind Power and Energy Storage in Distribution Network Considering Demand Response [D]. Wuhan: Huazhong University of Science and Technology.
Shi, Q., Li, F., Olama, M., Dong, J, Xue, Y, Strake, M, et al. (2020). Network Reconfiguration and Distributed Energy Resource Scheduling for Improved Distribution System Resilience [J]. Int. J. Electr. Power Energ. Syst. 124, 1–10. doi:10.1016/j.ijepes.2020.106355
Shi, Qingxin., Li, Fangxing., Olama, Mohammed., Jin, Dong., Xue, Yaosuo., Starke, Michael., et al. (2021). Network Reconfiguration and Distributed Energy Resource Scheduling for Improved Distribution System Resilience[J]. Int. J. Electr. Power Energ. Syst. 124. doi:10.1016/j.ijepes.2020.106355
Soroudi, A. (2017). Power Plant Dispatching, Power System Optimization Modeling in GAMS [M]. First Edition. Switzerland: Springer Nature, 65–93. doi:10.1007/978-3-319-62350-4_3
Tao, Qiong., Li, Chunlai., and Mu, Yunfei. (2017). Statistical Capacity Planning Method for Battery Energy Storage System of Island Microgrid Considering Demand Response[J]. Proc. CSU-EPSA 29 (01), 37–44.
Tian, Liting., Cheng, Lin., Guo, Jianbo., and Wu, Kuihua. (2020). System Modeling and Optimal Dispatching of Multi-Energy Microgrid with Energy Storage[J]. J. Mod. Power Syst. Clean Energ. 8 (05), 809–819. doi:10.35833/mpce.2020.000118
Wenwu, Y., Chaojie, L., Xinghuo, Y., Wen, G., and Jinhu, L. (2018). Economic Power Dispatch in Smart Grids: a Framework for Distributed Optimization and Consensus Dynamics[J]. Sci. China(Information Sciences) 61 (01), 233–248.
Yun, Yunyun., Dong, Haiying., and Ma, Zhicheng., (2020). Optimization Economic Dispatch of a Multi-Source System Considering the Participation of Demand Response and Concentrating Solar Power Plant[J]. Power Syst. Prot. Control. 48 (14), 140–149.
Zhang, Jing., Wang, Ting., and Li, Bin. (2014). Research on Technical Standardization for Electric Demand Response [J]. Proc. CSEE 34 (22), 3623–3629.
Zho, Bin., Zou, Jianting., Chung, Chi. Yung., Wang, Huaizhi., Liu, Nian., Voropai, Nikolai., et al. (2021). Multi-microgrid Energy Management Systems:Architecture, Communication, and Scheduling Strategies[J]. J. Mod. Power Syst. Clean Energ. 9 (03), 463–476. doi:10.35833/mpce.2019.000237
Keywords: distributed energy micro-grid, demand-side response, battery storage, network modeling, distribution system resilience
Citation: Wu J, Qiu R, Wang M, Han R, Huang W and Guo Z (2022) Control Strategy of Distributed Energy Micro-Grid Involving Distribution System Resilience. Front. Energy Res. 10:841269. doi: 10.3389/fenrg.2022.841269
Received: 22 December 2021; Accepted: 11 January 2022;
Published: 16 March 2022.
Edited by:
Hantao Cui, Oklahoma State University, United StatesReviewed by:
Qiwei Zhang, the University of Tennessee, Knoxville, United StatesGuodong Liu, Oak Ridge National Laboratory (DOE), United States
Copyright © 2022 Wu, Qiu, Wang, Han, Huang and Guo. This is an open-access article distributed under the terms of the Creative Commons Attribution License (CC BY). The use, distribution or reproduction in other forums is permitted, provided the original author(s) and the copyright owner(s) are credited and that the original publication in this journal is cited, in accordance with accepted academic practice. No use, distribution or reproduction is permitted which does not comply with these terms.
*Correspondence: Rui Qiu, MTI1OTAxNTkzMkBxcS5jb20=