
95% of researchers rate our articles as excellent or good
Learn more about the work of our research integrity team to safeguard the quality of each article we publish.
Find out more
ORIGINAL RESEARCH article
Front. Energy Res. , 03 February 2022
Sec. Bioenergy and Biofuels
Volume 10 - 2022 | https://doi.org/10.3389/fenrg.2022.837698
This article is part of the Research Topic Advancements in Biomass Feedstock Preprocessing: Conversion Ready Feedstocks, Volume II View all 16 articles
 Ling Ding1*
 Amber N. Hoover1
 Rachel M. Emerson1
 Kuan-Ting Lin1
 Josephine N. Gruber2
 Bryon S. Donohoe2
 Jordan L. Klinger1
 Rachel D. Colby1
 Brad J. Thomas1
 William A. Smith1
 Allison E. Ray3*
Imaging in the visible spectrum is a low-cost tool that can be readily deployed for in-field or over-belt monitoring of biomass quality for bio-refining operations. Rapid image analysis coupled with innovative preprocessing may reduce the impacts of feedstock variability through identification of contaminants or other material attributes to guide selective sorting and quality management. Image analysis was employed to evaluate the quality of corn stover in red-green-blue (RGB) chromatic space. This study used controlled, bench-scale imaging as a proof-of-concept for rapid quality assessment of corn stover based on variations in material attributes, including chemical and physical attributes, that relate to biological degradation and soil contamination. Logistic regression-based classification algorithms were used to develop a method for biomass screening as a function of biological degradation or soil contamination. This study demonstrated the use of image analysis to extract features from RGB color space to investigate variations in critical material attributes from chemical composition of corn stover. Fourier transform infrared (FT-IR) suggested a correlation between red band intensity and biological degradation, while detailed surface texture analysis was found to distinguish among variations in ash. These insights offer promise for development of a rapid screening tool that could be deployed by farmers for in-field assessment of biomass quality or biorefinery operators for in-line sorting and process optimization.
The 2016 Billioin Tons Report (BT16) estimates that by 2040, more than 1 billion tons of biomass will be available to achieve a vision of a sustainable bioeconomy (US DOE, 2016). Lignocellulosic biomass has been considered a promising feedstock for biofuels production; therefore, tremendous research efforts have been made to enhance different aspects of the related processes (Cheah et al., 2020). Increases in fuel prices have challenged all countries around the world to develop their own biofuels from renewable resources such as lignocellulosic crops (Qureshi et al., 2010). Zea mays is a significant agricultural crop with potential as a biofuel feedstock due to its high carbohydrate content, low production cost, and high availability in the US corn belt (Li et al., 2020). Biomass variability originating from production and field conditions propagates with the feedstock through the value chain, posing a challenge to the emerging biorefinery industry (Ray et al., 2020). Variations in lignocellulosic biomass material and quality attributes are often overlooked when assessing feedstock value and pathways for conversion to fuels, chemicals, and products (Ray et al., 2020). Variations in cell wall composition, extractives, moisture content, inorganic species, and soil contaminants have been identified as critical factors affecting biomass quality, process uptime, and product yields (Ray et al., 2020; Sievers et al., 2020; Ding et al., 2021a). Hoover et al. (2019) developed several multiple regression models where five chemical characteristics could be used to estimate biochemical conversion performance. Using these models, an approach for a grading system was demonstrated that could be used to inform markets on the impacts of biomass variability. Hartley et al. (2020) used discrete event simulation that investigated feedstock quality on plant uptime and overall impact to biofuel cost through feedstock delivery cost. These works show how fundamental biomass information might enable real-time decision making on plant profitability and operability. Storage is an essential component of the biomass logistics supply chain, which can have significant impacts to the overall feedstock supply cost and operational reliability (Rentizelas, 2016). Many studies have established that the combination of living cell respiration, biological degradation, and thermo-chemical oxidative reactions bring about significant changes to critical biomass feedstock attributes and process efficiency during storage (Bose et al., 2020; Groenewold et al., 2020; Li et al., 2020). Changes that may occur in stored biomass feedstock include dry mass loss (up to 5.5% per month) (Thornqvist, 1985; Eisenbies et al., 2016), drying, decomposition, and energy content loss (Krigstin and Wetzel, 2016). In addition to capital and operational costs, it is imperative to consider the impact of storage method and format on chemical properties of biomass and overall process efficiency.
Image analysis techniques have been widely applied to measure lignocellulosic biomass features. Image analysis techniques for assessing crops and plant material involve extracting information from digital images of the lignocellulosic biomass (Yan et al., 2020). Unique features of the materials, such as shape, color, and surface texture, can be recognized. Recent research found that crop biomass is highly correlated with different crop parameters, such as leaf area index, crop height, and canopy volume (Lati et al., 2013; Bendig et al., 2014; Tilly et al., 2014), and is also correlated with different vegetation indices based on hyperspectral and red, green, blue (RGB) images (Gupta et al., 2000; Gitelson et al., 2003; Swain et al., 2010; Gitelson et al., 2014; Jannoura et al., 2015). Crop biomass yield has been estimated from spectral information from an unmanned aerial vehicle using standard RGB and multispectral or hyperspectral cameras (Jiang et al., 2019). Image analysis has also been used to estimate the distribution of plants in fields of a clover-grass mixture by using convolutional neural networks trained to predict semantic segmentation maps of clover, grass, and weeds in RGB images containing clover-grass mixtures (Skovsen et al., 2017). Further, Wang et al. found a strong positive correlation between the grayscale values of biochar and its methylene blue and iodine adsorption capacity, and the Pearson’s correlation coefficient range was 0.685–0.977 (Wang et al., 2015). In addition, surface texture can be measured directly from images taken with a laser profilometer (Chinga et al., 2007; Wagner and Horn, 2017), stereomicroscope (Mitra et al., 2014; Piselli et al., 2017), photographic scanner (Aguirre et al., 2018), or scanning electron microscope (Yan et al., 2020). The image analysis can also provide information on the surface roughness based on grayscale values of the image or height map (Chinga et al., 2007).
There are limited publications on visible, red-green-blue (RGB) analysis of biomass variability relevant to biorefineries and lack of such a study limits the ability to develop rapid screening tools for in-field assessment of biomass quality based on physical and chemical attributes. The novelty of this paper was to design and use controlled, bench-scale imaging, employing an off-the-shelf digital camera, as a proof-of-concept for rapid, quality-based assessment of corn stover in visible, red-green-blue (RGB) space based on variability derived from soil contamination and biological degradation. Logistic regression classification algorithms were used to develop an image screening of biomass as a function of soil contamination and biological degradation. In addition, FTIR was used with a more detailed surface analysis to investigate variation in critical material attributes that arise from chemical composition. Finally, surface texture analysis of the same images distinguished among variable ash levels and degradation. The qualitative results presented in this study show promise for developing rapid screening tools to deploy in-field or in-line for rapid assessment of feedstock quality.
Two sets of corn stover samples were imaged and analyzed in this study. The first was a set of 216 core samples from 24 bales obtained from four fields in different central Iowa counties: Hamilton (4 bales), Hardin (6 bales), Story (6 bales), and Poweshiek (8 bales) described in Ray et al. (2020). Baling occurred between October 12 and 27, 2017, using an AGCO 2270XD large square baler, except for Poweshiek County, where a Heston 2270XD square baler was used. Preliminary screening for moisture and ash content was performed by taking three cores per bale to select the 24 bales used in this study. Selected bales were more thoroughly sampled by collecting nine cores per bale, illustrated in a previous study (Ray et al., 2020). Corn stover samples were dried at 40°C and milled with a 2 mm screen in a Thomas Model 4 Wiley Mill (Thomas Scientific, Swedesboro, NJ) for chemical composition analysis. Additional milling using a Retsch ZM200 (Haan, Germany) with a 0.2 mm screen was done to analyze inorganics. For surface analysis, the bales were size reduced through a Vermeer BG480 bale processor with a 75-mm screen, then a Bliss Hammermill with a 25-mm screen, and samples were collected and milled to pass a 2-mm screen for evaluation of surface properties.
The second set of 12 corn stover samples was selected to evaluate material attributes influenced by aging and degradation in storage operations. Bales were from Hardin County, IA (2 bales) and Story County, IA (3 bales) with harvest and baling information described for each county previously. Bale sections exhibiting visual evidence of biological degradation were selected for sampling as described in previous studies (Li et al., 2020; Groenewold et al., 2020; Bose et al., 2020). Samples were collected from bale flakes displaying variable extents of biological degradation—moderate biological degradation (medium brown coloration), severe biological degradation (dark brown to almost black), and mild-or negligible biological degradation (light brown). The two bales from Hardin County were size reduced using a Vermeer BG480 bale processer with a 75-mm screen, samples were collected following size reduction, and one sample per bale was visually identified as severely biologically degraded or mild/negligible biologically degraded. The three bales from Story County were manually deconstructed and dissected to collect samples from flakes of the bale that were observed to have mild/negligible biological degradation or moderate/severe biological degradation (Groenewold et al., 2020). For subsequent characterization, samples were milled to pass through a 2 mm and a 0.2 mm screen as described above.
An imaging workflow was developed that uses a Panasonic Lumix G camera with a 88.9-cm square light shed and Metz Mecablitz 52 AF-1 digital flashes. Camera location and settings, as well as flash position, were kept consistent for all images. Each 2-mm sample was imaged using a standardized sample template with internal color standards in each sample photo and a consistent set of biomass samples in each photo (Figure 1A). The image processing workflow included post-processing in SilkyPix Developer Studio 8 SE and data extraction with ImageJ (https://imagej.nih.gov/ij/). Each photo’s exposure and gray balance were set individually using the X-Rite ColorChecker Passport Photo 2 with color reference targets included in each image. Regions of interest were defined in each image, as displayed in Figure 1B. The digital photos were decomposed into red, green, and blue channel values ranging from 0 to 255 in relative intensity. The mean, median, standard deviation, minimum, and maximum for the red, green, and blue values range from the regions of interest for all samples were included in the data sets available in the Bioenergy Feedstock Library (Ding et al., 2021b). The image results were aligned with sample metadata, total inorganics, inorganic speciation, and chemical composition (NIRS predicted composition or wet chemical composition) (Ding et al., 2021b). In addition to analytical characterization, three independent observers inspected each sample to assist with positive classification of samples into qualitative sample categories: 1) clean and not degraded, 2) soil contaminated, or 3) degraded (Ding et al., 2021b). This is further discussed below.
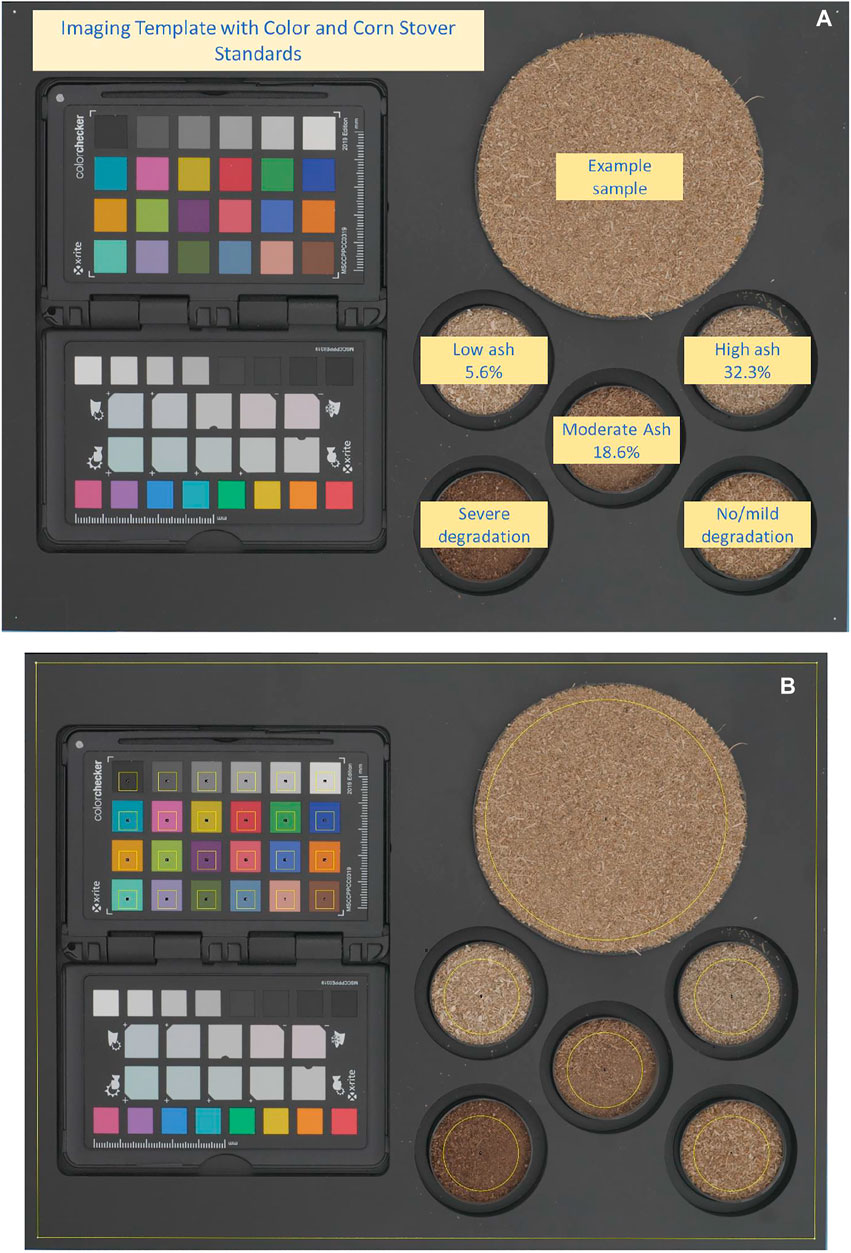
FIGURE 1. (A) Image workflow sample template with internal color standards and biomass samples; (B) Examples of the region of interest selection to measure and output RGB channel data.
Inorganic speciation for Al, Ca, Fe, K, Mg, Mn, Na, P, Si, Ti, and S oxides were measured according to ASTM standards D3174, D3682, D6349 by a Huffman Hazen Laboratories in Golden, CO and represented on a % dry biomass basis. The chemical composition, including total inorganics, glucan, xylan, lignin, and total extractives, was measured using near-infrared spectroscopy (NIRS) predicted composition or wet chemical composition. For NIRS, predicted composition samples at 2 mm particle size were dried in a desiccator for a minimum of 72 h prior to NIRS analysis. Previous publications have described spectral analysis and NIRS calibration models in detail (Payne and Wolfrum, 2015; Ray et al., 2020). Wet chemical composition was performed in duplicate following the National Renewable Energy Laboratory’s laboratory analytical procedures for standard biomass analysis (Sluiter et al., 2010), as described in a previous study (Hoover et al., 2019). The NIRS chemical composition predictive models were built on these same wet chemical procedures.
Three independent researchers performed an observational assessment of each sample and categorized sample quality on the basis of soil contamination and degradation due to biological heating. The surveyed researchers were highly experienced in biomass sampling, preparation, and analytical characterization for assessment of biomass quality, as well as identification of degraded samples that have undergone biological heating or biomass materials with soil contamination. Observational assessment consisted of a -visual (color and clear decay, soil contamination), tactile (texture from grit, soil, silt and/or sand entrapment, and fiber integrity), and odor (presence of astringent odors common to biological degradation) material inspection of each sample and recorded whether it was 1) not soil contaminated and not biologically degraded 2) soil contaminated, or 3) biologically degraded. Samples were assessed with a scale of 0–3 for soil contamination, and biological degradation with 0 = not observed, 1 = low, 2 = moderate, and 3 = high. The observational values were summed for each category for a minimum value of 0 (i.e., each observer selected 0) and a maximum of 9 (i.e., each observer selected 3) [(Ray et al., 2020) Supplementary Material]. Observational data are aggregated in the dataset (Ding et al., 2021b).
JMP® Pro 16.0.0 was used to analyze the combined information from the image analysis, chemical analysis, and observational dataset as described above. Hierarchical cluster analysis using the Ward method was used to group the 222 samples with chemical composition data into four organic chemically distinct groups using glucan, xylan, lignin, and extractives contents (Ding et al., 2021b) along with four inorganic chemically distinct groups for the 191 samples in the dataset with inorganic speciation contents for 191 samples (Ding et al., 2021b). Principal component analysis (PCA) was also used for each organic and inorganic dataset to visualize and interpret the hierarchically defined clusters. Four linear regression models using least squares were generated relating 1) organic chemical components—glucan, xylan, lignin, a 2-way interaction between glucan and xylan, and a 3-way interaction between glucan, xylan, and lignin along with total inorganics—to the median red channel values (Ding et al., 2021b) as described in the image processing and analysis section, 2) the same organic chemical components along with SiO2 and SO3 inorganic constituents to the median red channel values 3) organic chemical components to the observed biological degradation dataset as described in the Observational dataset section and 4) the observed biological degradation levels to median red channel value. For the development of these models, factors were retained if they significantly contributed to the response variable (p ≤ 0.05) and were not highly correlated to other factors in the model except for cases when single factors were retained regardless of their significance if they were included in any interaction terms. Multicollinearity between model explanatory factors was determined based on the Variance Inflation Scores (VIF). A VIF score >10 was considered high multicollinearity between model factors. Nominal logistic fit regression models were used to develop predictive models for biological degradation and soil contamination levels, using the established hierarchical cluster groups as response variables and median values from the red, green, blue channels and 2-way interactions between these values. The dataset used for these models included the 222 samples for predicting the levels of biological degradation with organic chemical data available and 176 samples for predicting levels of soil contamination using samples with both organic chemical and inorganic speciation data available. Factors for each model were removed based on p-values greater than 0.05. The datasets were randomly split into 80% training and 20% validation for these predictive models.
Corn stover samples for Sample Set 1 were milled using a Retsch ZM200 (Haan, Germany) to 0.2 mm, extractives were retained in the samples. Corn stover samples were extracted with 95:5 acetone/water on a Soxhlet apparatus (∼70°C) to remove extractives for Sample Set 2. Corn stover samples for Sample Set 2 were milled in Retsch PM 100 mill fitted with one or two 50 ml ZrO2 grinding jars and 10*10 mm ball bearings 10 h to less or equal to 45 µm (5 min mill with 10 min interval test). FTIR spectra of all corn stover samples were collected using a Bruker Vertex 70 FTIR spectrometer, equipped with a diamond ATR accessory (Bruker Corporation). Spectra were collected in the spectral range 4000-600 cm−1, using 64 scans and 1 cm−1 resolution. Spectra were baseline corrected at 1840 cm−1 and advanced diamond ATR fixed with the angle at 450.
Textural features of cropped images were quantified using the plugins SurfChar J 1q (Chinga et al., 2007), GLCM Texture Too (Haralick, 1979; Lan and Liu, 2018), and FracLac (Smith et al., 1996; Karperien et al., 2013). Before textural analysis, the original color corrected images were cropped to isolate a 900x900-pixel region-of-interest (ROI) centered on the sample cup. Then, the color information was discarded in the image of all subsequent texture analyses and used either 32-bit (SurfCharJ) or 8-bit (GLCM and FracLac) greyscale images. The SurfCharJ 1q package calculated an estimate for the root mean square deviation (Rq), arithmetical mean deviation (Ra), skewness (Rsk), Kurtosis (Rku), lowest valley (Rv), the highest peak (Rp), total profile height (Rt), the mean height of surface profile (Rc), mean polar facet orientation (FPO), variation of the polar facet orientation (MFOV), the direction of azimuthal facets (FAD), mean resultant vector (MRV), and surface area (SA) from the image. The GLCM Texture Too plugin calculated angular second moment (ASM), inverse difference moment (IDM), contrast, entropy, homogeneity, variance, shade, prominence, inertia, and correlation. The FracLac plugin analyzed the fractal dimensions of the images. Local connected fractal dimension analysis was used, and the Dm output was collected. In total, 27 different surface texture parameters were calculated.
Figure 2 shows the results and distribution of chemical compositions and inorganic speciation variability of all samples used for image analysis (detailed dataset in (Ding et al., 2021b). Total inorganics, SiO2, and Al2O3, revealed substantial variation on a % dry matter basis. Both Si and Al-based inorganic species are potential contributions from levels of soil contamination.
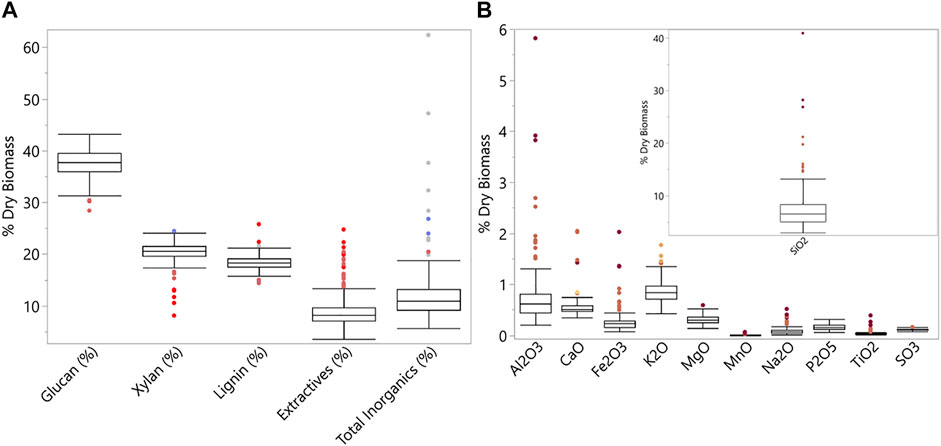
FIGURE 2. Boxplots for (A) chemical composition; n = 222, and (B) inorganic speciation; n = 191. SiO2 is broken out for a clearer view of the variable ranges of the other inorganic species.
Hierarchical cluster analysis based on chemical components was used to glean key insights about sources of variability (i.e., degradation and soil contamination) that affect quality, with samples grouping into four distinct clusters observed through principal component analysis (PCA) (Figure 3). These chemical composition constituents vary by level of biological degradation (Andrews et al., 1999; Brand et al., 2011; Krigstin and Wetzel, 2016; Groenewold et al., 2020). The loading plot in Figure 3B shows how each of these chemical components is driving the observed cluster in the PCA score plot demonstrated in Figure 3A.
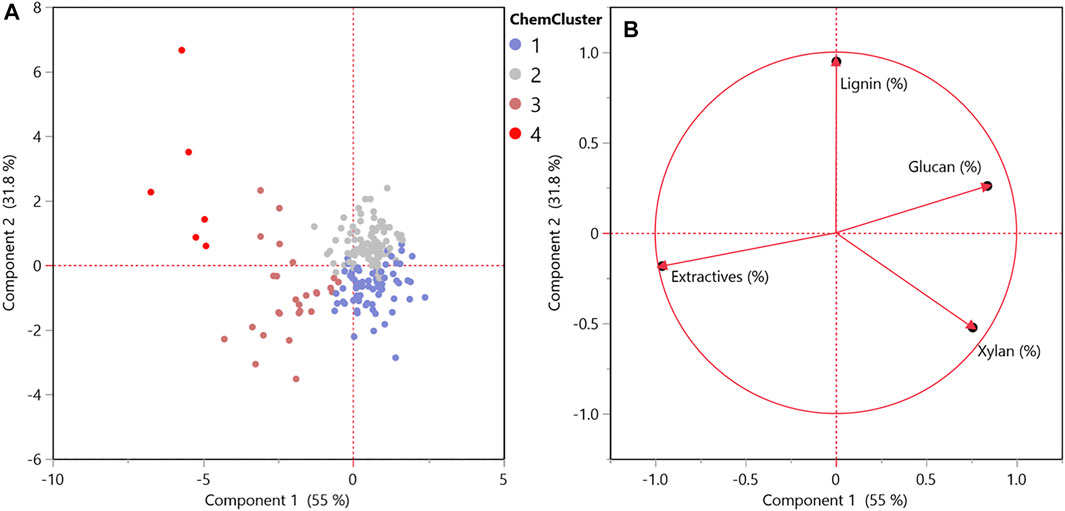
FIGURE 3. Principal component analysis of biological degradation (A) score plot and (B) loading plot for chemical composition. n = 222.
Figure 4A shows a linear relationship between the median red channel and the chemical properties of the samples and was used throughout the analyses. The red channel had the largest range of variability when compared to blue and green, high correlation to other factors used in regression analyses and was correlated to green and blue channels (Supplementary Figure S1, supporting information). Linear relationship factors were identified from chemical data using a stepwise technique as a function of their contributions toward explaining variability in the median red channel output, while minimizing multicollinearity between explanatory factors. For example, extractives and the interaction factor of (glucan x xylan) are highly correlated (Supplementary Figure S1, supporting information). Therefore, both were not necessary to explain the variability in the median red channel. The relationship between these chemical properties and the median red channel exceeds an R2 value of 0.7. Interaction terms between glucan, xylan, and lignin content were included in this analysis. Table 1 displays the standardized coefficients and relative significance level for each chemical material attribute from linear relationships in Figure 4A. These coefficients suggest that xylan was the highest contributor to explaining the variability seen in the red channel. At the same time, changes in glucan contribute the least in comparison to the other factors. This is consistent with prior work that demonstrated selective degradation of hemicellulose in response to biological heating during storage with cellulosic components involved to a lesser extent (Groenewold et al., 2020). Both factors indicate that as glucan and xylan contents decrease, the red channel signal decreases.
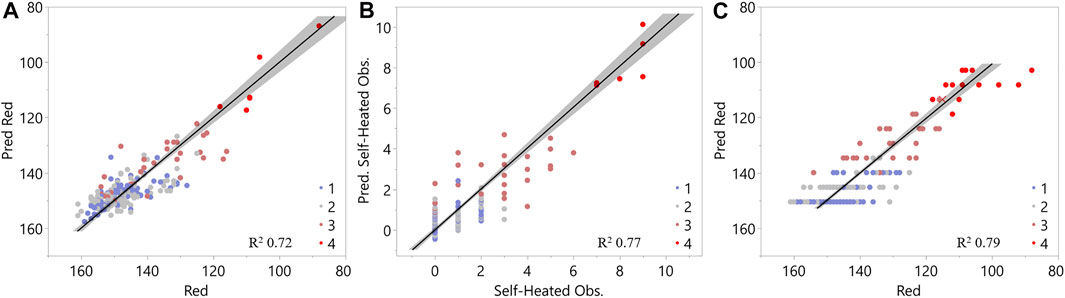
FIGURE 4. Least squares regression analysis of (A) red band intensity as a function of chemical composition, (B) biological degradation/self-heating observation as a function of chemical composition, and (C) red band intensity as a function of biological degradation/self-heating observation. Legend gives results of cluster analysis from chemical composition in Figures 3A,B.
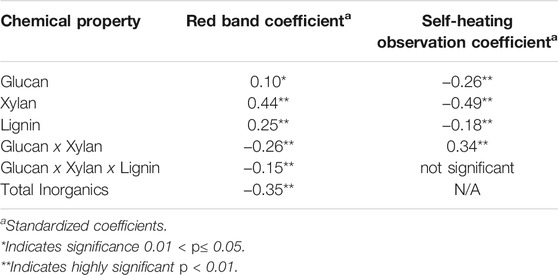
TABLE 1. Chemical properties are used to form linear regressions for explaining the red-band and biological degradation/self-heating observation variability.
It should be noted that extractives were not used in the model due to the high correlation with glucan and xylan; however, as extractive content increases in the data set, the red channel decreases. Previous studies have demonstrated that extractives content increases with the extent of biological degradation (Groenewold et al., 2020; Li et al., 2020; Ray et al., 2020), consistent with reductions in hemicellulose and to a lesser extent, cellulosic components, as a function of biological degradation. The interaction terms between glucan and xylan suggest that with increases in both, the impact of xylan on the red channel output decreases. During degradation, xylan content, representing the hemicellulose fraction, is more reduced than glucan content (Qing and Wyman, 2011). This interaction term reflects the changing ratio between cellulose and hemicellulose. The same conclusion can be drawn from the interaction between glucan, xylan, and lignin, representing the changing ratios between these chemical attributes in response to degradation. Total inorganics also significantly contributed to changes in the median red channel response. This relationship is further discussed in the following section on soil contamination.
Linear regression analysis was used to relate organic components of glucan, xylan, and lignin to the severity of biological degradation. Figure 4B shows the resulting linear relationship, and the coefficients are shown in Table 1. The R2 was 0.77 for this regression, similar to the regression formed between chemical properties and the red band in Figure 4A. This relationship also indicates that xylan is the highest contributor, suggesting that lower concentrations of xylan content correspond to higher biological degradation levels. The only organic-based significant factor not shared between the two regressions (Figures 4A,B) was the interaction between glucan, xylan, and lignin (Table 1). This factor did not significantly contribute to explaining the biological degradation observations. Researcher observations of biological degradation less resolved (scale from 0-9 with each researcher selecting between 0-3) compared to the red channel range (88-161measured); therefore, observational data may not be able to capture the changes in glucan-xylan-lignin property relationships, suggesting the basis for differing explanatory factors in Figures 4A,B. The similarities between the linear regressions formed between the red channel and chemical properties and observed levels of biological degradation and chemical properties suggest that the red channel from the image analysis identifies biological degradation in the samples. Figure 4C further corroborates this by showing the strong linear relationship between the red channel outputs and the biological degradation observations (R2 = 0.79).
The relationships observed between the chemical changes, image analysis of the red channel, and biological degradation observations generally align with the overarching hierarchical cluster grouping. Cluster 1 and 2 (Figure 3A) correspond with no or mild biological degradation, group 3 as moderate, and group 4 as the severely biological degradation samples.
To gain a more comprehensive understanding of the impacts of biological degradation on the structural properties of biomass, FT-IR was applied to characterize corn stover with different extents of degradation. Corn stover biomass was selected based on the degree of degradation classified as mild, moderate, and severe or scaled from 1 to 9. The detailed information for the red band values and chemical composition is listed in Table 2. The more severely biologically degraded biomass resulted in a lower red band value. Figure 5 shows the FT-IR spectrum of selected corn stover biomass (Bales 5, 1, and 6) (See image analysis dataset bale ID (Ding et al., 2021b)) and focuses on the region from 1800-800 cm−1 reflecting the critical structural properties of biomass (Ma et al., 2018). Remarkable differences were observed in Bale 5. The C-O-C ether stretching at 1030 cm−1 and 1242 cm−1 decreased after biological degradation indicating the carbohydrates were hydrolyzed during biological degradation, which corresponded to the decrease of xylan. The absorbance of aromatic C-H stretching of lignin in 1510-1300 cm−1 also decreased after degradation, suggesting that lignin condensation reactions happened during the biological degradation process. It was hypothesized that the biological oxidation reactions that occur during the degradation result in chromophore formation, such as conjugated carbonyl and quinone, leading to the darkened color of the biomass. In Figure 5A, the absorbance of unconjugated (1710 cm−1) and conjugated (1651 cm−1) carbonyl (C=O) increased and shifted with the reducing value of the red band, implying that lignin was oxidized during the biological degradation process supporting this hypothesis. Figures 5B,C show the FT-IR spectrum of the Sample Set 1 corn stover samples. Unlike the degraded samples, the extractives and soils were not removed, and the particle size was 0.2 mm, which is much larger than that used for the Sample Set 2 samples. The FT-IR spectra of the samples show similar results with the degraded samples. However, some samples, such as Bale 6 Cores1 and 8, have weaker absorbance caused by the particle size or soil contaminants. Also, the overall absorbance of Sample Set 1 is lower than the degraded samples (Sample Set 2). Therefore, the particle size of biomass and soil removal is essential for FT-IR ATR characterization. The FT-IR results demonstrated a potential correlation between the hydrolyzed carbohydrates and the condensed and oxidized lignin in biologically degraded corn stover. These results provide further insights into biopolymer degradation and modification mechanisms during storage, which could correlate to the red band intensity detected through image analysis.
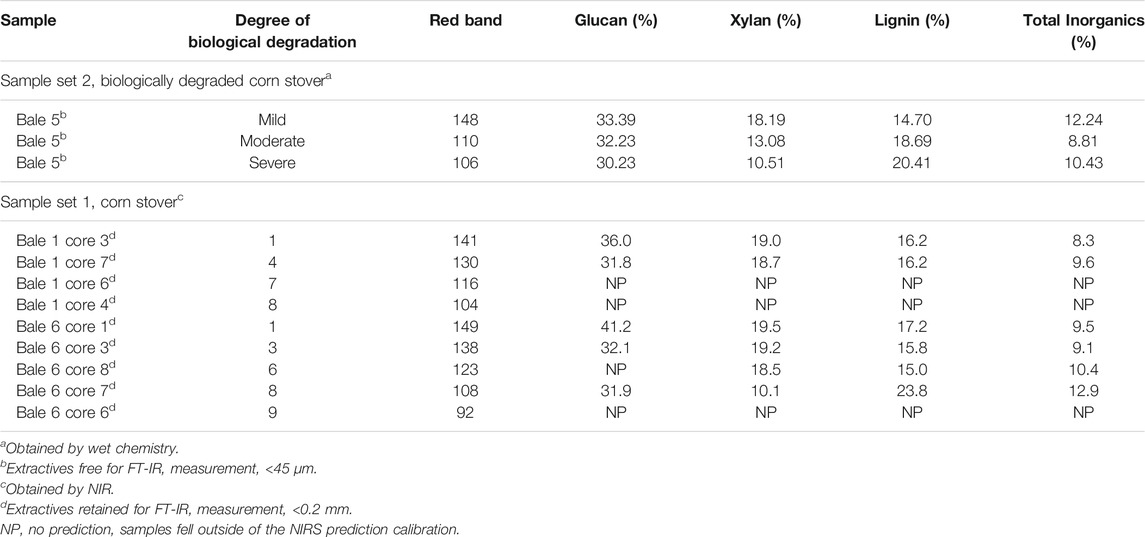
TABLE 2. Biological degradation properties, red band value, and chemical composition of corn stover for samples characterized using FT-IR.
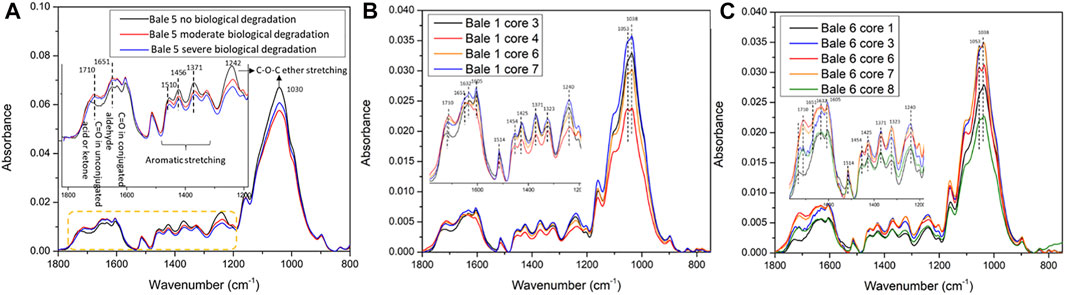
FIGURE 5. FT-IR from samples from across a range of degradation states (A) Bale 5, (B) Bale 1, and (C) Bale 6.
As shown in Table 1 and Figure 4A, the total inorganics content significantly contributes to changes observed in the red channel, suggesting that image analysis could provide a valuable tool for identifying levels of soil contamination. Hierarchical cluster analysis was used similarly on ash speciation data to identify distinct clusters based on inorganic features. Cluster 1 represents limited or no soil contamination, and cluster 4 represents high soil contamination. The PCA score plot (Figure 6A) displays these clusters. The variability in the 1st principal component suggests a relationship to inorganic species derived from soil contamination, including silicon and aluminum (Lacey et al., 2018). The second principal component relates to inorganic components that serve structural and physiological functions within the plant (i.e., biogenic ash), including sulfur, nitrogen, potassium, calcium, magnesium, and phosphorus (Thy et al., 2013; Li et al., 2020). The inorganic clusters 1 and 2 vary primarily based on intrinsic inorganic species inherent to plant biomass, and clusters 3 and 4 show relationships to soil contaminant inorganic species (i.e., silicon and aluminum).
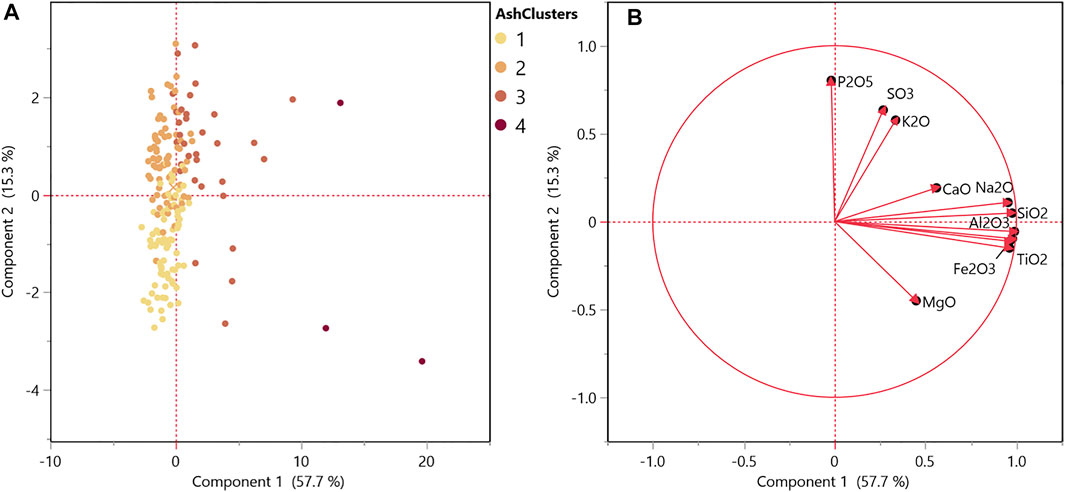
FIGURE 6. Principal component analysis of soil contamination (A) score plot and (B) loading plot for ash speciation represented on a % dry biomass basis.
Figure 7A shows the resulting regression with the ash speciation clusters labeled, and Figure 7B shows the same regression with the chemical clusters, that were based on glucan, xylan, lignin, and extractives contents. Regression analyses highlight that for this dataset, the red channel relationships are being driven by the biological degradation severity, even with the highest ash sample in the data representing close to 62% total inorganics. The regression shown in Figure 7A includes SO3 and SiO2 content instead of total inorganics, as was included in the regression represented in Figure 4A, to represent the relationship of these intrinsic and extrinsic ash species to the image red channel intensity. Phosphorus and potassium oxides were not selected for the linear regression as representatives of intrinsic ash, as suggested by the principal component 2 in the principal component loadings plot (Figure 6B) as they did not significantly contribute to explaining the red variability. It should be noted that fewer samples in the dataset contained ash speciation compared to the organic composition data available (191 samples compared to 222 samples). Therefore, the coefficient changes cannot be directly compared to the model in Figure 4A; however, the general trends remain consistent. Both SO3 (representative of intrinsic ash) and SiO2 content (representative of soil contamination) significantly explain variability in the red channel (Table 3).
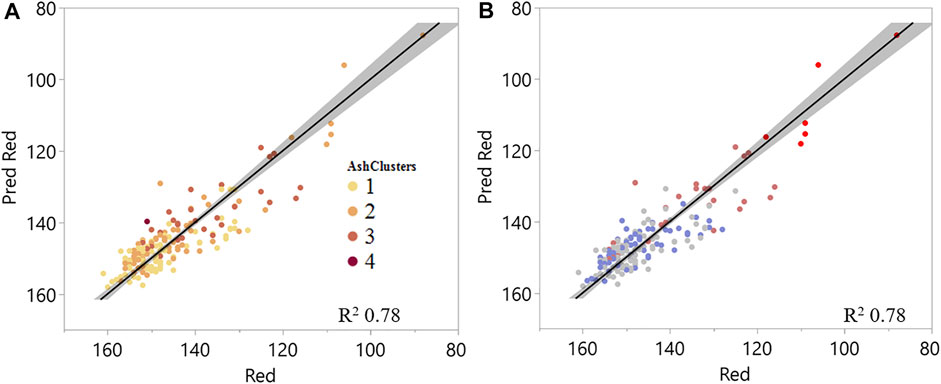
FIGURE 7. Linear regression of measured versus predicted red channel value explained by chemical composition and select inorganic species (SO3 and SiO2) visualizing (A) ash clusters and (B) chemical clusters.
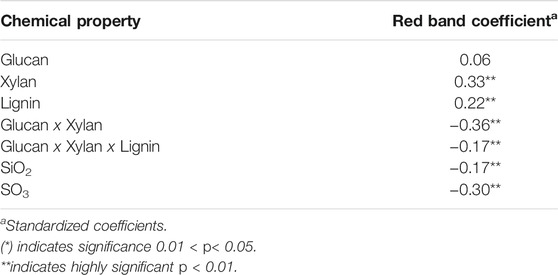
TABLE 3. Chemical properties, including select ash species (SO3 and SiO2), were used to form linear regressions to explain the red-band variability.
In summary, regression analyses associated with both biological degradation and soil contamination identified relationships among chemical components in corn stover, namely xylan, glucan, lignin, total inorganics, Si, and S, strongly correlated to the red band intensity detected through image analysis. The variations in organic chemical attributes xylan, glucan, and lignin were attributed to biological degradation. In contrast, variations in inorganic attributes, Si and S, corresponded to the extent of soil contamination and intrinsic inorganic content in the sample. Although a mechanistic understanding of the biological degradation (Groenewold et al., 2020; Ding et al., 2021a) and thermo-chemical oxidative reactions that alter biomass quality attributes during storage (Krigstin and Wetzel, 2016) is required to sort out confounding signals from the degradation and accumulation of inorganic species, qualitative results presented here show promise for developing rapid screening tools to deploy in-field or in-line for rapid assessment of quality (Ray et al., 2020).
The purpose of the regression analyses and relationships, as previously discussed, was to demonstrate that aspects of the images, the median red channel intensity specifically, could be quantitatively related to the chemical changes known to be impacted by biological degradation and soil contamination. Here the red channel along with the blue and green channels from the images was used to demonstrate potential screening methods for corn stover samples to predict the presence of biological degradation and soil contamination. For this demonstration, logistic regression was used to predict the hierarchical groups of chemical clusters representing biological degradation and inorganics clusters representing soil contamination considering the median red, blue and, green channel outputs and interactions between these color channels as predictors. For the organic chemical cluster logistic regression, the receiver operator characteristics (ROC) curve (Figures 8A,B) demonstrates the diagnostic ability of image analysis properties to correctly identify the organic chemical cluster, representing levels of biological degradation, that each sample belongs to by comparing the sensitivity, true identification rate, versus the specificity, false-positive identification rate. These plots, along with the confusion matrix, give the actual number of samples predicted to be in each group versus their actual group (Table 4) for both the training and validation sets. The confusion matrix indicates that this model correctly identified the severely biologically degraded samples (cluster 4) 100% of the time with no false identifications. However, the identification accuracy was lower for cluster group 3, moderate levels of biological degradation, and reduced further for clusters 1 and 2, representing no and mild biological degradation. The validation sample results from this logistic regression follow the same trend. Samples with severe biological degradation (cluster 4) are accurately predicted 100% with no false positives and show progressive decreases in the sensitivity and specificity for clusters 3, 2, and 1. This preliminary model indicates that this approach could be employed to identify biomass samples exhibiting moderate to severe biological degradation, but requires expanded datasets and further refinement to distinguish between samples with mild or limited biological degradation and samples without degradation.
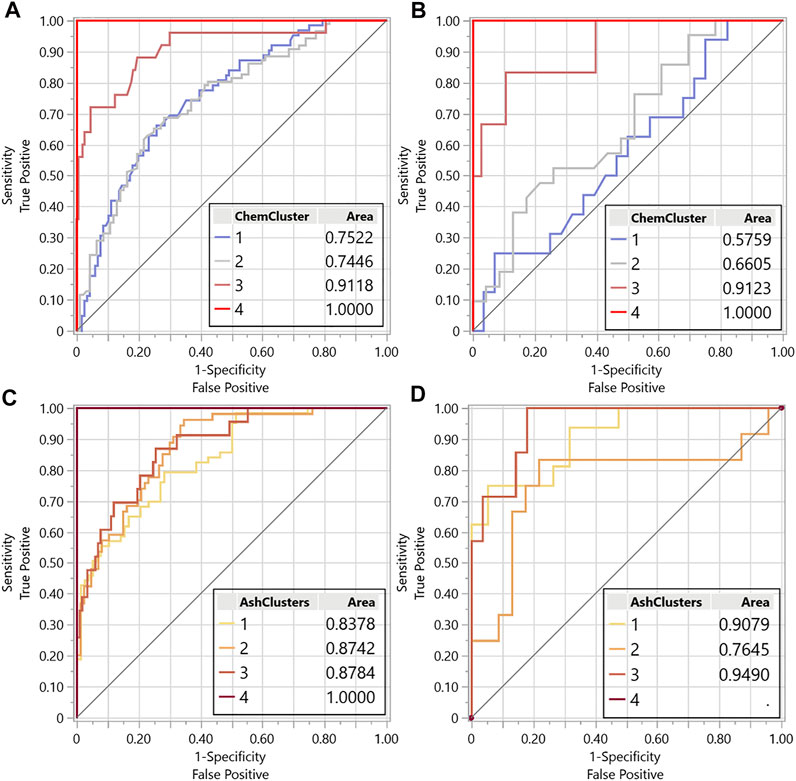
FIGURE 8. Receiver operator characteristic (ROC) curves for the logistics regression training sets using image analysis data red, green, blue channels to predict the chemical cluster (associated with levels of biological degradation) (A) training set and (B) validation set and ash cluster (associated with levels of soil contamination) (C) training set and (D) validation set.
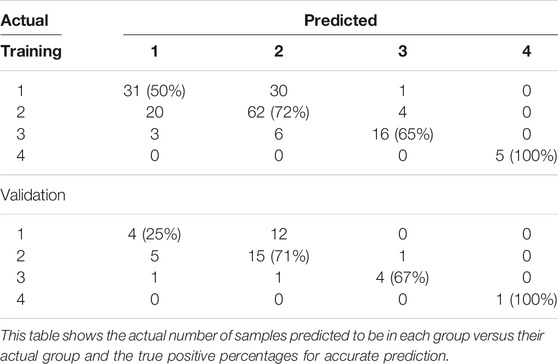
TABLE 4. Confusion matrix for chemical cluster logistics regression using red, green, and blue channels image analysis data.
Linear regression analysis indicated that biological degradation was the primary factor driving variaitions in the red-channel intensity, with soil contamination contributing secondarily. Based on this knowledge, the proposed process for screening feedstock for soil contamination is to the first screen for evidence of moderate and severe biological degradation and then use the outputs of the biological degradation prediction levels to screen for the additional presence of soil contamination. The resulting ROC curve and confusion matrices from this soil contamination logistics regression are shown in Figures 8C,D and Table 5. These results indicate enhanced diagnostic ability to predict higher levels of soil contamination (cluster group 4), representing a sample with 38% total ash and 28% SiO2 content. As only one sample was available at this level, no validation samples were used for this cluster group. Cluster 1 samples representing the lowest ash samples with on average 10% ash content and 6% SiO2 content was accurately 75 and 81% for the training and validation sets, respectively. The model had relatively equal power for identifying the lower levels of soil contamination representing average total ash 18 and 11% and SiO2 contents of 11 and 6% for clusters 3 and 2, respectively. These results show the potential for the image analysis to be used as a screening tool for soil contamination after considering color changes due to biological degradation; however, a larger dataset with known validation samples are necessary to improve modelaccuracy.
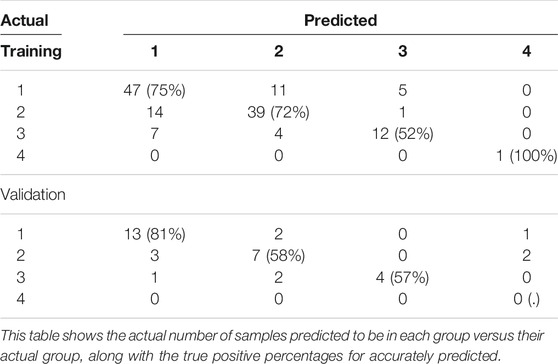
TABLE 5. Confusion matrix for ash cluster logistics regressions using image analysis data red, green, and blue channels, and chemical cluster input.
The image analysis based on color variability was used to identify biological degradation and soil contamination levels. In this research, image analysis of surface properties was also investigated to identify soil contamination, biological degradation, and additional properties impacting particle flow. For the samples with variable ash content, samples were selected with ash content of 5–10% (low ash) and 10–20% (high ash) (Sievers et al., 2020), surface roughness calculated as Rq (Figure 9A), and the GLCM parameter Shade (Figure 9C) appear to distinguish between high and low ash samples. The pattern, however, was different between Rq and Shade, with the high ash sample measuring low Rq and higher Shade values. Rq is a measure of surface roughness that is positively correlated with inter-particle friction and could impede flowability. However, surface roughness is also correlated with hydrophobicity. Therefore, particles that trap less water should have better flowability. Shade characterizes the tendency of clustering of pixels as a measure of asymmetry. In our previous work using images of hammer-milled biomass, the asymmetric clustering that shade describes was positively related to poor conveyance (Gudavalli et al., 2020). The fractal analysis (Figure 9B) or the GLCM parameter ASM (Figure 9D) differed among the ash variable samples (Sample Set 1).
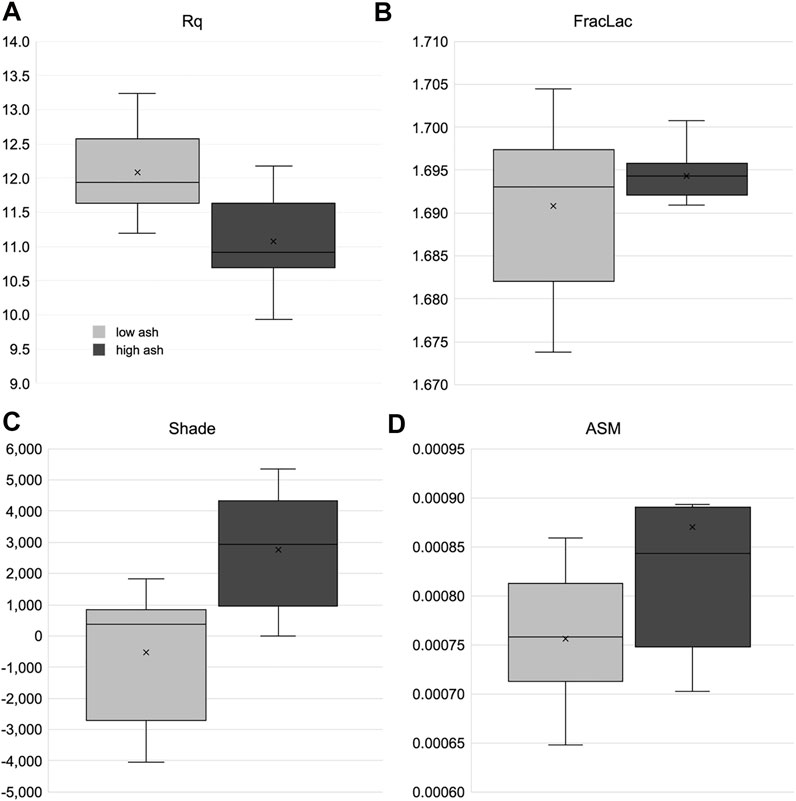
FIGURE 9. A subset of textural feature image analysis results from bale core samples taken corn stover bales with variable ash content. (A) Rq is the root mean square deviation. (B) FracLac is the local connected fractal dimension. (C,D) Shade and angular second moment (ASM) are grey-level co-occurrence matrix analysis parameters.
Mild, moderately, and severely degraded samples (Sample Set 2) were partly distinguished by three of the four texture parameters shown in Figure 10. The surface roughness (Rq, Figure 10A) reveals the most separation. Shade and ASM (Figures 10C,D) showed differences between mild and severe samples. These differences can be generated by how the samples fracture during milling, causing subtle differences in particle size and shape distributions—these differences in particles present as differences in the texture of biomass piles. For example, surface texture analysis could distinguish among variable ash levels or levels of degradation.
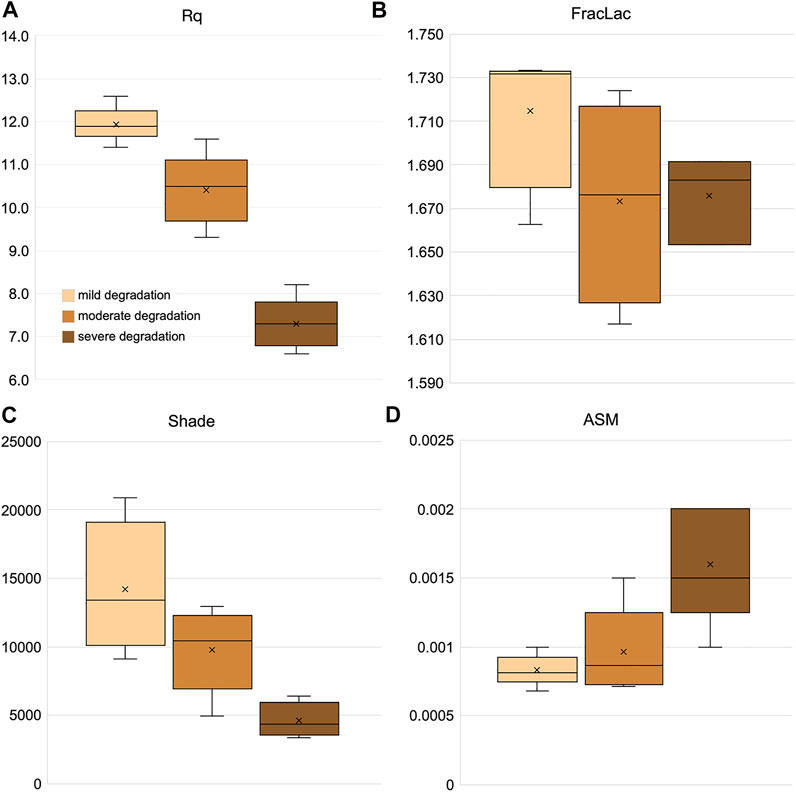
FIGURE 10. A subset of textural feature image analysis results from bale core samples taken corn stover bales with variable biological degradation. (A) Rq is the root mean square deviation. (B) FracLac is the local connected fractal dimension. (C,D) Shade and angular second moment (ASM) are grey-level co-occurrence matrix analysis parameters.
This study used image analysis in visible, red-green-blue (RGB) chromatic space to evaluate the quality of corn stover across four Iowa counties representing a realistic supply shed in the US corn belt. Linear regression relationships with R2>0.7 were found between the red channel values from images of corn stover and changes in chemical properties resulting from biological degradation (xylan, glucan, and lignin) and soil contamination (Si and S). The FT-IR results demonstrated a potential correlation between the hydrolyzed carbohydrates and the condensed and oxidized lignin in biologically degraded corn stover, which could correlate to the red band intensity detected through image analysis. In addition, surface texture analysis of for these same images was found to distinguish among variable levels of ash and degradation.
Further, logistic regression classification algorithms were used to develop an image analysis method for screening and classifying levels of biological degradation and soil contamination in corn stover. This prototype supports research and development that uses image analysis and other rapid characterization tools to further understand and describe corn stover and bioenergy feedstock quality during in-field or over-belt applications to support industrial operations for sorting biomass based on quality or presence of contaminants.
The datasets presented in this study can be found in online repositories. The names of the repository/repositories and accession number(s) can be found in the article/Supplementary Material.
LD and K-TL contributed to investigation, methodology, formal analysis, and writing the original draft manuscript. AH and RE contributed to conceptualization, methodology, formal analysis, data curation, and writing—draft, reviewing and editing. JG and BD performed the surface texture analysis and contributed to writing the original draft, reviewing, and editing; BD contributed to funding acquisition. RC and BT were involved in investigation and formal analysis. JK contributed to conceptualization and editing. WS contributed to conceptualization. AR contributed to funding acquisition, supervision, conceptualization, writing—reviewing and editing.
This research was supported by the US Department of Energy, Office of Energy Efficiency and Renewable Energy, Bioenergy Technologies Office as part of the Feedstock Conversion Interface Consortium (FCIC), and under DOE Idaho Operations Office Contract DE-AC07-051ID14517. This work leveraged resources of the US Department of Energy’s Biomass Feedstock National User Facility (BFNUF) and Bioenergy Feedstock Library located at Idaho National Laboratory (Idaho Falls, ID). This work was authored in part by the National Renewable Energy Laboratory, operated by Alliance for Sustainable Energy, LLC, for the US Department of Energy (DOE) under Contract No. DE-AC36-08GO28308.
The views expressed in the article do not necessarily represent the views of the DOE or the US Government. The US Government retains and the publisher, by accepting the article for publication, acknowledges that the US Government retains a nonexclusive, paid-up, irrevocable, worldwide license to publish or reproduce the published form of this work or allow others to do so, for US Government purposes.
The authors declare that the research was conducted in the absence of any commercial or financial relationships that could be construed as a potential conflict of interest.
All claims expressed in this article are solely those of the authors and do not necessarily represent those of their affiliated organizations, or those of the publisher, the editors and the reviewers. Any product that may be evaluated in this article, or claim that may be made by its manufacturer, is not guaranteed or endorsed by the publisher.
The Supplementary Material for this article can be found online at: https://www.frontiersin.org/articles/10.3389/fenrg.2022.837698/full#supplementary-material
Aguirre, A., Karwe, M. V., and Borneo, R. (2018). Effect of High Pressure Processing on Sugar-Snap Cookie Dough Preservation and Cookie Quality. J. Food Process. Preserv. 42 (1), e13407. doi:10.1111/jfpp.13407
Andrews, J. A., Siccama, T. G., and Vogt, K. A. (1999). The Effect of Soil Nutrient Availability on Retranslocation of Ca, Mg and K from Senescing Sapwood in Atlantic white Cedar. Plant Soil 208, 117–123. doi:10.1023/A:1004512317397
Bendig, J., Bolten, A., Bennertz, S., Broscheit, J., Eichfuss, S., and Bareth, G. (2014). Estimating Biomass of Barley Using Crop Surface Models (CSMs) Derived from UAV-Based RGB Imaging. Remote Sensing 6, 10395–10412. doi:10.3390/rs61110395
Bose, E., Leal, J. H., Hoover, A. N., Zeng, Y., Li, C., Ray, A. E., et al. (2020). Impacts of Biological Heating and Degradation during Bale Storage on the Surface Properties of Corn Stover. ACS Sustain. Chem. Eng. 8, 13973–13983. doi:10.1021/acssuschemeng.0c03356
Brand, M. A., Bolzon de Muñiz, G. I., Quirino, W. F., and Brito, J. O. (2011). Storage as a Tool to Improve wood Fuel Quality. Biomass Bioenerg. 35, 2581–2588. doi:10.1016/J.BIOMBIOE.2011.02.005
Cheah, W. Y., Sankaran, R., Show, P. L., Tg. Ibrahim, T. N. B., Chew, K. W., Culaba, A., et al. (2020). Pretreatment Methods for Lignocellulosic Biofuels Production: Current Advances, Challenges and Future Prospects. Biofuel Res. J. 7, 1115–1127. doi:10.18331/BRJ2020.7.1.4
Chinga, G., Johnsen, P. O., Dougherty, R., Berli, E. L., and Walter, J. (2007). Quantification of the 3D Microstructure of SC Surfaces. J. Microsc. 227, 254–265. doi:10.1111/j.1365-2818.2007.01809.x
Ding, L., Gruber, J. N., Ray, A. E., Donohoe, B. S., and Li, C. (2021a). Distribution of Bound and Free Water in Anatomical Fractions of Pine Residues and Corn Stover as a Function of Biological Degradation. ACS Sustain. Chem. Eng. 9 (47), 15884–15896. doi:10.1021/acssuschemeng.1c05606
Ding, L., Hoover, A. N., Emerson, R. M., Lin, K., Ray, A. E., Donohoe, B. S., et al. (2021b). Image Analysis for Rapid Assessment and Quality-Based Sorting of Corn Stover Dataset. Idaho National Laboratory. Bioenergy Feedstock Library. Available at: https://bioenergylibrary.inl.gov/data/dataset.aspx?id=1006. (Accessed March 12, 2021).
Eisenbies, M. H., Volk, T. A., and Patel, A. (2016). Changes in Feedstock Quality in Willow Chip Piles Created in winter from a Commercial Scale Harvest. Biomass Bioenerg. 86, 180–190. doi:10.1016/j.biombioe.2016.02.004
Gitelson, A. A., Viña, A., Arkebauer, T. J., Rundquist, D. C., Keydan, G., and Leavitt, B. (2003). Remote Estimation of Leaf Area index and green Leaf Biomass in maize Canopies. Geophys. Res. Lett. 30 (5), 1248–1251. doi:10.1029/2002GL016450
Gitelson, A. A., Peng, Y., Arkebauer, T. J., and Schepers, J. (2014). Relationships between Gross Primary Production, green LAI, and Canopy Chlorophyll Content in maize: Implications for Remote Sensing of Primary Production. Remote Sensing Environ. 144, 65–72. doi:10.1016/j.rse.2014.01.004
Groenewold, G. S., Hodges, B., Hoover, A. N., Li, C., Zarzana, C. A., Rigg, K., et al. (2020). Signatures of Biologically Driven Hemicellulose Modification Quantified by Analytical Pyrolysis Coupled with Multidimensional Gas Chromatography Mass Spectrometry. ACS Sustain. Chem. Eng. 8, 1989–1997. doi:10.1021/acssuschemeng.9b06524
Gudavalli, C., Bose, E., Donohoe, B. S., and Sievers, D. A. (2020). Real-time Biomass Feedstock Particle Quality Detection Using Image Analysis and Machine Vision. Biomass Conv. Bioref., 1–12. doi:10.1007/s13399-020-00904-w
Gupta, R. K., Prasad, T. S., and Vijayan, D. (2000). Relationship between LAI and NDVI for IRS LISS and LANDSAT TM Bands. Adv. Space Res. 26, 1047–1050. doi:10.1016/S0273-1177(99)01115-1
Haralick, R. M. (1979). Statistical and Structural Approaches to Texture. Proc. IEEE 67, 786–804. doi:10.1109/PROC.1979.11328
Hartley, D. S., Thompson, D. N., Griffel, L. M., Nguyen, Q. A., and Roni, M. S. (2020). Effect of Biomass Properties and System Configuration on the Operating Effectiveness of Biomass to Biofuel Systems. ACS Sustain. Chem. Eng. 8 (19), 7267–7277. doi:10.1021/acssuschemeng.9b06551
Hoover, A., Emerson, R., Williams, C. L., Ramirez-Corredores, M. M., Ray, A., Schaller, K., et al. (2019). Grading Herbaceous Biomass for Biorefineries: a Case Study Based on Chemical Composition and Biochemical Conversion. Bioenerg. Res. 12, 977–991. doi:10.1007/s12155-019-10028-3
Jannoura, R., Brinkmann, K., Uteau, D., Bruns, C., and Joergensen, R. G. (2015). Monitoring of Crop Biomass Using True Colour Aerial Photographs Taken from a Remote Controlled Hexacopter. Biosyst. Eng. 129, 341–351. doi:10.1016/j.biosystemseng.2014.11.007
Jiang, Q., Fang, S., Peng, Y., Gong, Y., Zhu, R., Wu, X., et al. (2019). UAV-based Biomass Estimation for Rice-Combining Spectral, TIN-Based Structural and Meteorological Features. Remote Sensing 11 (7), 890. doi:10.3390/rs11070890
Karperien, A., Ahammer, H., and Jelinek, H. F. (2013). Quantitating the Subtleties of Microglial Morphology with Fractal Analysis. Front. Cel. Neurosci. 7, 3. doi:10.3389/fncel.2013.00003
Krigstin, S., and Wetzel, S. (2016). A Review of Mechanisms Responsible for Changes to Stored Woody Biomass Fuels. Fuel 175, 75–86. doi:10.1016/j.fuel.2016.02.014
Lacey, J. A., Aston, J. E., and Thompson, V. S. (2018). Wear Properties of Ash Minerals in Biomass. Front. Energ. Res. 6, 119. doi:10.3389/fenrg.2018.00119
Lan, Z., and Liu, Y. (2018). Study on Multi-Scale Window Determination for GLCM Texture Description in High-Resolution Remote Sensing Image Geo-Analysis Supported by GIS and Domain Knowledge. Int. J. Geo. Inf. 7 (5), 175. doi:10.3390/ijgi7050175
Lati, R. N., Filin, S., and Eizenberg, H. (2013). Estimating Plant Growth Parameters Using an Energy Minimization-Based Stereovision Model. Comput. Electron. Agric. 98, 260–271. doi:10.1016/j.compag.2013.07.012
Li, C., Kerner, P., Williams, C. L., Hoover, A., and Ray, A. E. (2020). Characterization and Localization of Dynamic Cell Wall Structure and Inorganic Species Variability in Harvested and Stored Corn Stover Fractions as Functions of Biological Degradation. ACS Sustain. Chem. Eng. 8, 6924–6934. doi:10.1021/acssuschemeng.9b06977
Ma, R., Zhang, X., Wang, Y., and Zhang, X. (2018). New Insights toward Quantitative Relationships between Lignin Reactivity to Monomers and Their Structural Characteristics. Chemsuschem 11, 2146–2155. doi:10.1002/cssc.201800550
Mitra, A., Li, Y.-F., Klämpfl, T. G., Shimizu, T., Jeon, J., Morfill, G. E., et al. (2014). Inactivation of Surface-Borne Microorganisms and Increased Germination of Seed Specimen by Cold Atmospheric Plasma. Food Bioproc. Technol 7, 645–653. doi:10.1007/s11947-013-1126-4
Payne, C. E., and Wolfrum, E. J. (2015). Rapid Analysis of Composition and Reactivity in Cellulosic Biomass Feedstocks with Near-Infrared Spectroscopy. Biotechnol. Biofuels 8 (1), 1–14. doi:10.1186/s13068-015-0222-2
Piselli, A., Basso, M., Simonato, M., Furlanetto, R., Cigada, A., De Nardo, L., et al. (2017). Effect of Wear from Cleaning Operations on Sintered Ceramic Surfaces: Correlation of Surface Properties Data with Touch Perception and Digital Image Processing. Wear 390-391, 355–366. doi:10.1016/j.wear.2017.09.003
Qing, Q., and Wyman, C. E. (2011). Supplementation with Xylanase and β-xylosidase to Reduce Xylo-Oligomer and Xylan Inhibition of Enzymatic Hydrolysis of Cellulose and Pretreated Corn stover. Biotechnol. Biofuels 4 (1), 18–12. doi:10.1186/1754-6834-4-18
Qureshi, N., Saha, B. C., Hector, R. E., Dien, B., Hughes, S., Liu, S., et al. (2010). Production of Butanol (A Biofuel) from Agricultural Residues: Part II - Use of Corn stover and Switchgrass Hydrolysates☆. Biomass and Bioenergy 34, 566–571. doi:10.1016/j.biombioe.2009.12.023
Ray, A. E., Williams, C. L., Hoover, A. N., Li, C., Sale, K. L., Emerson, R. M., et al. (2020). Multiscale Characterization of Lignocellulosic Biomass Variability and its Implications to Preprocessing and Conversion: a Case Study for Corn Stover. ACS Sustain. Chem. Eng. 8, 3218–3230. doi:10.1021/acssuschemeng.9b06763
Rentizelas, A. A. (2016). Biomass Storage. Biomass Supply Chains for Bioenergy and Biorefining, 127–146. doi:10.1016/B978-1-78242-366-9.00006-X
Sievers, D. A., Kuhn, E. M., Thompson, V. S., Yancey, N. A., Hoover, A. N., Resch, M. G., et al. (2020). Throughput, Reliability, and Yields of a Pilot-Scale Conversion Process for Production of Fermentable Sugars from Lignocellulosic Biomass: A Study on Feedstock Ash and Moisture. ACS Sustain. Chem. Eng. 8, 2008–2015. doi:10.1021/acssuschemeng.9b06550
Skovsen, S., Dyrmann, M., Mortensen, A., Steen, K., Green, O., Eriksen, J., et al. (2017). Estimation of the Botanical Composition of Clover-Grass Leys from RGB Images Using Data Simulation and Fully Convolutional Neural Networks. Sensors 17 (12), 2930. doi:10.3390/s17122930
Sluiter, J. B., Ruiz, R. O., Scarlata, C. J., Sluiter, A. D., and Templeton, D. W. (2010). Compositional Analysis of Lignocellulosic Feedstocks. 1. Review and Description of Methods. J. Agric. Food Chem. 58, 9043–9053. doi:10.1021/jf1008023
Smith, T. G., Lange, G. D., and Marks, W. B. (1996). Fractal Methods and Results in Cellular Morphology - Dimensions, Lacunarity and Multifractals. J. Neurosci. Methods 69, 123–136. doi:10.1016/S0165-0270(96)00080-5
Swain, K. C., Thomson, S. J., and Jayasuriya, H. P. W. (2010). Adoption of an Unmanned Helicopter for Low-Altitude Remote Sensing to Estimate Yield and Total Biomass of a Rice Crop. Trans. Asabe 53, 21–27. doi:10.13031/2013.29493
Thörnqvist, T. (1985). Drying and Storage of forest Residues for Energy Production. Biomass 7, 125–134. doi:10.1016/0144-4565(85)90038-1
Thy, P., Yu, C., Jenkins, B. M., and Lesher, C. E. (2013). Inorganic Composition and Environmental Impact of Biomass Feedstock. Energy Fuels 27, 3969–3987. doi:10.1021/ef400660u
Tilly, N., Hoffmeister, D., Cao, Q., Huang, S., Lenz-Wiedemann, V., Miao, Y., et al. (2014). Multitemporal Crop Surface Models: Accurate Plant Height Measurement and Biomass Estimation with Terrestrial Laser Scanning in Paddy rice. J. Appl. Remote Sens 8 (1), 083671. doi:10.1117/1.JRS.8.083671
US DOE (2016). 2016 Billion-Ton Report: Advancing Domestic Resources for a Thriving Bioeconomy, Volume 1: Economic Availability of Feedstocks. Editors M. H. Langholtz, B. J. Stokes, and L. M. Eaton (Oak Ridge: Oak Ridge National Laboratory). ORNL/TM-2016/160.
Wagner, M., and Horn, H. (2017). Optical Coherence Tomography in Biofilm Research: A Comprehensive Review. Biotechnol. Bioeng. 114, 1386–1402. doi:10.1002/bit.26283
Wang, M. F., Chen, X. K., Jiang, E. C., Wu, Y. J., Zhang, S. J., and Li, S. B. (2015). Biochar Absorption Characteristics Based on RGB Analysis of Scanned Images. Trans. Chin. Soc. Agric. Machinery 12, 12. doi:10.6041/j.issn.1000-1298.2015.12.028
Keywords: image analysis, rapid detection, corn stover, biological degradation, chemical composition, feedstock variability, FT-IR
Citation: Ding L, Hoover AN, Emerson RM, Lin K-T, Gruber JN, Donohoe BS, Klinger JL, Colby RD, Thomas BJ, Smith WA and Ray AE (2022) Image Analysis for Rapid Assessment and Quality-Based Sorting of Corn Stover. Front. Energy Res. 10:837698. doi: 10.3389/fenrg.2022.837698
Received: 16 December 2021; Accepted: 14 January 2022;
Published: 03 February 2022.
Edited by:
Hu Li, Guizhou University, ChinaCopyright © 2022 Ding, Hoover, Emerson, Lin, Gruber, Donohoe, Klinger, Colby, Thomas, Smith and Ray. This is an open-access article distributed under the terms of the Creative Commons Attribution License (CC BY). The use, distribution or reproduction in other forums is permitted, provided the original author(s) and the copyright owner(s) are credited and that the original publication in this journal is cited, in accordance with accepted academic practice. No use, distribution or reproduction is permitted which does not comply with these terms.
*Correspondence: Ling Ding, TGluZy5EaW5nQGlubC5nb3Y=; Allison E. Ray, QWxsaXNvbi5SYXlAaW5sLmdvdg==
Disclaimer: All claims expressed in this article are solely those of the authors and do not necessarily represent those of their affiliated organizations, or those of the publisher, the editors and the reviewers. Any product that may be evaluated in this article or claim that may be made by its manufacturer is not guaranteed or endorsed by the publisher.
Research integrity at Frontiers
Learn more about the work of our research integrity team to safeguard the quality of each article we publish.