- 1Electric Engineering College, Tibet Agriculture and Animal Husbandry University, Linzhi, China
- 2Electric Power Research Institute of State Grid Tibet Electric Power Co., Ltd, Linzhi, China
With the integration of distributed generators (DGs) and multiple types of loads, it is increasingly difficult to cope with the uncertainties of DGs, which brings challenges to the secure operation of distribution networks (DNs). Source and load cannot obtain the power balance locally, which may cause operational problems such as line power overload and node voltage violation. However, the methods for quantitatively analyzing the operating status of DNs have not yet formed a unified standard. For which reason, the concept of operating margin is proposed in this study, to represent the distance from the operating point to the boundary. In this study, to generally evaluate the operating status of DNs, the concept of node power margin is proposed first. Then the evaluation indexes including line power margin (LPM) and node voltage margin (NVM) are introduced. The quantitative calculation method for system operating margin (SOM) is further elaborated, which is supposed to be the evaluation indexes on system level. After that, the analysis process of evaluation methods for SOM is discussed. Finally, case studies are performed on the modified IEEE 33-node system to evaluate the operating margin of DNs and verify the enhancement brought by the energy storage system (ESS) and soft open point (SOP) through the flexible adjustment of power flow. The simulation results show that the distance between the DN and the security boundary is effectively quantified through the proposed method, the value can be easily calculated, and the change can be clearly reflected.
Introduction
Distributed generator (DG) refers to a promising solution to the energy crisis and environmental pollution, which is positive for both economy and reliability (Hung et al., 2014). DGs such as solar photovoltaic panels have been increasingly integrated into distribution networks (DNs) recently (Hui and Yi, 2014). However, affected by the meteorological conditions, the energy sources of DG are often periodic or intermittent (Hessami, 2006). For which reason, the output of DGs has a strong uncertainty and needs to be established (Barsoum et al., 2008). At the same time, the uncertainty of the load demand in DNs has increased considering the access to multiple types of loads. The uncertainties of load demand and DG output aggravate the imbalance of electricity supplies and demand. On the nodes, the node power cannot be fully balanced (Zhang et al., 2018). On the lines, the line power is affected by the degree of node power imbalance. Thus, the direction and magnitude of line power are uncertain, which causes the problems of secure operation such as line power overload and node voltage violation (i.e., the node voltage often fluctuates around nominal voltage of the system and sometimes voltage fluctuation occurs). At this time, traditional DN cannot realize the reliable and flexible operation. So the controllable device is installed to ensure that the system has adjustment ability, as can be seen in the study by (Chen et al., 2017; Cong et al., 2017; Grzanic et al., 2019). The secure operation constraints are emphasized to solve the problems of voltage deviation and line overload. Grzanic et al. (2019) discussed the topic about voltage deviations and line overloading during peak times considering the installation of flexible loads. Chen et al. (2017) proposed an optimization method for DN considering the secure state of the system. Further considering the prediction errors of renewable energy generation, a day-ahead active power scheduling method considering DG forecast errors is proposed in the study by (Cong et al., 2017). However, the existing research mainly considers the scheduling of DN. There are few evaluation methods for the operation status of DN.
In order to fully grasp the operation status of DN, it is necessary to evaluate the operation scenarios based on actual operation data. The widely used methods for quantifying operating status of DN mainly include online monitoring technique (Abu-Siada and Islam, 2012), the Monte Carlo simulation (Lim et al., 2006), inter-temporal simulation, and optimization method (Liao, 2019). The current methods for evaluating operating status have reflected the ability of DN to cope with the uncertainties of source and load (Zhong et al., 2020). In addition, the scenarios of voltage violation (Banerjee and Chanda, 2012) and line overload (Sun et al., 1109) are also adopted to represent the evaluation indexes. These methods have obvious differences in properties of evaluation indexes and application scenarios (Yan and Li, 2020). The existing research analyzed and discussed the operating state of the system. However, the research has limitations, which are mainly reflected in the evaluation indicators and analysis framework. The existing methods are mainly aimed at the operation of DN, and the margins are not fully covered. To further ensure the reliable and flexible operation of DN, operating margin can be defined to represent the distance from the operating point to the boundary. The operating status of DN can be evaluated by the indexes of operating margin. However, the research on the operating margin of DN with high penetration of DGs is still in its infancy.
With the development of power electronic technology, controllable devices are increasingly integrated into DN. The functions of DN gradually cover power transmission, delivery, collection, storage, etc. It provides an opportunity for the reliable, secure, and flexible operation of DN. In recent years, the fully controlled power electronic devices such as the energy storage system (ESS) (Kabir et al., 2014) and soft open point (SOP) (Cao et al., 2016) brought opportunity for the flexible dispatch of DN. For example, SOP can continuously regulate the transmission of active power between feeders while supporting reactive power to the connected nodes. As mentioned in the study by (Guo et al., 2020), SOP can reduce the line load rate, improve the security of DN by reducing the line load rate or reduce the degree of node voltage deviation, and effectively improve the flexibility of DN. Particularly, when DGs are centralized and connected to a feeder, SOP can effectively alleviate power fluctuations and release reverse power transmission. With the integration of SOP, the flow adjustment between feeders can be realized, the regulating ability can be effectively enhanced, and operating margin can be further improved.
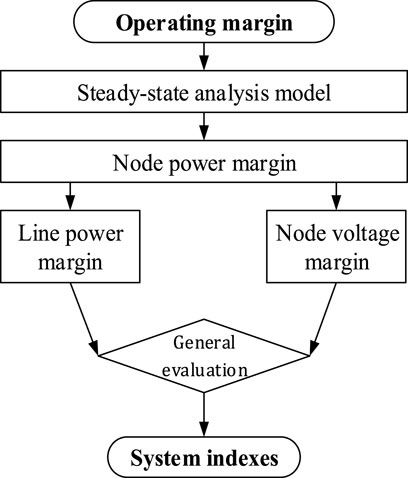
In order to quantitatively evaluate the operating status of DN, a unified framework of quantifying system operating margin (SOM) and several evaluation indexes are proposed in this study, which can be seen in Figure 1. The key contributions of this study are as follows:
1) The quantification of node power margin is proposed to represent the power-regulating ability of the controllable device connected to the node.
2) The evaluation method for system operating status is introduced, including the operational constraints of DN and the evaluation indexes. Line power margin (LPM), node voltage margin (NVM), and SOM are further proposed. Compared with the traditional indicators, the indexes proposed in this article are more intuitive and more convincing.
3) The improvement method for SOM is elaborated, including the improvement of measurement accuracy and the improvement of regulating ability.
The rest of the article is organized as follows: Model of Distribution Network With Controllable Devices briefly introduces the model of DN with controllable devices, which is the basis of the research. Evaluation Method for System Operating Margin proposes the framework of evaluating the SOM. Definitions of the line power margin, node voltage margin, and evaluation indexes on the system level are further elaborated, which is the innovation of this article. The analysis process and calculation method of SOM are discussed in Analysis Process of System Operating Margin, which is the summary of the proposed method. Case Studies and Analysis denotes the simulations and results. The conclusion is described in Conclusion, that is, with the integration of the ESS and SOP, the operation margin index is improved, and the network operation loss of the distribution network is further reduced.
Model of Distribution Network With Controllable Devices
With the widespread access to DG, the power flow of DN has become more and more complicated. Therefore, it is necessary to construct a power flow calculation model for DN and conduct a quantitative analysis method for the operation status of the whole network. At the same time, the integration of new types of controllable equipment has an impact on the traditional evaluation methods. Therefore, the operation constraints of controllable devices need to be further considered.
The improvement of system operating status is mainly divided into measurement accuracy improvement and regulating ability improvement. Measurement accuracy refers to the real-time monitoring of uncertain factors in DN to accurately determine the balance of supply and demand. By improving measurement accuracy, it can effectively reduce the impact of uncertainty and improve system operation status. The improvement of measurement accuracy is mainly aimed at monitoring and coordinating the trend of DN. By installing telemetry units or other equipment at the centrally integrated DGs or large loads, the operational characteristics of DGs and loads can be accurately grasped. Furthermore, the fluctuation trends of DG outputs can be obtained in advance through various methods, such as short-term fluctuation trend forecasting, long-term forecasting, and weather forecast. So the scheduling plans of controllable devices can be early formulated. Regulating ability refers to the regulation of power flow to meet the requirements of security and reliability, and to prevent secure operation constraints from being destroyed. The improvement of regulating ability is mainly for real-time regulation of the power flow of DN.
Steady-State Analysis Model of Distribution Network
This study is oriented to the medium-voltage DN, for which reason the following basic assumptions are made. A steady-state analysis model of DN is proposed:
1) DN is in a stable operating state. There are no oscillations or faults in the system;
2) The complex operational status is simplified, and three-phase imbalance problem in DN is ignored;
3) DN is supposed to maintain radial operation under steady-state scenarios.
As nodes are connected and interact through grids, the power imbalance of nodes requires power transmission through DN (Cao et al., 2016). If we want to study the operation state of DN, the steady-state analysis model of DN needs to be established. The line power transmission constraints and node voltage constraints are considered, which are limited by the capability of branches and system operational constraints. In order to ensure the safe and reliable power supply of DN, secure operation constraints are needed. Therefore, based on the DistFlow model, the steady-state analysis model of DN is proposed.
Power Flow Constraints of Distribution Network
First, we need to establish the power flow model of DN. In a radial DN, there is only one path between node
According to the model of the node power margin and linearized DistFlow power flow model (Baran and Wu, 1989a), the relation constraints between line power, node voltage, and power injection are constructed. At the same time, considering the conversion between line power and line current, the nonlinear expression of current in Equation 1 is ignored.
In constraint (2),
Secure Operation Constraints of Distribution Network
Then the security of DN needs to be considered, which is defined as the secure operation constraints. Due to the limitation of line transmission capacity and node voltage deviation, the power between nodes cannot be freely exchanged. Secure operation constraints denote that there is no line overload and node voltage violation in DN.
Operational Constraints of Controllable Devices
To optimize the operation status of DN, various controllable devices are widely integrated. Operational constraints are defined as the regulation capacity constraints of controllable devices. With the development of power electronic technology, the output of controllable devices can be easily adjusted by the change of the conduction angle of converters. The operational constraints of controllable devices are considered. Take operational constraint of SOP as an example.
SOP is based on fully controlled power electronic devices, which can quickly and accurately control their own power outputs, thereby regulating the power flow of the entire DN. SOP can realize the dynamic power balance of DN by real-time adjustment of power flow between feeders, which effectively improves the operating status of line, and reduces the voltage deviation of node at the same time. The flexible interconnection between different feeders are realized by the integration of SOP. The active and reactive power outputs of each converter are used as the control variables of SOP. Because of the DC isolation, the reactive power output of each converter is independent. Although the operation efficiency of B2B-VSC is sufficiently high, the operational losses arise when large-scale power transfer occurs. Loss factors are considered in the operational constraints. The operational constraints of SOP are shown in constraint (4).
In Eq. 4,
Evaluation Model of Node Power Margin
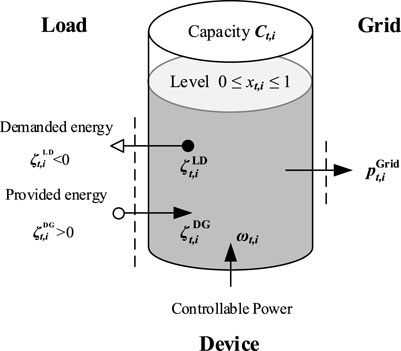
Based on the power node model (Ulbig and Andersson, 2015), the power exchange at node can be analyzed. Further considering the integration of controllable devices and their operational constraints, a unified model of power change at node is established. As can be seen from constraint (5) and Figure 2, the power exchange between the grid and the device is analyzed.
According to the analysis above, in order to maintain schedulable capacity at node, the concept of node power margin (NPM) is proposed, which is defined as the minimum value of adjustable regulating power of the node, as shown in Equation 6. NPM represents the node’s ability to adjust its net load, which also represents the distance from the schedulable device to the scheduling boundary.
Evaluation Method for System Operating Margin
In order to fully grasp the operation status of DN, it is necessary to evaluate the operation status based on actual operation data. These methods have obvious differences in properties of evaluation indexes and application scenarios. To further ensure the reliable and flexible operation of DN, operating margin is proposed to represent the distance from the operating point to the boundary. The source nodes and load nodes cannot obtain the balance locally, which may cause the problems of secure operation such as line power overload and node voltage violation. Therefore, in order to quantify the operating status of DN in a better way, this study proposes an evaluation model for the operating margin of DN.
Line Power Margin
In the case of line power overload, the line’s forward (or reverse) regulation capacity is close to zero, since the overloaded lines cannot withstand larger loads or consume more DG outputs. Furthermore, the uncertainty of line transmission power is not conducive to the flexible and reliable operation of DN, which may cause congestion of line (Sun et al., 2018). Meanwhile, the volatility of node voltage affects the secure and reliable power supply of DN. The excessive voltage deviation may cause equipment shutdown or insulation breakdown. When the line power reaches the upper limit or the deviation of node voltage reaches the maximum, DN cannot maintain flexible operation and controllable devices are required to ensure that DN has enough adjustment capability. Thus, to prevent line overload or node voltage violation, secure operation constraints are considered in the dispatch of DN.
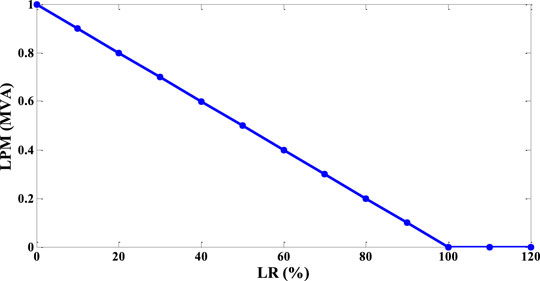
The main indicator used in the traditional method of evaluating the operating status of a line is the load rate (LR). However, the LR cannot intuitively express the dispatchable power of a line. To quantify the distance of the DN from the secure operation boundaries, the concept of line power margin (LPM) is proposed in this study. LPM reflects the operation status of a line in the worst case in the DN, which is defined as the minimum value of adjustable regulating capacity, as shown in Eq. 7.
When
Node Voltage Margin
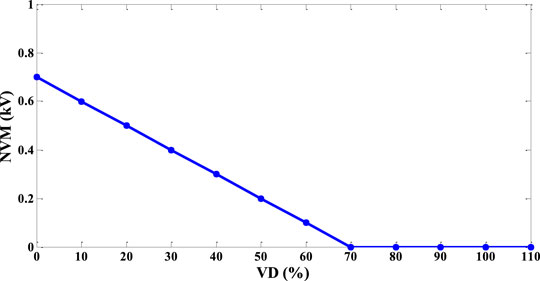
The volatility of the node voltage affects the safe and reliable power supply of DN. Excessive voltage deviation may cause equipment shutdown, insulation breakdown, or other problems. Furthermore, the concept of node voltage margin (NVM) is proposed in this study. NVM reflects the operation status of a node in the worst case in the DN, which is defined as the minimum value of node voltage from the secure operation boundary, as shown in Eq. 9.
The traditional evaluation method mainly uses the indicator of voltage deviation (VD). However, VD needs to be unitized from the actual measurement data in practical applications, which has disadvantages in volume of data and calculation. Similar to the analysis of LPM, when NVM is large, the operating status of node is more flexible. When the node voltage margin is low and close to 0, the node voltage will reach the preset secure boundary. The security of DN is about to be destroyed, while the operation strategies of controllable devices need to be adjusted to reduce voltage deviation. Considering that in the process of setting secure operation boundaries, the voltage boundaries are often symmetrically set around 1.0 p. u, the relationship between NVM and voltage deviation can be expressed as Equation 10, in which
Evaluation Indexes on System Level
Based on the analysis above, the operating margin of DN is further evaluated on the system level. Considering the large number of nodes in DN, not every node has the ability to adjust its own net load, so the node power margin index NPM is no longer applicable on the system level. Inspired by the barrel theory, under the secure operation constraints, the operating status of DN depends on the line with the worst operating state, or the node with the largest voltage deviation. On the worst case, the line power margin index LPM reflects the operation of a line with the highest load rate in DN, and the node voltage margin index NVM reflects a node with the largest voltage deviation. The evaluation indexes on the system level need to take LPM and NVM into account and comprehensively reflect the distance of the system from the operating boundaries. Therefore, LPM and NVM are normalized, as shown in Equation 11.
The general evaluation index on the system level is further constructed, which considers the above two indexes separately. The combined formulation is defined as system operation margin (SOM), as shown in Equation 12.
In Equation 12,
Analysis Process of System Operating Margin
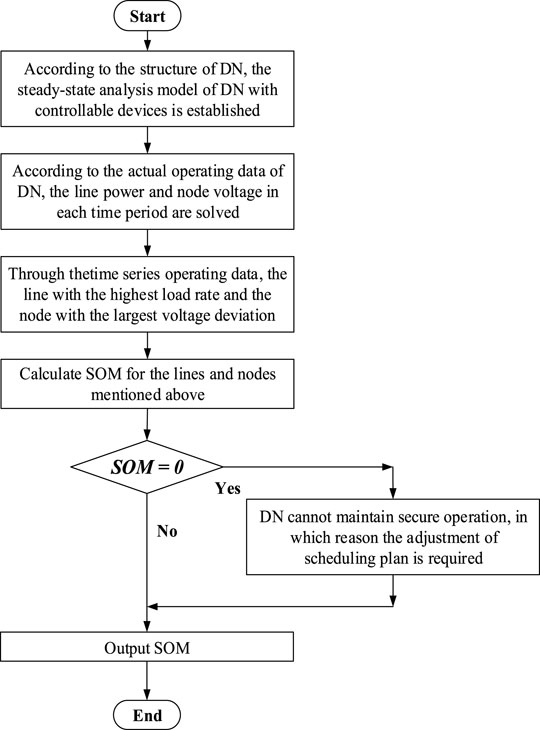
According to the analysis above, SOM reflects the operation of DN on the system level. A unified framework of quantifying SOM is proposed in this study. Several evaluation indexes are proposed in this study. The analysis flow chart of SOM is shown in Figure 5.
1) According to the structure of DN and the integration of controllable devices, the steady-state analysis model of DN with controllable devices is established;
2) According to the actual operating data of DN, the line power and node voltage in each time period are solved through the method of second-order cone program (Ji et al., 2017).
3) Through the obtained time series operating data, the line with the highest load rate and the node with the largest voltage deviation, that is, the worst operating point, is selected to reflect the distance from the operating status of DN to the security boundaries;
4) SOM is adopted as the evaluation index. Calculate SOM for the lines and nodes mentioned above;
5) Determine whether zero appears in SOM;
6) When zero appears in SOM, it means that the system cannot maintain secure operation, for which reason the adjustment of the scheduling plan is required;
7) When there is no zero in SOM, SOM indicates the operating margin of the system, output SOM.
Case Studies and Analysis
Test Setting
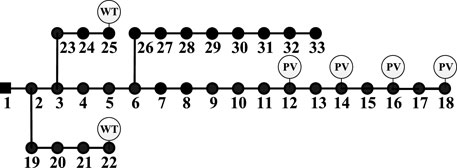
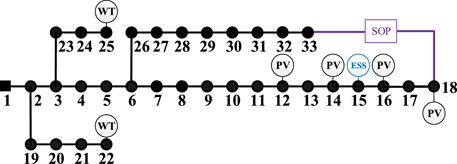
The modified IEEE 33-node distribution system with 32 branches is shown in Figure 6, whose voltage level is 12.66 kV. The detailed parameters are provided in the study by (Baran and Wu, 1989b). To fully consider the impact of high penetration of DGs, four photovoltaics (PVs) of 500.0 kVA are connected to nodes 12, 14, 16, and 18, and two wind turbines (WTs) of 800 kVA are connected to node 22 and node 25. The power factors of DGs are set as 0.9. The maximum value of line power transmission is set as 8 MVA. The lower and upper boundaries of node voltage are set from 0.9 p.u. to 1.1 p.u. In this study, the PQ control mode of converters is adopted, for which reason DGs can be seen as PQ nodes.
The proposed method is implemented in the YALMIP (LofbergYALMIP, 2004) optimization toolbox using MATLAB R2016b and solved by using IBM ILOG CPLEX 12.6. The numerical experiments were performed on a PC with an Intel(R) Core(TM) i5-5300 M 3.20-GHz processor and 16 GB of RAM.
Evaluation of System Operating Margin
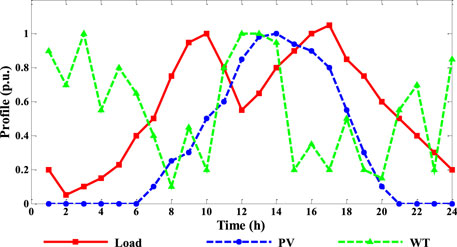
Considering the time sequence analysis of 24 h, the simulation step is set as 1 h. In this study, the typical operational curves are adopted to describe the uncertainty of DG outputs and load demands, which is shown in Figure 7. The curve of load demand is obtained by using the load forecasting method and the value of each simulation step is the average value within 60 min. The processing methods of DG outputs are the same.
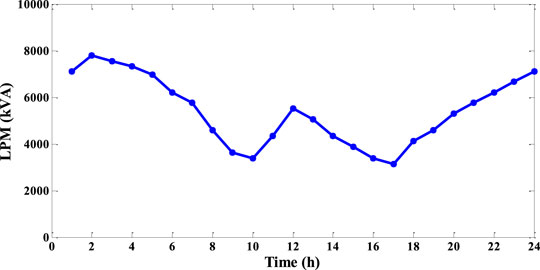
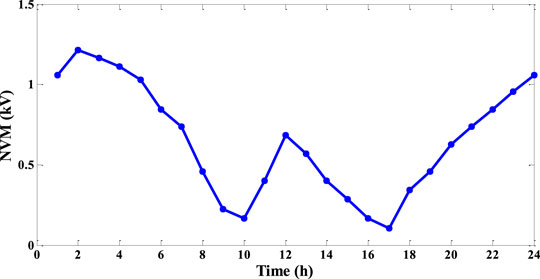
The operating indexes of LPM and NVM in each period are shown in Figure 8 and Figure 9. During the time periods 9:00-10:00 and 16:00-17:00, the operating margin index is low due to the increment of load demand. Meanwhile, during time periods 1:00-6:00 and 22:00-24:00, the DG output is matched with the load demand so that LPM and NVM are both high. As can be seen from Figure 8 and Figure 9, the indexes have time-series fluctuation characteristics. Considering that LPM, NVM, and SOM are based on the worst case of DN, the results are shown in Table 1. It can be seen that the power transmission of branch 1 and the voltage of node 18 frequently approach the threshold. Thus, the evaluation indexes can be improved by replacing the related line or configuring the corresponding controllable devices at the above vulnerable links.
Influence Factor of System Operating Margin
To verify the promotion on SOM brought by controllable devices, two new types of power electronic devices are considered in the system, as can be seen in Figure 10. The SOP with a capability of 1,000.0 kVA is installed between nodes 18 and 33. It is assumed that the loss coefficient of each converter is 0.02 (Ji et al., 2017). The ESS is further integrated at node 15, the maximum energy reservoir capacity of which is 1,000.0 kWh. The lower limit of the state of charge (SOC) of ESS is set to 20% and the initial value is set as 50%. PQ control mode of converters is adopted in this study.
To quantify the benefits of controllable devices in improving regulating ability, three scenarios are adopted to evaluate SOM in DN with high penetration of DGs. The optimization goal is set to reduce the operational loss of DN.
Scheme I: Without the controllable device, the initial operation state of system is obtained.
Scheme II: ESS is integrated to improve security.
Scheme III: Based on Scheme II, SOP is further integrated.
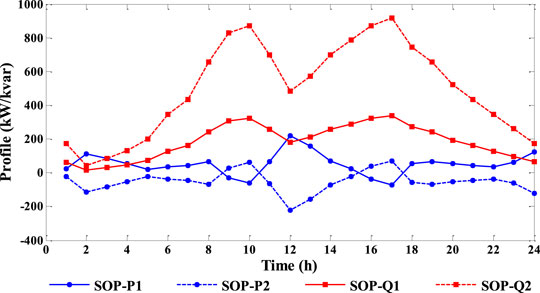
The operating margin indexes and operational loss of DN in a day under different schemes are shown in Table 2. In Scheme I, the high penetration of DGs aggravates the condition of power imbalance, which results in insufficiency of regulating ability, and LPM, NVM, and SOM are all at low level. However, the integration of controllable devices effectively strengthens the system regulating ability. The evaluation indexes including LPM, NVM, and SOM are both increased due to the improvement of regulating ability. In Scheme II, the ESS is used to improve the adjustment ability within different time periods through the energy storage and release. However, considering that SOC needs to be reset after daily operation, the improvement of SOM is limited. In Scheme III, SOP is further integrated to realize the connectivity between feeders, which effectively improves the regulating ability of the system. The detailed operation analysis diagram of SOP in Scheme III is shown in Figure 11. As can be seen from Figure 11, the operational status of SOP has time-series fluctuation characteristics. By power transmission and compensation of reactive power, the SOM is effectively improved. As can be seen from Table 2, the operating status of DN is optimized. Furthermore, with the integration of controllable devices, the operational loss of DN is reduced due to the optimization of operating status.
Furthermore, the lines and nodes that limit the indicator of SOM are analyzed and the worst case of lines and nodes in each Scheme are proposed in Table 3. It can be seen that the worst case of lines is determined since line 1 is closest to the substation. However, the node with the largest voltage deviation has changed.
To ensure that the integration of controllable devices does not affect the nodes with larger NVMs, the detailed parameters of nodes 18, 30, and 33 are shown in Table 4. It can be seen that the NVMs of these nodes are all increased, but the voltage margin of node 18 is the smallest in Scheme I, while node 33 is the smallest in Scheme II and node 30 is the smallest in Scheme III. As a reason, the node number in Table 4 is different in these schemes. In conclusion, with the integration of controllable devices, the indicator of SOM is improved and operating status of DN is optimized at the same time.
Conclusion
With the integration of DGs and multiple types of loads, the uncertainty in DN is increasing continuously, which puts forward a higher requirement for the secure operation of DN. To increase it is increasingly difficult with regard to coping with the uncertainties of DG outputs and brings challenges to the secure operation of DN. In this study, to generally evaluate the operating status of DN, the concept of node power margin is proposed first. Then the evaluation indexes including LPM and NVM are introduced. The quantitative calculation method for SOM is further elaborated. Case studies are performed on the modified IEEE 33-node system. The conclusion is as follows.
The proposed quantitative evaluation model and indicators for SOM can effectively reflect the actual operation status of the network. The simulation results show that the distance between the DN and the security boundary is effectively quantified through the proposed method, the value can be easily calculated, and the change can be clearly reflected. Compared with the traditional indicators, the indexes proposed in this article are more intuitive and more convincing. When SOM is decreased and approaches zero, it reflects that the system is close to the upper or lower limits.
Results show that with the integration of the ESS and SOP, the evaluation indexes of LPM, NVM, and SOM are increased and the operating status of DN is improved. Therefore, with the integration of controllable devices, it will increase SOM. Research on SOP connecting multiple distribution networks is the focus of the next step (Li et al., 2018)
Data Availability Statement
The original contributions presented in the study are included in the article/Supplementary Materials, further inquiries can be directed to the corresponding author.
Author Contributions
RZ: Writing the manuscript and data analysis; YD: Writing the manuscript and data analysis; WZ: Writing the manuscript and data analysis; XG: Writing the manuscript and data analysis; BT: Writing the manuscript and data analysis.
Funding
This work was supported by the National Natural Science Foundation of China (No. 52167015- Research on regulation of high penetration of renewable energy applied to wind/light energy rich areas in Tibet).
Conflict of Interest
YD and WZ were employed by the Company Electric Power Research Institute of State Grid Tibet Electric Power Co., Ltd.
The remaining authors declare that the research was conducted in the absence of any commercial or financial relationships that could be construed as a potential conflict of interest.
Publisher’s Note
All claims expressed in this article are solely those of the authors and do not necessarily represent those of their affiliated organizations, or those of the publisher, the editors, and the reviewers. Any product that may be evaluated in this article, or claim that may be made by its manufacturer, is not guaranteed or endorsed by the publisher.
References
Abu-Siada, A., and Islam, S. (2012). A Novel Online Technique to Detect Power Transformer Winding Faults. IEEE Trans. Power Deliv. 27 (2), 849–857. doi:10.1109/tpwrd.2011.2180932
Banerjee, S., and Chanda, C. K.. “Voltage Stability Margin of Distribution Networks for Composite Loads,” in Proceedings of the India Conference of IEEE, Kochi, India, 7 December 2012, IEEE
Baran, M. E., and Wu, F. F. (1989). Network Reconfiguration in Distribution Systems for Loss Reduction and Load Balancing. IEEE Trans. Power Deliv. 4, 1401–1407. doi:10.1109/61.25627
Baran, M. E., and Wu, F. F. (1989). Optimal Capacitor Placement on Radial Distribution Systems. IEEE Trans. Power Deliv. 4, 725–734. doi:10.1109/61.19265
Barsoum, N., Yiin, W. Y., Tan, K. L., and Goh, W. C.. “Modeling and Cost Simulation of Stand-Alone Solar and Biomass Energy,” in Proceedings of the Second Asia International Conference on IEEE Computer Society, Kuala Lumpur, Malaysia, 13 May 2008, IEEE.
Cao, W., Wu, J., Jenkins, N., Wang, C., and Green, T. (2016). Benefits Analysis of Soft Open Points for Electrical Distribution Network Operation. Appl. Energ. 165, 36–47. doi:10.1016/j.apenergy.2015.12.022
Chen, F., Liu, D., and Xiong, X. (2017). Research on Stochastic Optimal Operation Strategy of Active Distribution Network Considering Intermittent Energy. Energies 10, 522. doi:10.3390/en10040522
Cong, P., Tang, W., Zhang, L., Zhang, B., and Cai, Y. (2017). Day-ahead Active Power Scheduling in Active Distribution Network Considering Renewable Energy Generation Forecast Errors. Energies 10, 1291. doi:10.3390/en10091291
Grzanic, M., Flammini, M., and Prettico, G. (2019). Distribution Network Model Platform: a First Case Study. Energies 12, 4079. doi:10.3390/en12214079
Guo, X., Huo, Q., Wei, T., and Yin, J. (2020). A Local Control Strategy for Distributed Energy Fluctuation Suppression Based on Soft Open point. Energies 13, 1520.
Hessami, Mir-Akbar. (2006). Designing a Hybrid Wind and Solar Energy Supply System for a Rural Residential Building. Int. J. Low Carbon Tech. 1. doi:10.1093/ijlct/1.2.112
Hui, L., and Yi, H. (2014). Multilevel Governance and Deployment of Solar PV Panels in U.S. Cities - ScienceDirect. Energy Policy 69 (2), 19–27.
Hung, D. Q., Mithulananthan, N., and Bansal, R. C. (2014). Integration of PV and BES Units in Commercial Distribution Systems Considering Energy Loss and Voltage Stability. Appl. Energ. 113, 1162–1170. doi:10.1016/j.apenergy.2013.08.069
Ji, H., Wang, C., Li, P., Zhao, J., Song, G., Ding, F., et al. (2017). An Enhanced SOCP-Based Method for Feeder Load Balancing Using the Multi-Terminal Soft Open point in Active Distribution Networks. Appl. Energ. 208, 986–995. doi:10.1016/j.apenergy.2017.09.051
Kabir, M. N., Mishra, Y., Ledwich, G., Xu, Z., and Bansal, R. C. (2014). Improving Voltage Profile of Residential Distribution Systems Using Rooftop PVs and Battery Energy Storage Systems. Appl. Energ. 134, 290–300. doi:10.1016/j.apenergy.2014.08.042
Li, H., Qiang, W., and Gao, Y. (2018). Charging Station Planning Considering Users' Travel Characteristics and Line Availability Margin of Distribution Network. Automation Electric Power Syst. 42 (23), 48–56.
Liao, H. (2019). Review on Distribution Network Optimization under Uncertainty. Energies 12. doi:10.3390/en12173369
Lim, S.-I., Lee, S.-J., Choi, M.-S., Lim, D.-J., and Park, D.-H. (2006). Restoration index in Distribution Systems and its Application to System Operation. IEEE Trans. Power Syst. 21, 1966–1971. doi:10.1109/tpwrs.2006.882468
LofbergYALMIP, J.. A Toolbox for Modeling and Optimization in MATLAB,” in Proceedings of the 2004 IEEE international symposium on computer aided control systems design, Taipei, Taiwan, 2 September 2004, IEEE, 284–289.
Sun, H., Yuan, P., Sun, Z., Hu, S., Peng, F., and Zhou, W. (2018). Distribution Network Congestion Dispatch Considering Time-Spatial Diversion of Electric Vehicles Charging. Energies 11, 2820. doi:10.3390/en11102820
Sun, W., Yang, J., Jia, S., and Wei, Z.. Evaluation index System of Power Supply Margin in Distribution Network,” in Proceedings of the 22nd International Conference Electronics, Palanga, Lithuania, 18 June 2018, IEEE. doi:10.1109/electronics.2018.8443647
Ulbig, A., and Andersson, G. (2015). Analyzing Operational Flexibility of Electric Power Systems. Int. J. Electr. Power Energ. Syst. 72, 155–164. doi:10.1016/j.ijepes.2015.02.028
Yan, X., and Li, R. (2020). Flexible Coordination Optimization Scheduling of Active Distribution Network with Smart Load. IEEE Access 8, 59145–59157. doi:10.1109/access.2020.2982692
Zhang, S., Cheng, H., Wang, D., Zhang, L., Li, F., and Yao, L. (2018). Distributed Generation Planning in Active Distribution Network Considering Demand Side Management and Network Reconfiguration. Appl. Energ. 228, 1921–1936. doi:10.1016/j.apenergy.2018.07.054
Keywords: operating margin, distribution network, quantitative analysis, distributed generator, modified IEEE 33-node system
Citation: Zhu R, Dong Y, Zhao W, Gong X and Tang B (2022) Quantitative Analysis of System Operating Margin With the High Penetration of Distributed Generators in Distribution Networks. Front. Energy Res. 10:833817. doi: 10.3389/fenrg.2022.833817
Received: 12 December 2021; Accepted: 14 March 2022;
Published: 26 April 2022.
Edited by:
Mingxi Liu, The University of Utah, United StatesReviewed by:
Xiang Huo, The University of Utah, United StatesNarottam Das, Central Queensland University, Australia
Hongxun Hui, University of Macau, China
Copyright © 2022 Zhu, Dong, Zhao, Gong and Tang. This is an open-access article distributed under the terms of the Creative Commons Attribution License (CC BY). The use, distribution or reproduction in other forums is permitted, provided the original author(s) and the copyright owner(s) are credited and that the original publication in this journal is cited, in accordance with accepted academic practice. No use, distribution or reproduction is permitted which does not comply with these terms.
*Correspondence: Ruijin Zhu, emh1cnVpamluQHh6YS5lZHUuY24=
 Ruijin Zhu
 Yali Dong2