- 1School of Energy Science and Engineering, Harbin Institute of Technology, Harbin, China
- 2Scientific Satellite Department, Innovation Academy for Microsatellites, Chines Academy of Sciences, Shanghai, China
Obtaining high precision temperature data is crucial in spaceflight applications, considering the growing demand for high precision temperature measurement and the limited onboard resources with a harsh thermal environment in the spacecraft. How to obtain the data, however, becomes an urgent problem. Kalman filtering method is one of the solutions to obtain high precision temperature data with such limited resources. In this paper, the authors demonstrate the principle of temperature measurement system, the application of Kalman filter in temperature measurement including the processing method of sensor self-heating effect, and establishes the state space of measurement error and system error. Through the test, it could be seen that Kalman filtering can improve the temperature measurement resolution to the order of 100 μK while effectively reducing the temperature measurement bias.
Introduction
With the development of space technology and the advancement of on-board electronics, the requirements for large-size, high-precision temperature measurement and control of spacecraft are becoming higher and higher, some of that reaching the mK level or even higher. One of the prerequisites and guarantees for high precision temperature control is the realization of high precision temperature measurement on board, where the temperature measurement accuracy requirements are usually one order of magnitude higher than the required temperature control accuracy.
The main methods of high precision temperature measurement are direct measurement method and modulated current bridge measurement method. Modulated current bridge measurement method adopts AC bridge structure, which is the current high precision resistance measurement method worldwide, measuring the resistance ratio of the bridge arm by inputting modulated sinusoidal signal and demodulated output signal, and then obtaining accurate measurement results by comparing the ratio of measured resistance and reference resistance (Sanjuan, 2009).
Based on the modulated current bridge method, a United States laboratory employ a measurement technique based on alternating current synchronous demodulation, results show that the combination of a low-current noise Junction Field Effect Transistor (JFET) preamplifier together with chip thermistors is optimal for our purpose, yielding a root mean square noise temperature of 2.8 μK (Ryger et al., 2017). The Max-Planck Institute in Germany has achieved short-term ±3.5 μK temperature measurement resolution on the ground using a thermistor as a sensor. The University of California, Berkeley, United States, has used thermistors to obtain long-term 10 μK measurement resolution near the central temperature point of 35°C (Dratler Jr J, 1974). The precision thermistor temperature measurement system on ESA’s LISA Pathfinder core component, the GRS, can achieve a measurement resolution of 10 μK/Hz1/2@1 mHz (Armano et al., 2019). The core payloads of the CNES “Microscope” satellite, FEEU and SU, have an in-orbit variation range of 20 and 15 μK, respectively (Touboul et al., 2017).
The State Key Laboratory of New Optical Communication Systems at Shanghai Jiao Tong University used a spectrometer to achieve a measurement resolution of 3 μK by measuring the small deformation of nematic crystals (NLC) (Li et al., 2018). Huazhong University of Science and Technology and Sun Yat-sen University achieved measurement levels of 1 mK/√Hz@0.01Hz and 100 μK/√Hz@0.5 Hz using a gold film resistive temperature sensor integrated on a MEMS accelerometer (Song et al., 2020). The high-precision platinum resistance temperature measurement system designed by the Institute of Ultra-precision Optoelectronic Instrument Engineering of Harbin Institute of Technology is able to achieve a measurement stability better than 0.005 K/10 days and a resolution better than 5 mK (Hu et al., 2014). Based on the precision platinum resistance sensor, Shanghai Aerospace Electronics Co., Ltd. has completed the implementation of key measurement technologies such as bi-directional constant current source with high carrying capacity, multi-channel technology, precision signal processing and zero power function through the design test of multi-channel precision pyrometer, that could achieve 36-way temperature measurement with 1mK uncertainty (Pan and Hu., 2020).
Modulated current bridge measurements are also widely used commercially, with WIKA’s CTR9000 bridge, which measures resistance to a proportional accuracy of 20 ppb, equivalent platinum resistance to a temperature accuracy of ±5 μK, and a resolution of 1 ppb, equivalent to 0.25 μK. The 6622A bridge from Highlink Canada has a resolution of ±0.001 ppm.
Kalman filtering (KF) algorithm is a method proposed by Rudolf E. Kalman in 1960 to optimally estimate the state quantities of a linear discrete system from the input and output data of the system based on the known statistical properties of the system noise, using the state space equations of the system.
The core problem of the Kalman filter algorithm is that there are certain state quantities inside the system that cannot be obtained directly from observations. There are two methods to obtain the unknown state quantities of the system: 1) by modeling the system and calculating the unknown state quantities of the system based on the system model using the input and output data of the system. This method requires high accuracy of the model, and the unknown perturbation will have an impact on the solution accuracy. 2) Using the mapping relationship between the observed quantity of the system and the state quantity, the state quantity is estimated and solved by the observed quantity of the system. However, the accuracy of the mapping relationship between the observed and state quantities of the system and the system noise will have an impact on the accuracy of the solution of the system state quantities.
In order to meet the objective demand for μK -level temperature resolution in spacecraft, this paper proposes a high-precision temperature measurement and processing method based on the application of Kalman filtering.
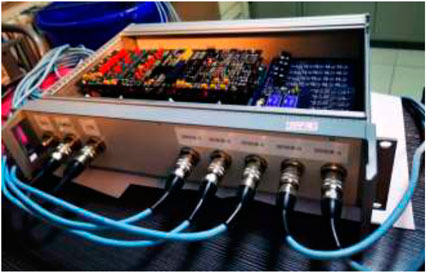
Since the first direct observation of gravitational wave events by LIGO in 2015, space gravitational wave detection technology has received increasing attention, which is included in the Space 2050 plan developed by the Chinese Academy of Sciences. Due to the weak intensity of gravitational waves, the need for ultra-high precision temperature measurement and control is raised for spacecraft when conducting large-scale laser interferometry in space, so a high-precision temperature measurement principled prototype (Figure 1) has been developed under the pull of the key technology of gravitational wave platform.
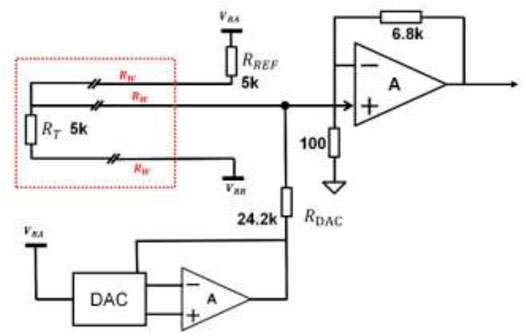
Figure 2 shows the basic structure of the temperature measurement circuit in the principled prototype, in which the DAC is used to generate a sinusoidal excitation signal, and the amplifier is used to form VRA and VRB excitation voltages applied to the temperature measurement thermistor RT and the reference resistor RREF. The REF temperature measurement signal is amplified and then converted into a digital signal by the ADC.
To suppress the effect of low-frequency noise from the DAC and reference voltage on the temperature measurement, the DAC output sine wave signal is also acquired simultaneously to allow the use of algorithms to deduct VRA and VRB the effect of amplitude fluctuations.
where G is the amplification of the amplifier, due to
Despite some optimized design solutions to improve the measurement accuracy of the system in the measurement circuit, such as using variable gain inverting amplifiers to reduce the effect of power supply ripple, using high B-value thermistors to improve temperature sensitivity, and using shielded twisted pair cables to avoid electromagnetic interference, there are still some unavoidable system noises, mainly including.
1) thermal noise due to the self-heating effect of the current passing through the sensor.
2) Circuit noise due to variations in the resistance of the reference resistor caused by the non-ideal environment in which the equipment is located.
3) Quantization errors due to nonlinearity of the ADC, etc.
These noise terms are objectively present in the analog circuit of the measurement system and will exhibit discontinuities in the output digital signal. How to effectively reduce the measurement noise and improve the resolution of temperature measurement is the main problem that needs to be solved.
In this paper, based on the Kalman filtering method, the fusion method of test results and temperature prediction results is used to improve the temperature measurement resolution. This method provides a possibility for future uk-level temperature measurement and control on spacecraft. This will support the engineering key technologies for space gravitational wave detection.
Extraction Method of High Precision Temperature Signal
The discrete temperature data collected by the prototype in fact contains the noise term of the system. In order to reduce the influence of the system noise and obtain more accurate true temperature values, we use Kalman filtering to digitally filter the collected discrete temperature data.
Kalman filtering, as an important part of modern control theory, uses a system state space description in its expression and a recursive form in the algorithm iteration. The linear stochastic differential equation for a temperature discrete control system is:
Assuming that the measured values of the system are:
Of these, F, G,
For Kalman filtering of temperature measurement systems, there are two components, prediction and correction (Eleffendi and Johnson., 2015).
In the prediction section, the process temperature needs to be calculated
where.
In the measurement correction section, it is necessary to calculate the Kalman gain
The measurement variance R reflects the measurement accuracy of the temperature measurement system. Among them, the main system measurement errors for process prediction include the effects of self-heating effects and component coupling effects.
In general, the self-heating effect of precision temperature measurement circuits mainly originates from the temperature sensor, but in highly integrated temperature measurement systems, it is also necessary to consider the total heat generated by heat-generating components near the object under test, such as power supply modules and diodes.
In precision temperature measurement usage scenarios, the self-heating effect of thermistors
For the supply circuits tested experimentally in this paper, the
The noise terms in Eqs 3, 4
In summary, the program flow of the Kalman filter digital processing method for a precision temperature measurement system based on a high precision thermistor is shown in Figure 4.
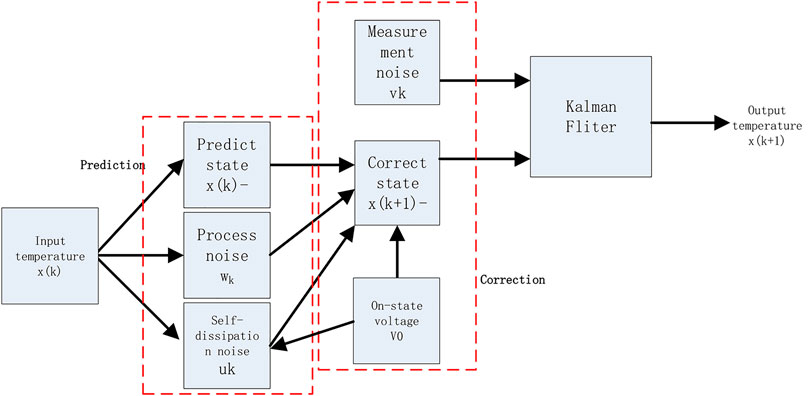
FIGURE 4. Schematic diagram of Kalman filtering method in high precision temperature data processing.
Validation of High Precision Extraction Methods
In order to obtain highly accurate temperature measurement data, a highly stable test environment was established in the laboratory to build the test system as shown in Figure 5.

FIGURE 5. Schematic diagram of the test pilot set-up (the left picture shows the sensor paste schematic, the right picture shows the experimental set-up).
A 400 × 400 × 400 mm hollow aluminum shielding box was designed, which exterior was sealed with polyurethane insulation material to isolate the temperature fluctuation of the test piece from the ambient laboratory temperature. A 200 × 200 × 200 mm solid aluminum alloy cube test piece was installed inside the shielding box. The test piece was cut into two along the height direction, and a 10 mm × 10 mm × 5 mm sensor installation hole was set in the center. As the temperature sensor was installed and the two halves of the core body were closed and fixed with stainless steel screws, a good temperature uniformity and large heat capacity high precision temperature measurement object was constructed. The test piece is installed in the geometric center of the shield box with four M5 support posts made of FRP with low thermal conductivity to further reduce the heat exchange between the shield box and the core.
The temperature sensors used in this test were two MF501 thermistors, one plugged into the test principle prototype as a comparison and the other into a FLUKE 1595A Super Temperature Bridge.
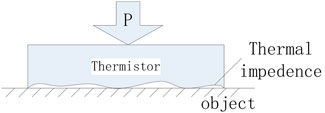
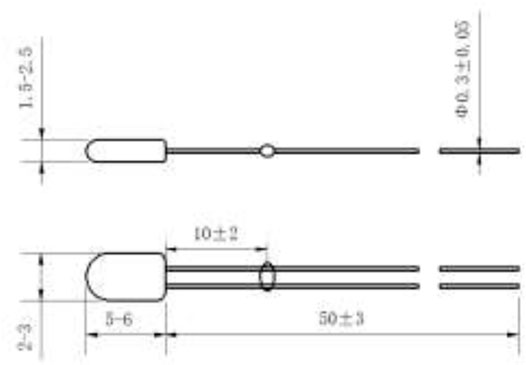
The external dimensions of the MF501 type thermistor are shown in Figure 6. Considering the contact thermal resistance of the thermistor and the core body from air thermal conductivity, air thermal conductivity λ = 0.024W/m∙K, thermistor glass bead size (5–6) × (2–3) mm, and air column thickness σ = 1 mm at the contact part, the measured thermal resistance of the thermistor could be obtained from the following equation.
The temperature deviation due to the self-heating effect of the thermistor could be obtained as follows.
During the test, the thermistor wires were twisted to minimize signal interference, and both data acquisition devices are grounded and use metal shields to avoid mutual electromagnetic interference.
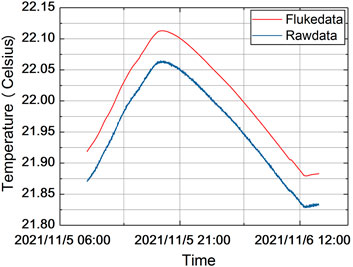
The test results are shown in Figure 7 shown. As can be seen from the graphs, both sets of test data have reached accuracy of a high level, with the Fluke device measuring at the 10 μK level and the test principle prototype measuring at the 1 mK level (the second set of data is panned down by 0.05°C for ease of presentation).
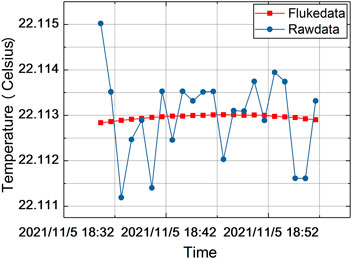
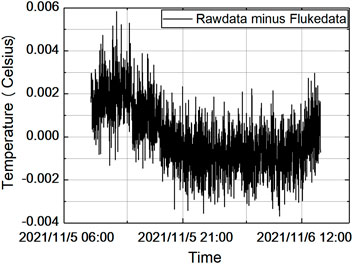
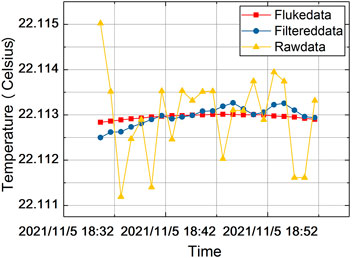
The results obtained by amplifying the data from 18:34 to 19:00 of them are as shown in Figure 8. The Fluke 1595A collected temperature data is with a resolution of 10 μK level, and the test pilot device collected temperature data is with a peak-to-peak value of 5 mK level. In order to make a comparison, the results of Fluke 1595A are used as a benchmark and the differences between the two collected data are made. The results obtained are as shown in Figure 9, and the measurement deviation of −4 mK to +6 mK could be seen.
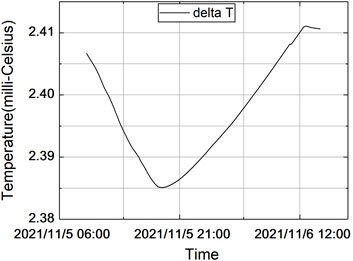
The measurement error due to the self-heating effect of the sensor obtained from Eq. 15 is shown in Figure 10, taking into account both the process noise of the correction term
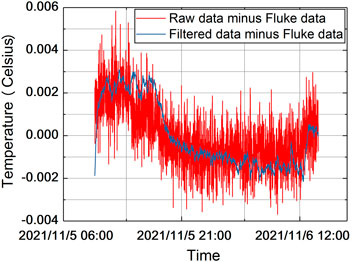
To further quantify the improvement of the filtering on the measurement resolution, the temperature measurements before and after the filtering are used to make a difference with the Fluke measurements, again using the Fluke measurements as a reference, and the results are shown in Figure 12. As could be seen from the graph, the measurement deviation of the filtered data is reduced to −2 mK ∼ +3 mK, which is half of the original data.
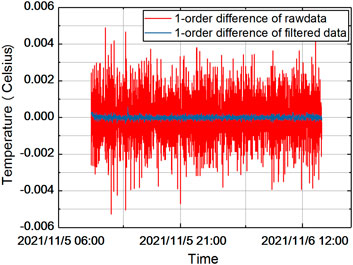
In order to analyze the continuity of the temperature results, the data before and after filtering are subjected to first-order difference processing, and the results obtained are shown in Figure 13, and a statistical analysis is performed as Table 1, the dispersion of the processed data is significantly reduced and the temperature resolution is improved by an order of magnitude.
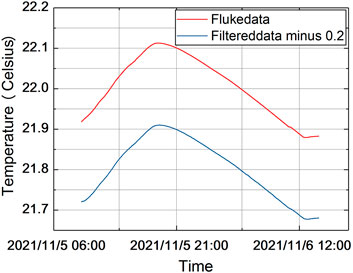
The final filtered data of all the tests are shown in Figure 14. In order to avoid image overlap, the filtered data are shifted downward by 0.2 K along the vertical axis, which demonstrates that the filtering process effectively reduces the irregular fluctuations of the temperature data, and the intuition is that the curve is smoother.
Conclusion
In this paper, a processing method of high-precision temperature measurement data based on the Kalman filter method is proposed for the direction of spacecraft applications represented by gravitational wave measurements. Firstly, a thermal resistance analysis method applied to precision temperature measurement is proposed for the voltage-resistance characteristics of the temperature measurement circuit, combined with the thermal analysis model of the temperature sensor. Then a state-space analytical formula of error sources in the prediction stage and correction stage of Kalman filter is established. Finally, on the basis of this theoretical analysis, a test experimental system is built and the results of the test are processed with high precision. The processed results were compared with the test results of the high-precision temperature measurement instrument, and the results showed that the Kalman filtering method using the high-precision processing of temperature data proposed in this paper could double the temperature measurement accuracy, while the measurement resolution was improved to the 100 μK level.
Data Availability Statement
The original contributions presented in the study are included in the article/Supplementary Material, further inquiries can be directed to the corresponding author.
Author Contributions
XZ is responsible for this manuscript, HL completed the data compilation and analysis, JF established the test system, and HT provided revisions to this paper.
Funding
This research was supported by the Strategic Priority Program on Space Science, the Chinese Academy of Sciences, Grant No. XDA1502070702.
Conflict of Interest
The authors declare that the research was conducted in the absence of any commercial or financial relationships that could be construed as a potential conflict of interest.
Publisher’s Note
All claims expressed in this article are solely those of the authors and do not necessarily represent those of their affiliated organizations, or those of the publisher, the editors and the reviewers. Any product that may be evaluated in this article, or claim that may be made by its manufacturer, is not guaranteed or endorsed by the publisher.
Acknowledgments
The authors are very glad to thank the Scientific satellites thermal design team at Innovation Academy for Microsatellites of the CAS for all their advice and support with this high-precision temperature measurement and control work.
Supplementary Material
The Supplementary Material for this article can be found online at: https://www.frontiersin.org/articles/10.3389/fenrg.2022.832346/full#supplementary-material
References
Armano, M., Audley, H., Baird, J., Binetruy, P., Born, M., Bortoluzzi, D., et al. (2019). Temperature Stability in the Sub-milliHertz Band with LISA Pathfinder. Monthly Notices R. Astronomical Soc. 486 (3), 3368–3379. doi:10.1093/mnras/stz1017
Dratler, J. (1974). A Proportional Thermostat with 10 Microdegree Stability. Rev. Scientific Instr. 45 (11), 1435–1444. doi:10.1063/1.1686523
Eleffendi, M. A., and Johnson, C. M. (2015). Application of Kalman Filter to Estimate junction Temperature in IGBT Power Modules[J]. IEEE Trans. Power Electron. 31 (2), 1576–1587.
Galanis, G., and Anadranistakis, M. (2010). A One-Dimensional Kalman Filter for the Correction of Near Surface Temperature Forecasts[J]. Meteorol. Appl. 9 (4), 437–441.
Hu, P.-C., Shi, W.-Z., and Mei, J.-T. (2014). High Precision Pt-Resistance Temperature Measurement System. Opt. Precision Eng. 22 (4), 988–995. doi:10.3788/ope.20142204.0988
Li, H., Huang, J.-Z., Yu, Y., Li, Y., Fang, C., and Zeng, G. (2018). High-precision Temperature Measurement Based on Weak Measurement Using Nematic Liquid Crystals. Appl. Phys. Lett. 112 (23), 231901. doi:10.1063/1.5027117
Pan, H. F., and Hu, X. M. (2020). Design and Implementation of Multi-Channel 1mK Precision Thermometer[J]. Process Automation Instrumentation 41 (1), 69–76.
Ryger, I., Harber, D., Stephens, M., White, M., Tomlin, N., Spidell, M., et al. (2017). Noise Characteristics of Thermistors: Measurement Methods and Results of Selected Devices. Rev. Scientific Instr. 88 (2), 024707. doi:10.1063/1.4976029
Sanjuan, J. (2009). Development and Validation of the thermal Diagnostics Instrumentation in LISA Pathfinder[D]. Spain: Universitat Politècnica de Catalunya.
Song, X., Liu, H., Fang, Y., Zhao, C., Qu, Z., Wang, Q., et al. (2020). An Integrated Gold-Film Temperature Sensor for In Situ Temperature Measurement of a High-Precision MEMS Accelerometer. Sensors 20 (13), 3652. doi:10.3390/s20133652
Keywords: high precision temperature measurement, Kalman filter, thermal impedance, noise analysis, gravitational waves
Citation: Zhang X, Liang H, Feng J and Tan H (2022) Kalman Filter Based High Precision Temperature Data Processing Method. Front. Energy Res. 10:832346. doi: 10.3389/fenrg.2022.832346
Received: 09 December 2021; Accepted: 08 March 2022;
Published: 08 April 2022.
Edited by:
Kai Chen, South China University of Technology, ChinaReviewed by:
Mengwei Sun, University of Edinburgh, United KingdomAntonio Cammi, Politecnico di Milano, Italy
Copyright © 2022 Zhang, Liang, Feng and Tan. This is an open-access article distributed under the terms of the Creative Commons Attribution License (CC BY). The use, distribution or reproduction in other forums is permitted, provided the original author(s) and the copyright owner(s) are credited and that the original publication in this journal is cited, in accordance with accepted academic practice. No use, distribution or reproduction is permitted which does not comply with these terms.
*Correspondence: Xiaofeng Zhang, emhhbmd4ZkBtaWNyb3NhdGUuY29t
†These authors have contributed equally to this work
 Xiaofeng Zhang
 Hong Liang
 Jianchao Feng2