 Yuchao Yan
 Ruomiao Yang
 Xiaoxia Sun2
 Zhentao Liu
95% of researchers rate our articles as excellent or good
Learn more about the work of our research integrity team to safeguard the quality of each article we publish.
Find out more
ORIGINAL RESEARCH article
Front. Energy Res. , 23 February 2022
Sec. Advanced Clean Fuel Technologies
Volume 10 - 2022 | https://doi.org/10.3389/fenrg.2022.828167
This article is part of the Research Topic Advanced Combustion Technologies for Low Carbon Emissions View all 10 articles
Gasoline direct injection (GDI) engine are widely adopted in the automobile industry since its advantage in the fuel economy. Injection Timing (IT) is an important parameter for the GDI engine, having a great impact on the spray atomization, mixture evenness, combustion characteristics, and therefore performance of the GDI engine. With the motive of IT optimization, a three-dimensional CFD model of a single cylinder 4-stroke spark ignition GDI engine with bore of 84 mm and compression ratio of 10.3 was utilized to analyze the detailed process at different IT (270, 280, 290, 300-degree CA BTDC), while the other conditions were invariant like rotate speed at 2000 RPM. The spray, turbulence, G-equation combustion were included. The result indicated that delayed IT tended to reduce drop-wall impingement significantly but still intensified unevenness of mixture concertation severely, resulting in fuel-rich region appeared around cylinder. Because the duration available for mixing was shortened, which dominantly intensified the unevenness of the mixture. The combustion was deteriorated as the IT delayed because the excessive equivalence ratio region severely slowed flame propagation and frozen at the most uneven region, which finally degraded thermal efficiency and engine performance. In conclusion, this paper demonstrated the whole process from injection to combustion, revealing that droplet-wall impingement and available duration for mixing are dominant trade-off factors for mixture formation and following combustion process, as the IT changes.
As acknowledged the Paris Agreement sets out arrangements for global action to address climate change after 2020 (Liobikienė and Butkus, 2017). Its long-term goal is to limit the increase in global average temperature to less than 2 degrees Celsius compared to the pre-industrial period and to work towards limiting temperature increases to less than 1.5 degrees Celsius (Huang et al., 2021). The transportation sector accounts for a large share of the problem of greenhouse emissions (Fridstrøm, 2017; Liu et al., 2022). While the trend towards switching to electric vehicles is clear, internal combustion engines will continue to play an important and irreplaceable role in the transportation industry in the next decades (Gasbarro et al., 2019; Stocchi et al., 2019). However, it also brings about the energy crisis and environmental problems caused by millions of vehicles powered with internal combustion engines (Ambrogi et al., 2019; Liu and Wang, 2022). Moreover, the government proposed a series of requirements and standards (China Phase VI) to restrict emissions for improving energy efficiency and beautifying the environment (Liu et al., 2018a; Liu and Liu, 2021a). The rules are much more stringent than the previous ones and are moving towards higher standards in the foreseeable future (Fennell et al., 2014; Potenza et al., 2019). Strict regulations for exhaust gas emissions and the need to improve fuel efficiency have promoted the development of GDI technology due to its high horsepower output and better fuel economy (Storey et al., 2014; Zhang et al., 2020). Therefore, a lot of researchers have investigated various related technologies to improve GDI engine performance and reduce emissions (Zhang et al., 2017; Feng et al., 2021). It is generally accepted that injection strategies have a great impact on the formation of homogeneous gas mixture and in-cylinder combustion processes (Splitter et al., 2017; Zhu et al., 2018). Various injection methods are investigated to improve GDI performance. Kim et al. (2018) investigated the effects of fuel injection timings on combustion and emission characteristics of a direct-injection spark-ignition gasoline engine with a 50 MPa fuel injection system. The results indicated that when the injection pressure is up to 50 MPa and the injection timing is late, the thermal efficiency can be improved without reducing exhaust gas emissions. Zhuang et al. (2019) studied the effect of ethanol direct injection plus gasoline port injection (EDI + GPI) on engine performance. To further understand the experimental results, CFD simulations were performed. And the results can be a reference for understanding the combustion process based on EDI + GDI. Zhang et al. (2018) investigated the effects of control parameters (spark advance, injection pressure, excess air ratio, and EGR) on the combustion, performance and emissions of a GDI engine. The results indicated that the most important factor affecting NOx emissions and BSFC is the EGR mode. Injection timing has the highest level of contribution to PN emissions, especially in lean combustion conditions. Miganakallu et al. (2020) studied the impact of water-methanol injection on the GDI engines. Different performance indicators were used to evaluate the engine efficiency with water-methanol blends, pure water or pure methanol. Marseglia et al. (2017) investigated an optically accessible multi-cylinder engine performance under single and double injections based on synergic experimental and numerical analysis. Wen et al. (2020) researched the effects of gasoline octane number on fuel consumption and emissions in two vehicles equipped with GDI and PFI spark-ignition engine. The results indicated that the early split injection strategy reduced the CO mass fraction and so on (Liu et al., 2019). Many studies have investigated the influence of injection parameters on in-cylinder evaluation indicators of mixture formation and combustion (Duronio et al., 2020a; Duronio et al., 2020b). The relevant researches focused more on the macro parameters of the in-cylinder combustion process (Cavicchi et al., 2019; Gong et al., 2021). Moreover, the literature of interaction of influence factors are limited. It’s hard to point out the dominant factor in effect of IT, while there exists several trade-off factors like level of droplet-wall impingement, duration for mixing, flow motion intensity as well as temperature, and pressure. Therefore, this research attempted to reveal the dominant factor of IT effect so that it can serve as a reference of IT selection. An already calibrated three-dimensional model was used to investigate the effects of injection timings on in-cylinder mixture formation and combustion processes. The goal of this study was to find out why the internal phenomenon of in-cylinder combustion occurs and propose suggestions for improving the in-cylinder combustion environment. Admittedly, the effect of injection timing on engine performance and emission can be imagined according the engine combustion laws. However, existing literature lacks the documented information about its effects in details. Moreover, the optically accessible engines have limited visualizations of the activities took place inside the chamber due to the difficulties or high costs in design. The 3D CFD simulation results present in this study can help readers to better visualize in-cylinder activities occurred inside the chamber from all directions rather than solely based on imaginations. It is also important to note that researchers may only guess one or two effects that are reasonable when changing the injection timing. But it is essential to show the combined effects caused by the variation of injection timings. Accordingly, the investigation of IT effects on engine combustion is request if wishing to provide a more direct understanding of the interaction between fuel spray, kernel inception and flame propagation, especially for their co-optimizations with the chamber shape. It is also important to note that their interactions and the IT effects would change with engine types and conditions. Consequently, the results of the study can serve as a reference for selecting a proper injection timing of the cylinder to improve combustion performance.
The model used in this study is a four-stroke spray-guided gasoline direct injection (GDI) engine. Since the 3D CFD model was already calibrated against the experimental data (Yan, 2021), with the detailed information shown in reference (Yan, 2021), only the most important information will be shown here. The compression ratio was 14.3 and three nozzles with a diameter of 300 microns were specified since this was a half-symmetry model. The injection timings were selected from 270 to 300 CAD (degree Crank Angle) BTDC (before top dead center) compression with an increment of 10 CAD at a fixed engine speed = 2000 r/min. The simulation was performed by commercial software ANSYS FORTE, a 3D CFD simulation software specialized for internal combustion engine. The three-dimensional CFD grid model is shown in Figure 1, consisting of 360,557 cells. The size of mesh was controlled within 1∼2 mm, which was the recommended mesh size to precisely capture combustion characteristics according to reference (O'Rourke and Amsden, 1987). The engine specifications are shown in Table 1 and the detailed information can be found in literature (Yan, 2021). In addition, all simulation tests were performed at a fixed spark ignition advance angle = 15 CAD BTDC compression. More detailed simulation parameters are shown in Table 2.
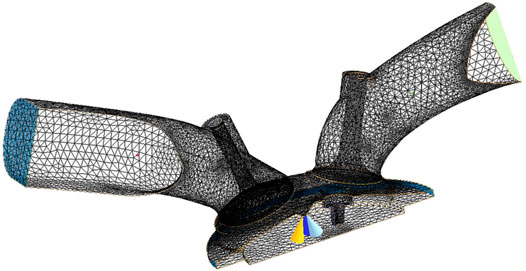
FIGURE 1. Three-dimensional grid of the GDI engine at top dead center.
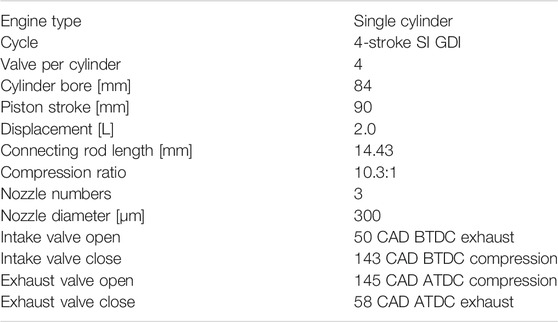
TABLE 1. Engine specifications.
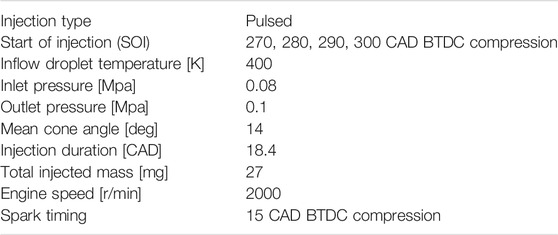
TABLE 2. Simulated operating conditions at various injection timings.
The turbulence model used in this study was the RNG k-ε model (Han and Reitz, 1995; Liu and Dumitrescu, 2019a). The basic governing equations include species conservation equation, fluid continuity equation, momentum conservation equation and energy conservation equation, and gas-phase mixture equation of state (Verma et al., 2016a; Verma et al., 2016b). The G-equation model together with the discrete particle ignition kernel (DPIK) flame model characterized the turbulent flame inception and propagation (Liu et al., 2018b; Liu and Dumitrescu, 2019b). The G-equation model was employed to track the propagation of fully developed, premixed, or partially premixed turbulent flames (Peters, 2000; Liu and Dumitrescu, 2019c). When the flame was initiated by the spark, the ignition-kernel flame had a structure that was typically smaller than the average grid size in the computational mesh (Tan and Reitz, 2006; Liu and Dumitrescu, 2019d). The spray models simulated sub-processes including nozzle flow, spray atomization, droplet breakup, droplet collision and coalescence, droplet vaporization, and wall impingement (Fan et al., 1999; Liu and Liu, 2021b). The nozzle flow model was solid-cone and the droplet Collision and Coalescence Model is the O’Rourke model (O'Rourke and Amsden, 1987). More detailed model settings are shown in Table 3. In addition, the chemistry mechanism for gasoline that consisted of 59 species and 437 reactions (ANSYS Forte). The main reactions include pyrolysis and oxidation, example of which are as following showed.
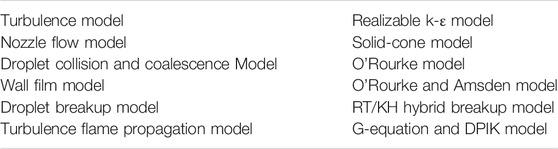
TABLE 3. Computational models.
Figure 2 shows the highly coincident pressure and apparent heat release rate (HRR) of experimental and simulation data, of in-cylinder combustion simulation, because the pressure and HRR are determined by combustion phase.
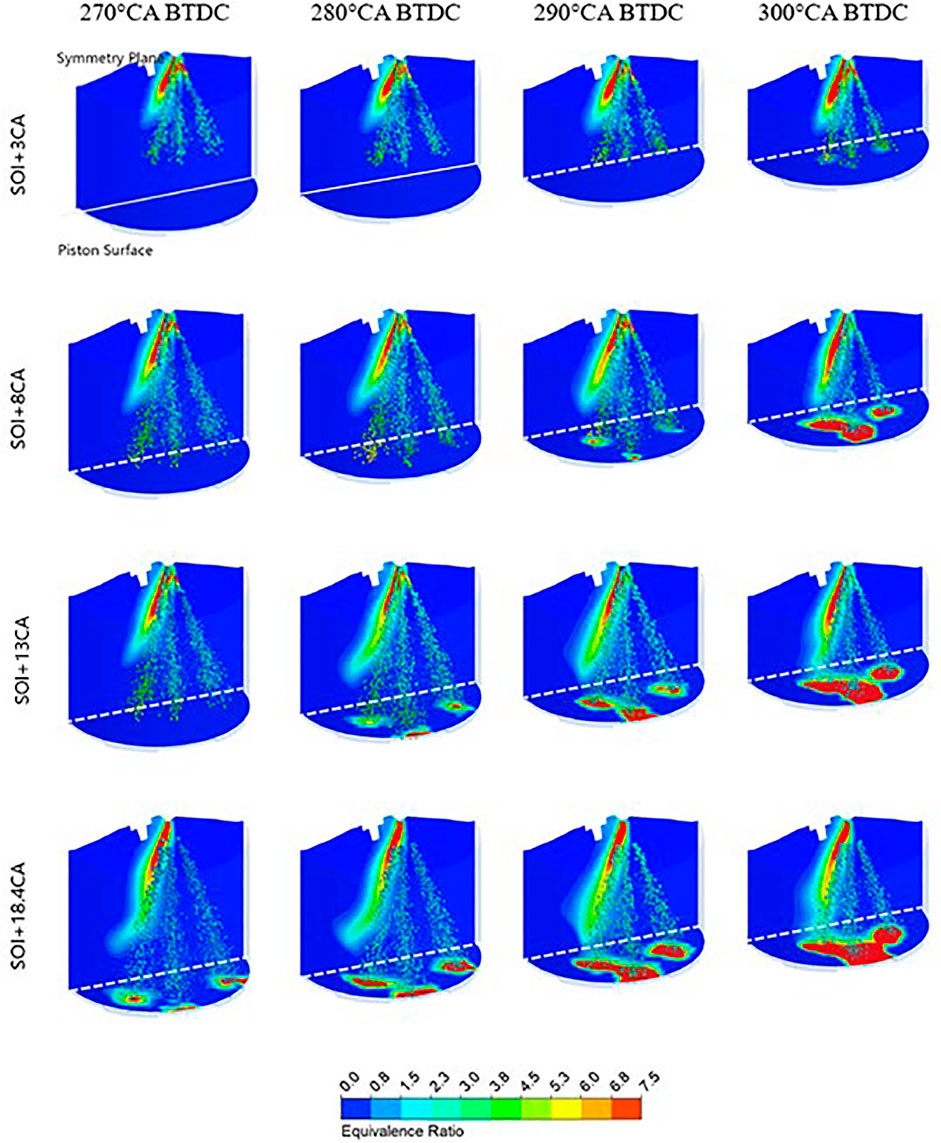
FIGURE 2. In-cylinder mixture formation during the injection process at different injection timings.
In this section, the in-cylinder mixture equivalence ratio and velocity vector image are presented to analyze the effects of IT on the mixture formation process. Some results are selected to show at several CAD of interest. It is also important to mention that the CFD results shown in this section are displayed on the vertical cut-plane combined with the upper surface of the piston, superimposed by the 3D profiles of spray development.
The variation of the injection droplets and in-cylinder equivalence ratio during the injection process is shown in Figure 2. As expected, advanced IT corresponded to upper piston position and therefore shorter distance between injector and piston surface during injection, resulting in considerable difference levels of droplet-wall impingement shown in Figure 2, which is essential to spray atomization and soot emission. Together with Figure 3, which indicates the injection penetration distance was extended by 4.5, 13.6, 13.7%, respectively, as the IT delayed, it can be inferred that the droplet-wall impingement was much intensified at IT of 300, 290 CA BTDC and slight at IT of 270, 280 CA BTDC.
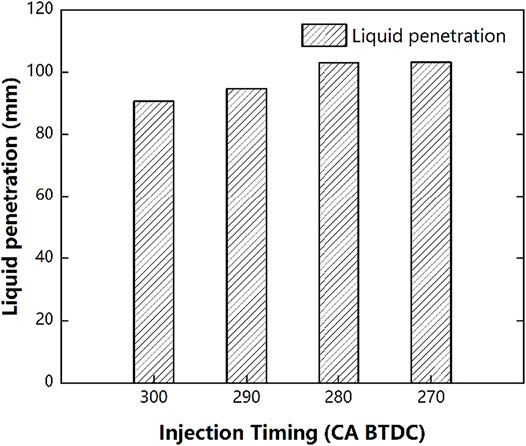
FIGURE 3. The effect of IT on the maximum droplet penetration distance.
The droplet velocity and Sauter mean diameter (SMD) which is defined as the ratio of total volume to the total surface area of droplet, as commonly used indicators of spray atomization (Liu et al., 2021), are shown in Figure 4. During the intake stroke, the droplet velocity initialized with approximately 77 m/s at IT, then decreased to nearly zero due to air friction. By the way, the slope difference was because of the continuous droplet with initial velocity during injection of 18.4-degree CA. The droplet velocity of different IT was similar except for CA offset during the intake stroke, because it was mainly determined by injection pressure which was kept same. It is also of interest to note that the droplet velocity was slightly raised at the beginning of compression stroke, which was probably due to the flow motion driven by the upward piston. The velocity difference during compression stroke echoed the diversity of the remaining droplet and evenness of mixture at various IT.
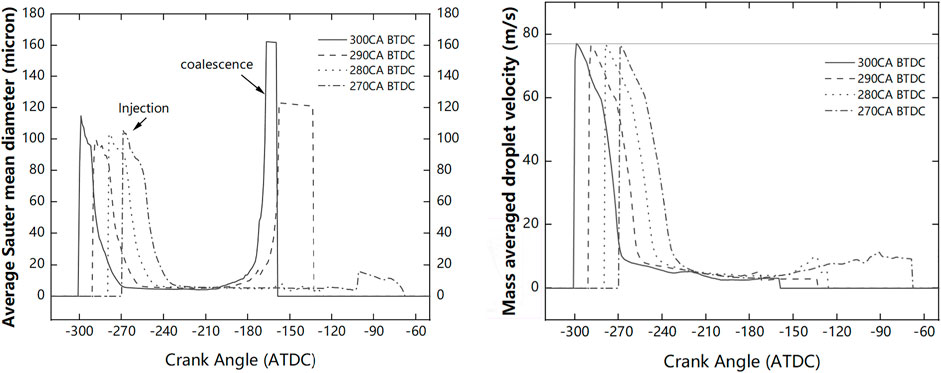
FIGURE 4. The effect of IT on the mass averaged droplet velocity and the SMD.
The SMD is influenced by the interaction of multifactor like nozzle diameter, injection pressure as well as backpressure (Biswal et al., 2019). As shown in Figure 4, the SMD of different IT decreased as the droplet breakup. Despite CA offset and slight difference during the breakup process, the SMD dropped to a similar value at the end of the intake stroke. What’s outstanding in Figure 4 is the rapid increment of SMD at IT of 300, 290 CA BTDC. This was mainly because of the severe droplet-wall impingement, contributing to droplet coalescence and therefore large SMD.
In conclusion, advanced IT tended to intensify droplet-wall impingement, but the level of spray atomization at the end of intake stroke was similar.
As shown in Figure 5, the equivalence ratio of the in-cylinder mixture at several CA during the compression stroke was utilized to investigate the fuel-gas mixture formation. The courter of symmetry plane and piston surface are colored by equivalence ratio. At the beginning of the compression stroke, the fuel was gathered around the piston surface near the cylinder, which was mainly due to the interaction of different levels of droplet-wall impingement as well as the duration of spray atomization. According to equivalence ratio distribution at 220 CA BTDC shown in Figure 5, it can be inferred that despite intensified droplet-wall impingement at advanced IT, the duration of spray atomization outperformed and affected spray atomization dominantly, resulting in more even distribution of mixture concentration around piston surface.

FIGURE 5. Effect of injection timing on the in-cylinder mixture formation during compression.
As the piston moved toward TDC, the fuel was carried counterclockwise and mixed more evenly but delayed IT corresponded different evenness at TDC.
The mixture equivalence ratio distribution at spark timing (ST), as Figure 6 shows, had a crucial influence on flame propagation and therefore comprehensive performance of the GDI engine. The mixture of stoichiometric ratio was the ideal condition for ignition and combustion efficiency. Figure 6 indicated the obvious different evenness of the mixture, suggesting that the fuel and gas had fully mixed evenly at IT of 300 CA BTDC, but with the IT retarding, the evenness of the mixture degraded. At delayed IT, especially at IT of 270, 280 CA BTDC, the fuel was gathered around intake port side of cylinder seriously, resulting in slower flame propagation and therefore contributing to the level of incomplete combustion that will be analyzed next.
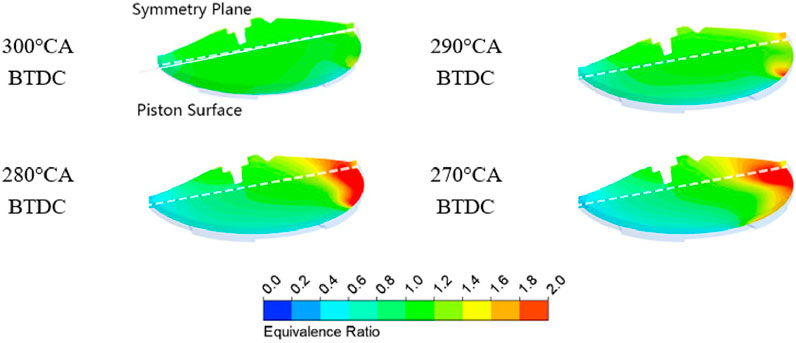
FIGURE 6. In-cylinder mixture formation at the spark timing with different injection timings.
The mixture formation process is influenced by the interaction of intake flow, piston movement as well as combustion chamber shape. To investigate the in-cylinder flow motion during the mixture formation process, the turbulent kinetic energy, indicating the intensity of the in-cylinder flow motion, is shown in Figure 7. The first peak outstanding the curve echoed the intake flow, and the second one between 300 and 270 CA BTDC was probably due to the injection which slightly enhanced in-cylinder flow motion. Then the turbulent kinetic energy was decreased slowly as the turbulence dissipation, until the spark timing when the combustion produced some kinetic energy of flow motion and thus arose a slight peak. Concerning the effect of IT, the turbulent kinetic energy of different IT was highly coincident, suggesting similar flow motion despite different IT.
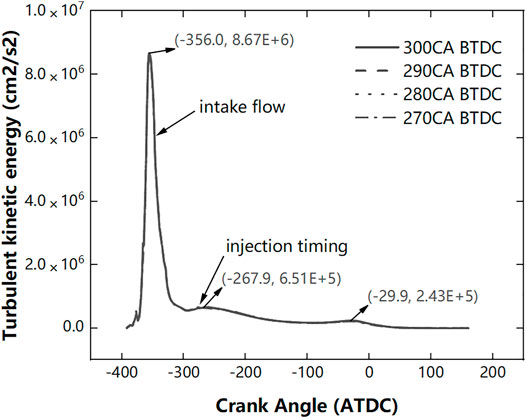
FIGURE 7. Turbulent kinetic energy at different IT.
To further investigate the flow motion during mixture formation, Figure 8 shows the velocity field during compression stroke at different IT, corresponding with the equivalence ratio distribution mentioned in Figure 5. As shown in Figure 8, at the start of the compression stroke the flow from the intake valve to piston surface was predominant in in-cylinder flow motion because of intake flow inertia. As the piston moved upward, the flow around the piston was carried upward and interacted with intake flow inertia, contributing to a counterclockwise tumble flow formation, which could intensify the fuel-gas mixture significantly. Thus, the gathered fuel around the piston surface was carried along with tumble flow and further mixed evenly, echoing fuel movement displayed in Figure 5.
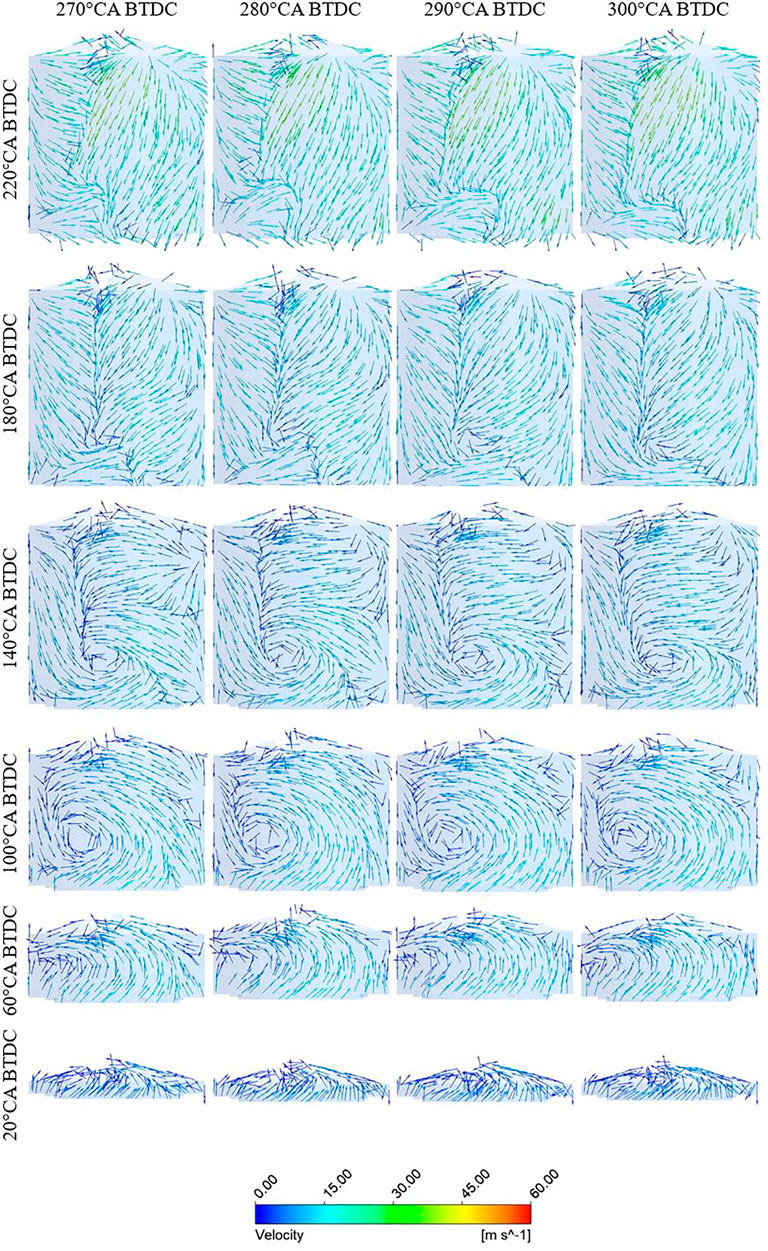
FIGURE 8. In-cylinder velocity vector before spark timing at different injection timings.
As can be seen in Figure 8 the in-cylinder flow motion was highly similar regardless of delayed IT. Figure 9 shows the tumble ratio of in-cylinder flow to assess the tumble flow intensity at different IT. The intake flow generated a fierce tumble with some vibration, until the start of injection when injected droplets brought a certain degree of disturbance. During the beginning of compression stroke, the tumble flow continually intensified thanks to the piston movement. Then the tumble ratio achieved maximal value at approximately -66 CA ATDC. After that it was a quicker decrement because the compressed volume of the combustion chamber dominated the flow motion, making the tumble flow degraded and enlarged dissipation of kinetic energy, which could be inferred from Figure 8. Besides, it was essential to note that the disturbance of injection at different IT was expanded obviously and directly affected mixture formation. The peak values of the tumble ratio were decreased by 8.3, 14.9, 24.9%, respectively, as the IT delayed. As the IT was delayed, the tumble ratio decreased.
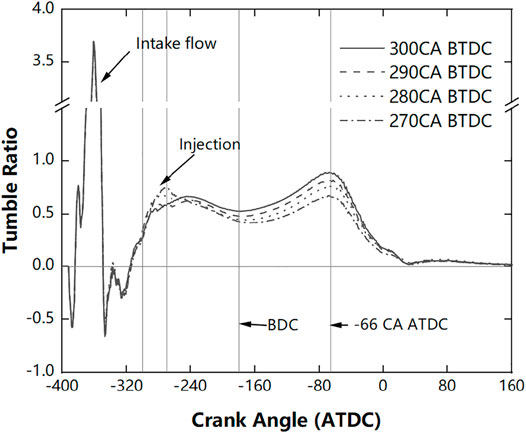
FIGURE 9. Tumble ratio of in-cylinder flow at different IT.
Considering the analysis above comprehensively, it can be concluded that delayed IT significantly degrades the evenness of the mixture. Although delayed IT contributed to the reduction of droplet-wall impingement and slightly enhancing spray atomization, the less available time for mixture formation as well as the tumble flow motion degradation were dominant factors for deterioration of the mixture evenness.
To assess the combustion process with different injection timing, the flame front colored by turbulent flame speed was displayed of several interested CA in Figure 10. The flame front in the numerical simulation is defined as the position of G = 0 in the G-equation turbulent combustion model. In the earlier combustion process before the flame front reached the cylinder, as can be seen in Figure 10, the flame front started from the spark plug and had similar shapes of different IT.
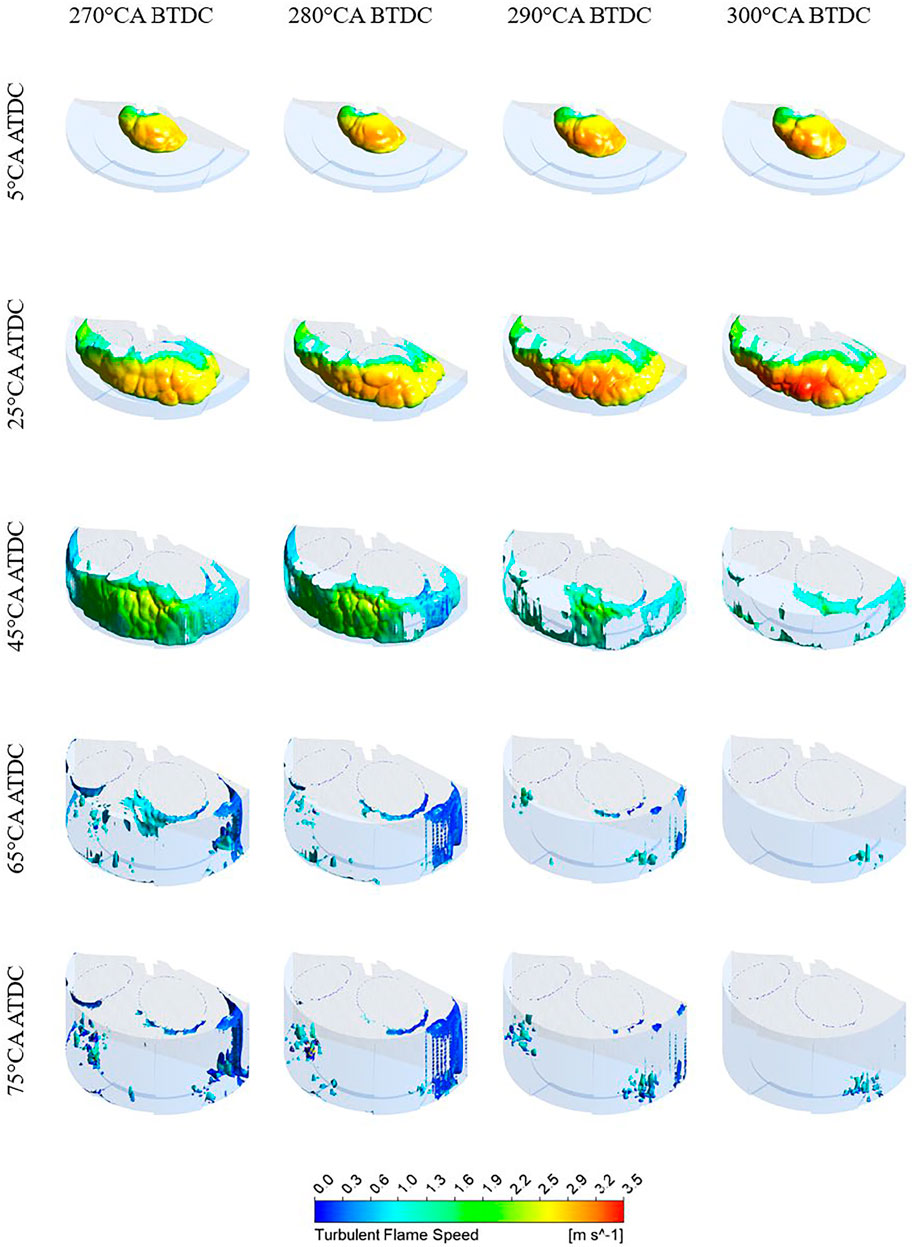
FIGURE 10. Effect of injection timing on the distribution of turbulent flame speed at the flame front (i.e., G = 0) at several CAD of interest after SOC.
The corrugation of the flame front indicated turbulent flame propagation, which could intensify combustion. As can be seen in Figures 10, 11A that an advanced IT tended to enhance turbulent and laminar flame speed. It was worth noting that the flame front propagation speed and front shape at the start of combustion were similar because the equivalence ratio around the spark plug was analogous, according to the corresponding image in Figure 5. The flame propagation speed of delayed IT was slowed when the flame front reached the fuel-rich region, resulting in the difference of laminar and turbulent flame speed between 0∼40 CA ATDC in Figure 11A.
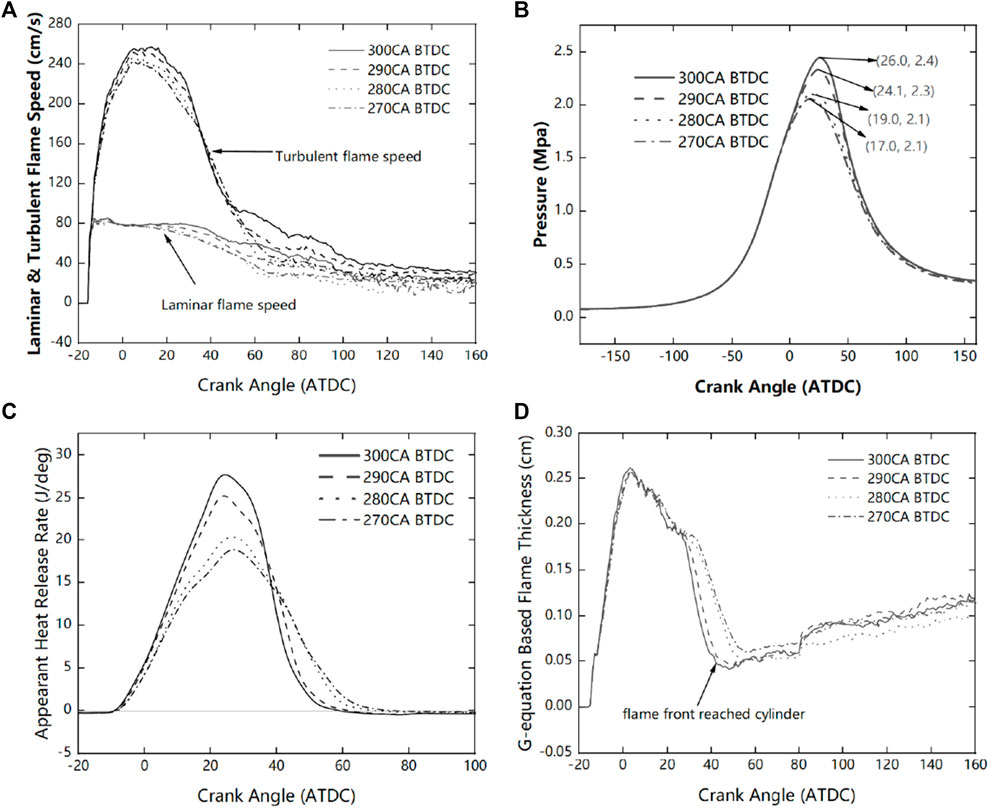
FIGURE 11. (A)Effect of injection timing on laminar and turbulent flame speed. (B) In-cylinder average pressure at different IT. (C) Apparent heat release rate at different IT. (D) G-equation based flame thickness at different IT.
The in-cylinder pressure is shown in Figure 11B. The pressure was raised at compression stroke and suddenly increased at spark time when combustion started. The pressure at different IT was coincident before spark timing and separated after ignition due to different combustion performance. The peak combustion pressure and its location (location of peak pressure, LPP) are important indicators of combustion characteristics. Figure 11B suggests that LPP at IT of 300 CA BTDC was 26 ATDC. As the IT delayed the LPP advanced by 1.9, 7.0, 9.0 degrees CA, respectively, and peak pressure decreased by 4.2, 12.5, 14.6%, respectively, suggesting a deteriorated combustion efficiency as well as thermal efficiency due to the lower level of constant volume combustion.
The flame propagation and combustion characteristics were also reflected in the apparent heat release rate shown in Figure 11C. The duration of combustion (DOC) was defined as the duration from SOC and EOC (End of combustion) when the apparent heat release rate decreased to zero, indicating the combustion speed and affecting thermal efficiency. As the IT delayed from 300 CA BTDC to 270 CA BTDC, the DOC was extended by 4.1, 15.1, 21.9%, respectively, suggesting slower flame speed and degraded combustion efficiency, which is shown in Figure 12. The lower and retarded peak heat release rate also indicated the combustion performance deteriorated.
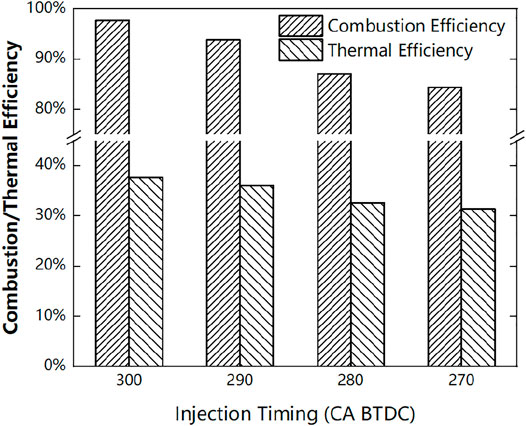
FIGURE 12. Combustion efficiency and Thermal efficient at different IT.
The flame thickness indicates the region of combustion reacted, as shown in Figure 11D. As expected the flame thickness raised immediately after ignition as the flame kernel grew fast. Then the flame kept a relatively larger thickness corresponding to the flame propagation process before the following sudden decrement, which echoed the flame propagated to the cylinder. It’s of interest that flame thickness of different IT was coincident before the sudden drop, indicating the combustion in the stoichiometric ratio region displayed in Figure 6 was similar. The flame thickness separated at a sudden drop at approximately 40 CA ATDC because of various levels of incomplete combustion. As Figure 10 shows, the majority of the flame front of IT of 290, 300 CA BTDC was terminated at the cylinder at 45 CA ATDC, echoing the earlier sharp decrement, followed by the IT of 270, 280 CA BTDC that propagated slower. The gentle growth of flame thickness after approximately 50 CA BTDC was probably due to slowly combustion of the excessive equivalence ratio region, which had a thicker but deteriorated reaction zone.
The excessive equivalence ratio, indicating lack of oxygen, tended to slower the flame propagation speed and even not on fire. That explained the decrease of flame speed with IT delaying as Figure 10 showed, because the unevenness of mixture was intensified and thus excessive fuel-rich region existed around the intake side of the combustion chamber.
Furthermore, it’s important to point out that some extremely excessive fuel regions didn’t on fire as the IT delayed. The excessive equivalence ratio, indicating lack of oxygen, tended to slower the flame propagation speed, and even not on fire. That explained the decrease of flame speed with IT delaying as Figure 10 showed, because the unevenness of mixture was intensified and thus excessive fuel-rich region existed around the intake side of the combustion chamber, as mentioned in Figure 6. The flame front propagation speed was vastly decreased when reaching the excessive fuel-rich region and even terminated in extreme equivalence ratio region at IT of 270, 280 CA BTDC, as shown in Figure 10. The fuel-rich region that remained unburnt reduced the chemical energy released and therefore decreased the combustion and thermal efficiency. Besides, the unburnt region sharply raised the unburnt hydrocarbon (UHC) by 3.2, 109, 122 times as IT delayed as shown in Figure 12.
The flame speed and combustion characteristics analyzed above dominantly determined the combustion efficiency and therefore thermal efficiency, as Figure 12 showed. With IT delaying from 300 to 270 CA BTDC, the combustion efficiency decreased by 3.9, 10.8, 13.6% and thermal efficiency by 4.1, 13.3, 16.5%, respectively. It suggested an optimized IT of 300 CA BTDC in this research with combustion and thermal efficiency of 97.7 and 37.6%, respectively.
This research investigated the effects of different IT (270, 280, 290, 300-degree CA BTDC) on mixture formation and combustion characteristics in a GDI engine. A three-dimensional CFD model concluding spray, turbulence, G-equation combustion models were utilized to analyze the detailed process of spray atomization, mixture formation and flame propagation comprehensively at different IT. The results are summarized as follows:
1) Delayed IT tended to reduce drop-wall impingement significantly but had a slight impact on droplet breakup and spray atomization.
2) Delayed IT intensified unevenness of mixture concertation, contributing to fuel-rich region extended at the intake port side of cylinder. The fuel-gas mixing process was dominantly driven by the tumble flow motion. Albeit delayed IT generated less droplet-wall impingement, the shorter duration of the mixing process and degraded tumble flow motion enlarged the unevenness of mixture at spark timing.
3) The combustion was deteriorated as the IT delayed because the excessive equivalence ratio region severely slowed flame propagation and terminated at the most uneven region.
In conclusion, this paper demonstrated the whole process from injection to combustion, revealing that level of droplet-wall impingement and available duration for the mixing process is a pair of trade-off factors for mixture formation and following combustion process, as the IT changes. In this research, the positive effect of mixing duration defeated the negative influences of droplet-wall impingement as the IT advanced. But considering the more advanced IT, it’s recommended to assess the interaction of these factors since the dominant influence factor is uncertain with too earlier IT. Thus, this research has a positive effect to guide the IT optimization for various models of the GDI engine.
The raw data supporting the conclusion of this article will be made available by the authors, without undue reservation.
YY: Conceptualization, methodology, simulation, and writing—draft preparation. RY: Validation, writing—draft preparation, writing—review and editing. XS: Analysis, supervision, Validation. LR: writing review and editing. ZL: Analysis, supervision. All authors have read and agreed to the published version of the manuscript.
The authors declare that the research was conducted in the absence of any commercial or financial relationships that could be construed as a potential conflict of interest.
All claims expressed in this article are solely those of the authors and do not necessarily represent those of their affiliated organizations, or those of the publisher, the editors and the reviewers. Any product that may be evaluated in this article, or claim that may be made by its manufacturer, is not guaranteed or endorsed by the publisher.
3D, three-dimensional; ATDC, after top dead center; BTDC, before top dead center; CAD, crank angle degree; CFD, computational fluid dynamics; CHRR, chemical heat release rate; GDI, gasoline direct injection; GPI, gasoline port injection; ICE, internal combustion engine; IT, injection timing.
Ambrogi, L., Liu, J., Battistoni, M., Dumitrescu, C., and Gasbarro, L. (2019). CFD Investigation of the Effects of Gas’ Methane Number on the Performance of a Heavy-Duty Natural-Gas Spark-Ignition Engine. SAE International,Technical Paper 2019-24-0008. doi:10.4271/2019-24-0008
Biswal, A., Kale, R., Balusamy, S., Banerjee, R., and Kolhe, P. (2019). Lemon Peel Oil as an Alternative Fuel for GDI Engines: A spray Characterization Perspective. Renew. Energ. 142, 249–263. doi:10.1016/j.renene.2019.04.087
Cavicchi, A., Postrioti, L., and Scarponi, E. (2019). Hydraulic Analysis of a GDI Injector Operation with Close Multi-Injection Strategies. Fuel 235, 1114–1122. doi:10.1016/j.fuel.2018.08.089
Duronio, F., De Vita, A., Allocca, L., and Anatone, M. (2020). Gasoline Direct Injection Engines - A Review of Latest Technologies and Trends. Part 1: Spray Breakup Process. Fuel 265, 116948. doi:10.1016/j.fuel.2019.116948
Duronio, F., De Vita, A., Montanaro, A., and Villante, C. (2020). Gasoline Direct Injection Engines - A Review of Latest Technologies and Trends. Part 2. Fuel 265, 116947. doi:10.1016/j.fuel.2019.116947
Fan, L., Li, G., Han, Z., and Reitz, R. D. (1999). Modeling Fuel Preparation and Stratified Combustion in a Gasoline Direct Injection Engine. SAE International, Technical paper 1999-01-0175. doi:10.4271/1999-01-0175
Feng, L., Sun, X., Pan, X., Yi, W., Cui, Y., Wang, Y., et al. (2021). Gasoline spray Characteristics Using a High Pressure Common Rail Diesel Injection System by the Method of Laser Induced Exciplex Fluorescence. Fuel 302, 121174. doi:10.1016/j.fuel.2021.121174
Fennell, D., Herreros, J., and Tsolakis, A. (2014). Improving Gasoline Direct Injection (GDI) Engine Efficiency and Emissions with Hydrogen from Exhaust Gas Fuel Reforming. Int. J. Hydrogen Energ. 39 (10), 5153–5162. doi:10.1016/j.ijhydene.2014.01.065
Fridstrøm, L. (2017). From Innovation to Penetration: Calculating the Energy Transition Time Lag for Motor Vehicles. Energy Policy 108, 487–502. doi:10.1016/j.enpol.2017.06.026
Gasbarro, L., Liu, J., Dumitrescu, C., Ulishney, C., Battistoni, M., and Ambrogi, L. (2019). Heavy-duty Compression-Ignition Engines Retrofitted to Spark-Ignition Operation Fueled with Natural Gas. SAE International, Technical Paper 2019-24-0030. doi:10.4271/2019-24-0030
Gong, C., Si, X., and Liu, F. (2021). Effects of Injection Timing and CO2 Dilution on Combustion and Emissions Behaviors of a Stoichiometric GDI Engine under Medium Load Conditions. Fuel 303, 121262. doi:10.1016/j.fuel.2021.121262
Han, Z., and Reitz, R. D. (1995). Turbulence Modeling of Internal Combustion Engines Using RNG κ-ε Models. Combustion Sci. Technol. 106 (4-6), 267–295. doi:10.1080/00102209508907782
Huang, Q., Liu, J., Ulishney, C., and Dumitrescu, C. E. (2021). On the Use of Artificial Neural Networks to Model the Performance and Emissions of a Heavy-Duty Natural Gas Spark Ignition Engine. Int. J. Engine Res., 1–20. doi:10.1177/14680874211034409
Kim, T., Song, J., Park, J., and Park, S. (2018). Numerical and Experimental Study on Effects of Fuel Injection Timings on Combustion and Emission Characteristics of a Direct-Injection Spark-Ignition Gasoline Engine with a 50 MPa Fuel Injection System. Appl. Therm. Eng. 144, 890–900. doi:10.1016/j.applthermaleng.2018.09.007
Liobikienė, G., and Butkus, M. (2017). The European Union Possibilities to Achieve Targets of Europe 2020 and Paris Agreement Climate Policy. Renew. Energ. 106, 298–309. doi:10.1016/j.renene.2017.01.036
Liu, H., Mao, B., Liu, J., Zheng, Z., and Yao, M. (2018). Pilot Injection Strategy Management of Gasoline Compression Ignition (GCI) Combustion in a Multi-cylinder Diesel Engine. Fuel 221, 116–127. doi:10.1016/j.fuel.2018.01.073
Liu, H., Wang, X., Zhang, D., Dong, F., Liu, X., Yang, Y., et al. (2019). Investigation on Blending Effects of Gasoline Fuel with N-Butanol, DMF, and Ethanol on the Fuel Consumption and Harmful Emissions in a GDI Vehicle. Energies 12 (10), 1845. doi:10.3390/en12101845
Liu, J., and Dumitrescu, C. E. (2019). Lean-burn Characteristics of a Heavy-Duty Diesel Engine Retrofitted to Natural-Gas Spark Ignition. J. Eng. Gas Turbines Power 141071013 (7). doi:10.1115/1.4042501
Liu, J., Huang, Q., Ulishney, C., and Dumitrescu, C. E. (2022). Comparison of Random forest and Neural Network in Modelling the Performance and Emissions of a Natural Gas Spark Ignition Engine. J. Energ. Resour. Technol. 144 (3), 032310. doi:10.1115/1.4053301
Liu, J., Szybist, J., and Dumitrescu, C. (2018). Choice of Tuning Parameters on 3D IC Engine Simulations Using G-Equation. SAE International, Technical Paper 2018-01-0183. doi:10.4271/2018-01-0183
Liu, J., and Dumitrescu, C. E. (2019). Combustion Partitioning inside a Natural Gas Spark Ignition Engine with a Bowl-In-Piston Geometry. Energ. Convers. Manage. 183, 73–83. doi:10.1016/j.enconman.2018.12.118
Liu, J., and Dumitrescu, C. E. (2019). Methodology to Separate the Two Burn Stages of Natural-Gas Lean Premixed-Combustion inside a Diesel Geometry. Energ. Convers. Manage. 195, 21–31. doi:10.1016/j.enconman.2019.04.091
Liu, J., and Dumitrescu, C. E. (2019). Numerical Investigation of Methane Number and Wobbe index Effects in Lean-Burn Natural Gas Spark-Ignition Combustion. Energy Fuels 33 (5), 4564–4574. doi:10.1021/acs.energyfuels.8b04463
Liu, J., and Wang, H. (2022). Machine Learning Assisted Modeling of Mixing Timescale for LES/PDF of High-Karlovitz Turbulent Premixed Combustion. Combustion and Flame 238, 111895. doi:10.1016/j.combustflame.2021.111895
Liu, Z., and Liu, J. (2021). Effect of Altitude Conditions on Combustion and Performance of a Turbocharged Direct-Injection Diesel Engine. Proc. Inst. Mech. Eng. D: J. Automobile Eng. 236 (4), 09544070211026204. doi:10.1177/09544070211026204
Liu, Z., and Liu, J. (2021). Experimental Investigation of Combustion Characteristics of a Single cylinder Diesel Engine at Altitude. J. Energ. Resour. Technol. 143 (10), 102306. doi:10.1115/1.4050575
Liu, Z., Zhang, Y., Fu, J., and Liu, J. (2021). “Three-dimensional Fluid Dynamics Modeling of a 6V150 Diesel Engine,” in American Society of Mechanical Engineers International Mechanical Engineering Congress and Exposition. IMECE2021-67711, November 1-5, 2021.
Marseglia, G., Costa, M., Catapano, F., Sementa, P., and Vaglieco, B. M. (2017). Study about the Link between Injection Strategy and Knock Onset in an Optically Accessible Multi-cylinder GDI Engine. Energ. Convers. Manage. 134, 1–19. doi:10.1016/j.enconman.2016.12.012
Miganakallu, N., Yang, Z., Rogóż, R., Kapusta, Ł. J., Christensen, C., Barros, S., et al. (2020). Effect of Water - Methanol Blends on Engine Performance at Borderline Knock Conditions in Gasoline Direct Injection Engines. Appl. Energ. 264, 114750. doi:10.1016/j.apenergy.2020.114750
O'Rourke, P. J., and Amsden, A. A. (1987). The TAB Method for Numerical Calculation of spray Droplet Breakup. SAE International, Technical Paper 872089. doi:10.4271/872089
Potenza, M., Milanese, M., and de Risi, A. (2019). Effect of Injection Strategies on Particulate Matter Structures of a Turbocharged GDI Engine. Fuel 237, 413–428. doi:10.1016/j.fuel.2018.09.130
Splitter, D., Kaul, B., Szybist, J., and Jatana, G. (2017). Engine Operating Conditions and Fuel Properties on Pre-spark Heat Release and SPI Promotion in SI Engines. SAE Int. J. Engines 10 (3), 1036–1050. doi:10.4271/2017-01-0688
Stocchi, I., Liu, J., Dumitrescu, C. E., Battistoni, M., and Grimaldi, C. N. (2019). Effect of Piston Crevices on the Numerical Simulation of a Heavy-Duty Diesel Engine Retrofitted to Natural-Gas Spark-Ignition Operation. J. Energ. Resour. Technol. 141 (11), 112204. doi:10.1115/1.4043709
Storey, J. M., Lewis, S., Szybist, J., Thomas, J., Barone, T., Eibl, M., et al. (2014). Novel Characterization of GDI Engine Exhaust for Gasoline and Mid-level Gasoline-Alcohol Blends. SAE Int. J. Fuels Lubr. 7 (2), 571–579. doi:10.4271/2014-01-1606
Tan, Z., and Reitz, R. D. (2006). An Ignition and Combustion Model Based on the Level-Set Method for Spark Ignition Engine Multidimensional Modeling. Combustion and Flame 145 (1-2), 1–5. doi:10.1016/j.combustflame.2005.12.007
Verma, I., Bish, E., Kuntz, M., Meeks, E., Puduppakkam, K., Naik, C., et al. (2016). CFD Modeling of Spark Ignited Gasoline Engines-Part 1: Modeling the Engine under Motored and Premixed-Charge Combustion Mode. SAE International, Technical Paper 2016-01-0591. doi:10.4271/2016-01-0591
Verma, I., Bish, E., Kuntz, M., Meeks, E., Puduppakkam, K., Naik, C., et al. (2016). CFD Modeling of Spark Ignited Gasoline Engines-Part 2: Modeling the Engine in Direct Injection Mode along with spray Validation. SAE International, Technical Paper 2016-01-0579. doi:10.4271/2016-01-0579
Wen, M., Zhang, C., Yue, Z., Liu, X., Yang, Y., Dong, F., et al. (2020). Effects of Gasoline Octane Number on Fuel Consumption and Emissions in Two Vehicles Equipped with GDI and PFI Spark-Ignition Engine. J. Energ. Eng. 146 (6), 04020069. doi:10.1061/(asce)ey.1943-7897.0000722
Yan, Y. (2021). The Effect of Injection Timing on the Performance of Direct Injection Gasoline Engines. Bachelor Thesis. Hangzhou (China): Zhejiang University.
Zhang, M., Hong, W., Xie, F., Su, Y., Han, L., and Wu, B. (2017). Influence of Diluents on Combustion and Emission Characteristics of a GDI Engine. Appl. Therm. Eng. 124, 746–755. doi:10.1016/j.applthermaleng.2017.06.043
Zhang, M., Hong, W., Xie, F., Su, Y., Liu, H., and Zhou, S. (2018). Combustion, Performance and Particulate Matter Emissions Analysis of Operating Parameters on a GDI Engine by Traditional Experimental Investigation and Taguchi Method. Energ. Convers. Manage. 164, 344–352. doi:10.1016/j.enconman.2018.03.017
Zhang, Z., Zhang, W., Ma, X., Awad, O. I., Xu, H., and Shuai, S. (2020). Effects of GDI Injector Deposits on spray and Combustion Characteristics under Different Injection Conditions. Fuel 278, 118094. doi:10.1016/j.fuel.2020.118094
Zhu, G., Liu, J., Fu, J., Xu, Z., Guo, Q., and Zhao, H. (2018). Experimental Study on Combustion and Emission Characteristics of Turbocharged Gasoline Direct Injection (GDI) Engine under Cold Start New European Driving Cycle (NEDC). Fuel 215, 272–284. doi:10.1016/j.fuel.2017.10.048
Keywords: GDI engine, injection timing, in-cylinder combustion, CFD, mixture formation
Citation: Yan Y, Yang R, Sun X, Li R and Liu Z (2022) Numerical Investigations of Injection Timing Effects on a Gasoline Direct Injection Engine Performance: Part A, In-Cylinder Combustion Process. Front. Energy Res. 10:828167. doi: 10.3389/fenrg.2022.828167
Received: 03 December 2021; Accepted: 13 January 2022;
Published: 23 February 2022.
Edited by:
Jun Li, Guangzhou Institute of Energy Conversion (CAS), ChinaReviewed by:
Sheng Huang, East China University of Science and Technology, ChinaCopyright © 2022 Yan, Yang, Sun, Li and Liu. This is an open-access article distributed under the terms of the Creative Commons Attribution License (CC BY). The use, distribution or reproduction in other forums is permitted, provided the original author(s) and the copyright owner(s) are credited and that the original publication in this journal is cited, in accordance with accepted academic practice. No use, distribution or reproduction is permitted which does not comply with these terms.
*Correspondence: Zhentao Liu, bGl1enRAemp1LmVkdS5jbg==
Disclaimer: All claims expressed in this article are solely those of the authors and do not necessarily represent those of their affiliated organizations, or those of the publisher, the editors and the reviewers. Any product that may be evaluated in this article or claim that may be made by its manufacturer is not guaranteed or endorsed by the publisher.
Research integrity at Frontiers
Learn more about the work of our research integrity team to safeguard the quality of each article we publish.