- 1Central Mining Institute, Katowice, Poland
- 2Faculty of Economics and Management, Opole University of Technology, Opole, Poland
In this study, dynamic simulation models of CO2 injection into saline aquifers of the Choszczno-Suliszewo structure located in north-western Poland were constructed for two scenarios with different injection rates. The injection rates of 1 Mt CO2/year and 2 Mt CO2/year were analysed for each of the injection wells. Changes in pressures, characteristic for the sequestration process, were analysed; in addition, the spatial distribution of free CO2 saturation in the structure and carbon dioxide dissolved in brine were presented in a graphical form. The observation time of changes occurring in the rock mass in the interval of up to 1,000 years after the completion of injection was assumed. During the modelling of CO2 sequestration in Lower Jurassic aquifers in the Suliszewo model, the previously assumed CO2 injection rates were achieved for both injection scenarios. The observed pressure increase does not pose any threat to the Suliszewo structure tightness. The sequestration process was found to be highly effective due to the phenomenon of the dissolution of CO2 in brine and the resulting convection motion of brine enriched with carbon dioxide. Consequently, there is an increase in CO2 storage capacity and permanent long-term trapping of the injected carbon dioxide. The process of the displacement of injected CO2 from the collector layers to the layers constituting the reservoir sealing was observed. This phenomenon takes place in the upper parts of the Choszczno structure and is caused mainly by the locally occurring worse technical parameters of seal layers in this area.
1 Introduction
In recent years, we have been observing numerous international efforts to tackle the climate crisis constituting one of the greatest challenges of our times. The number of countries committed to achieve net zero emissions by mid-century or shortly thereafter continues to grow. However, the gap between rhetoric and action needs to close if we are to stand a chance of achieving net zero by 2050 and limiting the rise in global temperatures to 1.5°C. This challenge requires a total transformation of the energy systems that underpin the economies. We are now at the beginning of a critical decade for these efforts. The 26th Conference of the Parties (COP26) of the United Nations Framework Convention on Climate Change in November 2021 was the focal point for strengthening global ambitions and actions on climate by building on the foundations of the 2015 Paris Agreement (International Energy Agency (IEA), 2021).
The main objectives of the summit were to adopt the missing implementing legislation to the Paris Agreement and to make commitments that maintain the possibility of limiting the temperature rise to 1.5°C above the pre-industrial average temperature. In light of the above, the outcome of COP26 should be considered a success—provisions on transparency, international cooperation mechanisms and a common time frame have been agreed. The final declaration adopted indicates the need to take measures to reduce global emissions by 45% by 2030 compared to 2010, and to approach climate neutrality in the middle of the 21st century. The instruments for the implementation of these activities will be, among others, the rapid building of clean generation capacities in the energy sector, accelerating the abandonment of the use of coal without CO2 capture for this purpose, accelerated withdrawal of ineffective subsidies for fossil fuels, reduction of emissions of other greenhouse gases, but also better inclusion of the results of scientific research in the process of policy making. It was also emphasized that the transition to climate neutrality must be fair and that the protection of nature and ecosystems as natural sinks of carbon dioxide will play an important role. It was emphasized in the discussions that one cannot wait with actions to protect the climate, and the mere adoption of ambitious declarations will not stop climate change.
Despite the current gap between rhetoric and reality on emissions, there are still pathways which can help to reach net zero by 2050. It is now widely agreed that any effective response for avoiding the effects of climate change will require multiple large-scale solutions, including but not limited to new low-carbon energy production and storage (Hassanpouryouzband et al., 2021).
Moreover, carbon dioxide capture, utilisation and storage (CCUS) belongs to the technologies that can play an important role in achieving global energy and climate goals (IEAGHG, 2017; Smoliński et al., 2021; Tokarski et al., 2021). CCUS involves CO2 capture from large emission sources, including power plants or industrial facilities that use fossil fuels or biomass as fuel; CO2 can also be captured directly from the atmosphere. When not in use on site, the captured CO2 is compressed and transported by pipeline, waterway, rail or road for use in a variety of applications or injected into deep geological formations (e.g., depleted oil and gas deposits or saline aquifers) for permanent and safe storage.
There are currently twenty two CCUS facilities in operation worldwide, capable of capturing more than 40 Mt of CO2 per year (International Energy Agency (IEA), 2021). Some of these facilities have been in operation since the 1970s and 1980s, when natural gas processing plants in the Val Verde region of Texas began supplying CO2 to local oil producers to support crude oil extraction. Since these early projects became operational, CCUS technology has been significantly developed, the range of applications has been extended and industrial scale deployment of the technology has begun. The first large-scale CO2 capture and injection project with CO2 storage and monitoring was commissioned at the Sleipner offshore gas plant in Norway in 1996. About 1 Mt of CO2 per year is injected within the framework of the project and a total of more than 20 Mt of CO2 is stored in deep saline aquifers located about 1 km below the bottom of the North Sea (Solomon, 2007). The next example of a carbon dioxide capture and storage facility is the Boundary Dam project in Saskatchewan, Canada, which was the first project to capture and store CO2 from a coal-fired power plant on a commercial scale. The power plant was successfully modernised in 2014 and currently the capturing facility is operating at a capacity of approximately 1 Mt CO2/year. Most of the captured CO2 is transported via a 66 km pipeline and injected into the Weyburn oil field (EOR), while unused CO2 is injected into a saline aquifer 2 km away as part of the Aquistore project (International Energy Agency (IEA), 2021). Another example of CCS installation is the Petra Nova project in Texas (United States), which is the world’s largest post-combustion CO2 capture system from a coal-fired power plant currently in operation. The 240 MW unit at the W.A. Parish near Houston, Texas, was equipped with a post-combustion CO2 capture facility with a capacity of 1.4 Mt CO2/year. The captured CO2 was transported via a 130 km pipeline to the West Ranch oil field (Jackson County) for the needs of EOR. Currently, the Petra Nova installation in the United States has temporarily suspended CO2 capture operations due to low oil prices (International Energy Agency (IEA), 2021).
Stronger investment incentives and set climate targets are generating a new momentum for CCUS technology. Plans to build more than 30 commercial CCUS facilities have been announced in recent years. Many of these plans involve the development of industrial hubs that combine CO2 capture from a range of facilities with shared infrastructure for CO2 transport and storage. The examples include the Alberta Carbon Trunk Line (ACTL) project in Canada1, which became operational in 2020, and the planned Longship project in Norway2. CO2 storage involves injecting captured carbon dioxide into deep geological formations of porous rocks covered by an impermeable rock layer which seals the reservoir and prevents it from migrating towards the land surface or “leaking” into the atmosphere. There are several types of reservoirs suitable for CO2 storage, inter alia deep saline aquifers and depleted oil and gas fields, which have the highest storage potential. Deep saline aquifers are layers of porous and permeable rocks saturated with brine which are widespread in both onshore and offshore sedimentary basins. In contrast, depleted oil and gas reservoirs are porous rock formations that have held oil or gas for millions of years prior to extraction and may similarly allow permanent storage of injected CO2. When carbon dioxide is injected into a geological structure, it moves to fill the pore spaces in the rocks. The gas is usually compressed first to increase its density, and the potential reservoir typically needs to be at depths greater than 800 m to ensure that the injected CO2 remains in a supercritical state.
Carbon dioxide is permanently trapped in the reservoir by the following mechanisms (Juanes et al., 2006): structural trapping in which low-permeability overburden rocks provide a seal to the reservoir (Rosenbauer and Thomas, 2010; Zhang and Song, 2014); dissolved trapping in which CO2 dissolves in the brine that fills the rock pores (Leonenko and Keith, 2008; Han et al., 2011); residual trapping where CO2 becomes trapped in pore spaces in the rocks due to capillary forces (Pini et al., 2012; Li et al., 2017); mineral trapping whereby CO2 can react with minerals and organic matter in the geological formation, as a result of which carbonate minerals are formed through mineralisation and carbon dioxide becomes permanently bound to the rock matrix (Rochelle et al., 2004; Farajzadeh et al., 2009).
The nature and type of trapping mechanisms to provide permanent and effective CO2 storage, which vary depending on the geological conditions within a reservoir (Rosenbauer et al., 2005), are well understood owing to years of experience gained from projects involving CO2 injection through Enhanced Oil Recovery—EOR (Le Gallo et al., 2002; Godec et al., 2011), Enhanced Gas recovery—EGR (Van der Meer, 2005; Raza et al., 2018), Enhanced Coalbed Methane recovery - ECBM (Shi et al., 2005; Vishal, 2017), and CO2 storage in deep saline aquifers (Balashov et al., 2013; Bachu et al., 2014).
Moreover, there have been other applications for geological CO2 storage such as hydrocarbon recovery from unconventional hydrocarbon reserves (e.g., gas hydrates). CO2 sequestration and storage into methane (CH4) hydrate sediments are investigated (Jadhawar et al., 2021) to evaluate CH4 replacement by CO2 in hydrates through both the macroscale and microscale experiments under varying thermodynamic conditions. Various approaches of CO2 sequestration via gas hydrates are possible, including storage in seawater, sediments under the sea floor, permafrost regions, and methane hydrate reservoirs via CO2-CH4 exchange and depleted gas fields (Zheng et al., 2020).
CO2 storage in magmatic rocks (basalts), which have high concentrations of reactive chemicals, is also possible but is still at an early stage of development. Under this technology, the injected CO2 reacts with chemical components to form stable minerals in the rocks and, simultaneously, traps carbon dioxide in geological formations (Goldberg et al., 2008; Matter et al., 2011; Gysi and Stefánsson, 2012). Global resources for CO2 storage are believed to far exceed likely future demand. The International Energy Agency scenarios assume that CCUS technologies will play an important role in reducing CO2 emissions in the industrial and energy sectors.
In the IEA Sustainability Scenario (International Energy Agency (IEA), 2020), in which global CO2 emissions from the power sector fall to zero on a net basis by 2070, CCUS technology accounts for almost 15% of the cumulative emissions reductions compared to the Stated Policies Scenario (STEPS). The contribution of CCUS is steadily increasing and covers almost all parts of the global energy system. However, significant further research work is needed in many regions to convert theoretical storage capacity into estimates of ‘bankable storage’ status to support CCUS investments (Heddle et al., 2003; Balat and Öz, 2007; Smoliński et al., 2021). The availability and recognition of suitable geological formations and structures for underground CO2 storage still remain the key factors which limit the possibility of using CCS technology in climate plans. The selection of a suitable underground geological formation for permanent CO2 storage must be preceded by a detailed characterisation and assessment of the potential storage reservoir and the surrounding rock mass (Buscheck et al., 2012; Tokarski et al., 2021). The characterisation of the dynamic behaviour of carbon dioxide stored in the rock mass is an important step in the process of evaluating a potential CO2 reservoir (Kumar et al., 2020). Numerical modelling includes a series of simulations of the CO2 injection process into the storage site using a 3D static geological model of the rock mass. Available software packages for simulating phenomena related to the geological carbon dioxide storage process are mainly developed based on source codes of reservoir simulators used in the oil and gas industry. Jiang (Jiang, 2011) conducted a comparison of available reservoir simulators used for the numerical analysis of geological storage of carbon dioxide. The analysis shows that numerical simulations depend on the simulator used, characterised by the physical models used, numerical methods and specific discretisation methods. The results of numerical simulations determine the estimated CO2 storage capacities in geological structures, which are a key element in the decision-making process when considering the implementation of CCS projects on an industrial scale.
Within the framework of modelling dynamic behaviour of CO2 storage in the subsurface, researchers have proposed various numerical models. There are many case studies of CO2 storage around the world such as Johansen formation (Eigestad et al., 2009), Utsira formation (Møll Nilsen et al., 2015), Cranfield pilot project (Delshad et al., 2013), pilot project in Frio brine formation (Ghomian et al., 2008) to list but a few. Some review articles summarized the different physico-chemical methods responsible for suitable CO2 storage and the difficulties in other aspects (Riaz and Cinar, 2014; Aminu et al., 2017; Belhaj and Bera, 2017; Thakur et al., 2018). Moreover, Ajayi et al. (Ajayi et al., 2019) present all aspects of CCUS projects worldwide along with the technologies, modelling issues and physico-chemical processes occurring during the CO2 storage within geological formations.
Research activities into CCS in Poland encompass both theoretical works on the modelling of CO2 injection processes into geological formations (Tarkowski and Uliasz-Misiak, 2002; Scholtz et al., 2006; Tarkowski, 2008; Vangkilde-Pedersen et al., 2009) and experiments of small-scale CO2 injection into the Borzęcin gas deposit (Lubaś, 2007) and the Kaniów coal deposit (Van Bergen et al., 2009). In addition, intensive activities were carried out in Poland regarding the possibility of storing CO2 in saline aquifers (Uliasz-Misiak, 2007; Nagy and Siemek, 2009; Stopa et al., 2009; Solik-Heliasz, 2011). A number of formations and structures located in the area of Poland were analysed during the conducted research (Bromek et al., 2009; Jureczka et al., 2012; Wójcicki, 2012; Urych and Lutyński, 2019; Chećko et al., 2020; Koteras et al., 2020) in terms of safe CO2 storage and the potential for CO2 storage in saline aquifers in the Upper Silesian Coal Basin using numerical modelling methods (Urych and Smoliński, 2019). Additionally, potential geological structures for CO2 storage in formations occurring in the Polish Lowlands were characterized in detail (Marek et al., 2010), including the possibility of using the anticlines of Choszczno and Suliszewo for underground CO2 storage (Dziewińska and Tarkowski, 2012; Marek et al., 2013).
The objective of this paper is to present the results of numerical simulations of the CO2 storage process in brine aquifers in the area of Choszczno and Suliszewo anticlines located in the Szczecin Trough in north-western Poland. Model tests and numerical simulations were carried out using the Petrel Reservoir Engineering software (Schlumberger Information Solutions, 2010) cooperating with the ECLIPSE reservoir simulator (Schlumberger Information Solutions, 2011).
2 Materials and Methods
2.1 Location of the Study Area, Land Use and Geological Structure
Two anticlinal structures, Choszczno and Suliszewo, Poland, were selected for the simulation of CO2 injection into brine aquifers. Both are located in the north-western part of Poland. The Choszczno structure is situated in the vicinity of the towns of Pełczyce and Choszczno (Figure 1). The area of the studied reservoir is characterised by a dispersed rural development with some forested areas. Arable fields and meadows play a dominant role. The studied area is situated within a distance of 25 km from Pyrzyce and Stargard Szczeciński which use or previously used the heat obtained from geothermal waters. The Suliszewo anticline is located approximately 12 km from the Choszczno reservoir (Figure 1). Similarly to the Choszczno structure, this area is also dominated by meadows and arable fields with a slightly higher share of woodlands. Within the boundaries of the Suliszewo reservoir there are both already functioning and planned protected areas established within the Natura 2000 programme. The analysed areas were identified on the basis of the well data and seismic surveys. One deep well was drilled in the area of potential reservoirs and the remaining ones are situated at considerable distances from the analysed areas. A relatively high density of wells is observed north-east of the Suliszewo Reservoir in the area of Kalisz Pomorski (Figure 1), with the remaining wells distributed in irregular grid pattern mainly north and south of the studied areas. The seismic survey profiles, mostly running NE-SW and NW-SE, provide valuable information for studies.
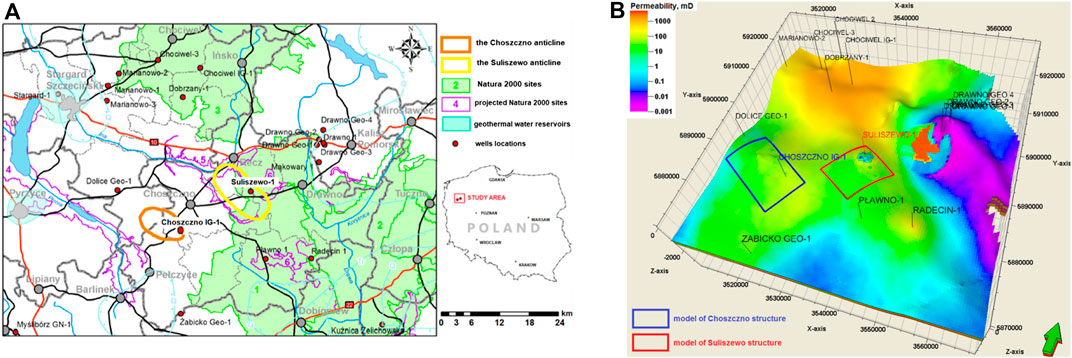
FIGURE 1. Choszczno-Suliszewo area: (A) Location map and (B) structures delineated in a static numerical model.
The overburden of the potential reservoirs in the studied area consists of Quaternary, Tertiary, Cretaceous and Upper and Middle Jurassic sediments. The Quaternary sediments consist of clays, gravels, sands and silts which were formed as a result of glacial and interglacial processes. The thickness of the Quaternary cover in the Choszczno reservoir area is 148 m, and in the case of Suliszewo—163 m. The Tertiary sediments in the studied area are characterized by variable thickness from about 3 m in the Choszczno area to 63 m in the Suliszewo area. The Tertiary sediments are Middle Miocene sediments consisting mainly of dark brown clays with inclusions of silts and very fine-grained clay sands. The lithology of the Upper Cretaceous is dominated by marls, marly and pelitic limestones as well as marly opaques. The thickness of the Upper Cretaceous in the studied area is approx. 800 m. The Lower Cretaceous sediments (Albian, Hoterivian) in the upper part of the profile are formed by marly limestones, while in the lower part by marly-sandy and clay-sandy formations. The Lower Cretaceous sediments in the south-western part of the Szczecin Trough are considerably reduced—their thickness ranges from 5 to 30 m. The thickness of the Lower Cretaceous sediments in the studied area ranges from 12.5 m (the Choszczno reservoir) to 20 m (the Suliszewo reservoir). In the formations of the Upper Jurassic, Lower and Middle Oxfordian sediments are distinguished. The Lower Oxford is represented by marl and marly siltstone sediments, whereas the Middle Oxford is represented by siltstone with insets of mudstone, oolitic limestone and marly siltstone. The Middle Jurassic sediments are characterised by bipartite character. The upper part of the profile is formed by Upper Jurassic sediments composed of sandy and marly mudstones, underlain by marly dolomites and dolomitic mudstones. The total thickness of the Upper and Middle Jurassic sediments in the studied area ranges from 167 to 180 m. The Lower Jurassic Gryfice Beds (Lower Toarcian) of thickness ranging from 40 m (Suliszewo) to 70 m (Choszczno), which are divided into two sections, the upper and the lower, constitute the formations sealing the reservoir series. The upper section is comprised mainly of siltstones and mudstones, whereas the lower section is represented by marine ingression sediments containing mainly clay shales with inserts of siderite and dolomitic sandstone.
The most favourable parameters for carbon dioxide storage within the Choszczno and Suliszewo structures are found in the Lower Jurassic Komorowo Beds of the Upper Pliensbachian (Domerian) age and the Radów and Mechów Beds of the Synemurian. They are built mainly of fine-grained sandstones with clay inserts. The thickness of the Komorowo Beds in the Szczecin Trough ranges from 70 to 180 m; for the Choszczno Reservoir, it is 100 m, and for Suliszewo—about 80 m. The thickness of the Radów and Mechów Beds is 120 and 80 m, respectively. The sediments of the Łobez Beds constitute a series that underlies the Komorowski strata. The age of the Łobez Beds was determined as Lower Pliensbachian—Carix. In general, the Łobez Beds in the Szczecin Trough are composed of silt, clay and sandy sediments. The thickness of the series underlying the Komorowo Beds in the area of the analysed reservoirs ranges from 20 m (Choszczno) to 40 m (Suliszewo). Below the reservoir formations, there occur dark grey claystones of the Upper Triassic (the Rhaetian) (Dadlez, 1979).
2.2 Description of Simulation Model
A structural and parametric model developed for the Lower Jurassic reservoir formation located in the Radęcin-Suliszewo area (Michna and Papiernik, 2012) was used for numerical simulations of the process of CO2 injection into saline aquifers. The initial model was constructed on the basis of a regular grid of 116 × 120 cells with surface dimensions of 500 × 500 m. In this model, two regions were separated (Figure 1) in which simulations of CO2 injection into saline aquifers were carried out. The effective porosity of the simulation models of a potential CO2 deposit ranges from 26.2 to 27.6% for the Suliszewo structure and from 24.6 to 26.1% for the Choszczno structure. The permeability of the Suliszewo model ranges from 2,719.5 to 3,582.4 mD, whereas that of the Choszczno model—from 2,209.9 to 2,831.6 mD. The content of clay minerals ranges from 10 to 19% for the Suliszewo structure and from 14 to 23% for the Choszczno structure. Detailed characteristics of numerical models are summarized in Table 1.
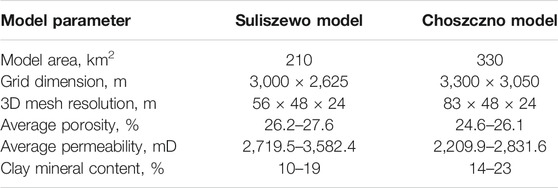
TABLE 1. Details of the reservoir simulation model and parameters of reservoir horizon of the Lower Jurassic Komorowo Beds (Michna and Papiernik, 2012; Luboń, 2021).
2.2.1 Description of Suliszewo Model
In the first of the separated numerical models, covering an area of about 210 km2, situated in the area of the Suliszewo-1 well, the horizontal grid resolution (200 × 200 m) and the orientation of the grid lines in NW-SE and perpendicular directions were modified (Figure 2). This resulted in a model with a cell resolution of 56 × 48 × 24 (64,512 cells). A cut-off method was then applied for permeability (0.01 mD), porosity (0.5%) and clay mineral content (70%). Hydrodynamic discontinuities were found in the Toarcian layers forming the seal of the Pliensbachian collector (Figure 2).
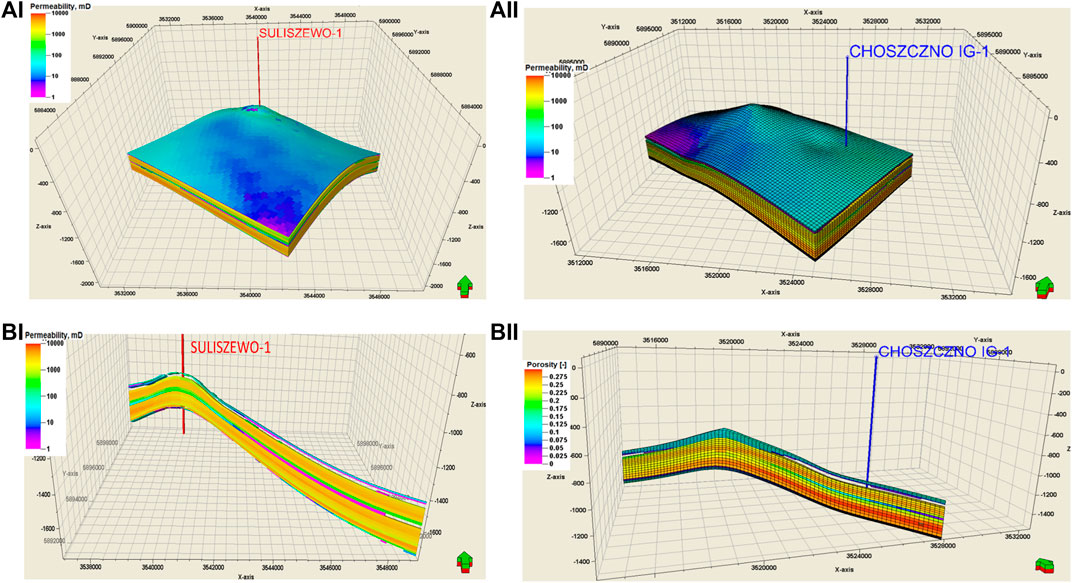
FIGURE 2. Numerical model in the (I) Suliszewo-1 and (II) Choszczno IG-1 well area: (A) Permeability model, (B) hydrodynamic discontinuity in the porosity model.
2.2.2 Description of Choszczno Model
The simulation model, located in the Choszczno IG-1 well site area, covers about 330 km2. The horizontal grid resolution in this model is 200 × 200 m and grid lines are oriented in NW-SE and perpendicular direction (Figure 2). Originally, the Choszczno model consisted of 95,616 cells (83 × 48 × 24), but after excluding from the simulation cells with permeability <0.01 mD, porosity <0.5%, and clay mineral content >70%, the final number of active cells is 78,910. The sealing layers in the Choszczno model are characterized by worse properties in comparison with analogous overburden rocks of the Suliszewo model analysed earlier. The modelled sealing of the reservoir in this region has lower values of clay mineral content (42–60%) than in the remaining part of the model (over 70%), especially in some areas of the upper part of the structure. The permeability of seal layers in the upper part of the structure ranges from 12 to 61 mD, and porosity—from 10 to 16%. After the application of the cut-off method for permeability and clay mineral content, a hydrodynamic discontinuity was found in the Toarcian layers forming the seal of the Pliensbachian collector. The cut-off parameter values used had the effect of deactivating the poorly permeable part of the Pliensbachian layers, but leaving a connection to the overlying layers at the top of the structure (near the injection well). Therefore, the part of the Choszczno model cells located at the top of the structure could not be considered as sufficient sealing of the reservoir and numerical simulations of the tightness of the structure had to be developed (Figure 2).
2.3 Models of Reservoir Fluids and Boundary Conditions
A composite version of the ECLIPSE simulator (E300) was used to simulate the process of the injection of carbon dioxide into saline aquifers in the Choszczno-Suliszewo region. In the dynamic models, the CO2SOL option was applied which takes into account the phenomenon of carbon dioxide solubility in the aqueous phase in the sequestration process. The Peng-Robinson equation of state was used with a slight modification concerning the molar volume, thanks to which the thermodynamic parameters of carbon dioxide are determined in a manner more similar to real conditions (Eclipse User Manual, 2011). The ECLIPSE reservoir simulator defines the sm3 unit as a cubic meter of gas at pressure 1,013.25 hPa and temperature equal to 15.56°C. The unit rm3 describes the volume of gas at reservoir conditions (Eclipse User Manual, 2011). Carbon dioxide viscosity was estimated using the Lorentz-Bray-Clark correlation (Lorentz et al., 1964). Parameters for CO2 solubility in brine were determined from the Chang-Coats-Nolen correlation (Chang et al., 1996). Aqueous phase properties follow the correlations used in the numerical model are presented in Table 2.
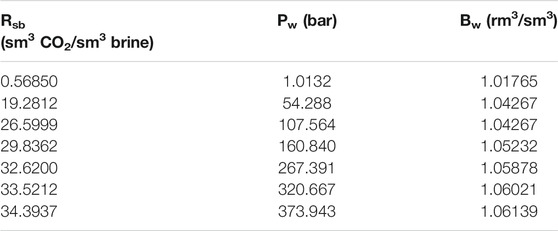
TABLE 2. CO2 solubility (Rsb) and CO2 formation volume factor (Bw) as function of pressure (Pw) (Chang et al., 1996).
The flow of carbon dioxide in layers saturated with water (brine) is controlled by the curves of relative permeability. Due to the fact that the authors did not have the results of the tests on the borehole cores, in this study the general liquid permeability and capillary pressure characteristics of van Genuchten (Van Genuchten, 1980) were used; relative gas permeability curves were generated based on Corey’s correlation (Corey, 1954; Doughty and Pruess, 2004).
In the initial phase of the simulation, the model is 100% saturated with brine with salinity of 12.9 g/dm3 and density of 1,009.3 kg/m3. The gas-water contact depth position, which was defined above the minimum model depth, was taken as the initial condition for the reservoir simulations carried out. The initial reservoir pressure at the depth of 1,069 m, amounting to 107.4 bar, was determined from measurements in the Radęcin-1 well. The average temperature of 38°C at the depth of 1,000 m was assumed. Fluids at the above mentioned pressure and reservoir temperature were in hydrostatic equilibrium conditions.
The numerical model was defined as open due to the lack of surface constraint of the analysed structure in the Lower Jurassic; in addition, the influence of the hydrodynamic openness of the geological structure on the CO2 storage process was considered. The aquifers surrounding the area covered by the numerical model were simulated using semi-analytic models of aquifers defined by Carter and Tracy (Carter and Tracy, 1960) developed for calculating water influx behaviour. The initial pressure in the analytical aquifer is similar to that in the numerical model, and the other parameters of the aquifer were taken as average quantities from the area of the numerical model. The simulation model was initiated at an average reservoir pressure of 10.74 MPa and temperature of 38°C at the depth of 1,069 m with a gradient of 0.03°C/m. The basic initial parameters assumed in each simulation model are summarised in Table 3.
2.4 Model Study Design
The simulations of the CO2 storage process in brine aquifers were carried out using vertical wells. For each of the two numerical models, two process simulation scenarios with different injection rates were adopted. The numerical simulations performed under Scenario no. 1 cover the injection at a capacity of 1 Mt CO2/year. Scenario no. 2 concerns an injection capacity of 2 Mt CO2/year. Therefore, the total amount of injected carbon dioxide under Scenario no. 1 is 25 Mt, and under Scenario no. 2 it is 50 Mt. Constant injection rate and maximum bottom pressure in the PBHP injection well were assumed as boundary conditions of the analysed process. The simulations of CO2 migration process in the analysed structure were carried out for 200-year and 1000-year time intervals after the completion of the injection. The simulations assumed the injection of CO2 in one well in the area of each anticline, at two depth intervals. Carbon dioxide is injected into the roof layers of the Pliensbachian and Sinemurian collectors (Table 4). The choice of the location of injection wells was considered in view of the efficiency of the sequestration process. In the Choszczno Reservoir, the Choszczno-2 injection well was located at a distance of about 2.5 km from the Choszczno IG-1 well (Figure 3), whereas in the Suliszewo Reservoir area, CO2 injection was planned in the existing Suliszewo-1 well (Figure 3).
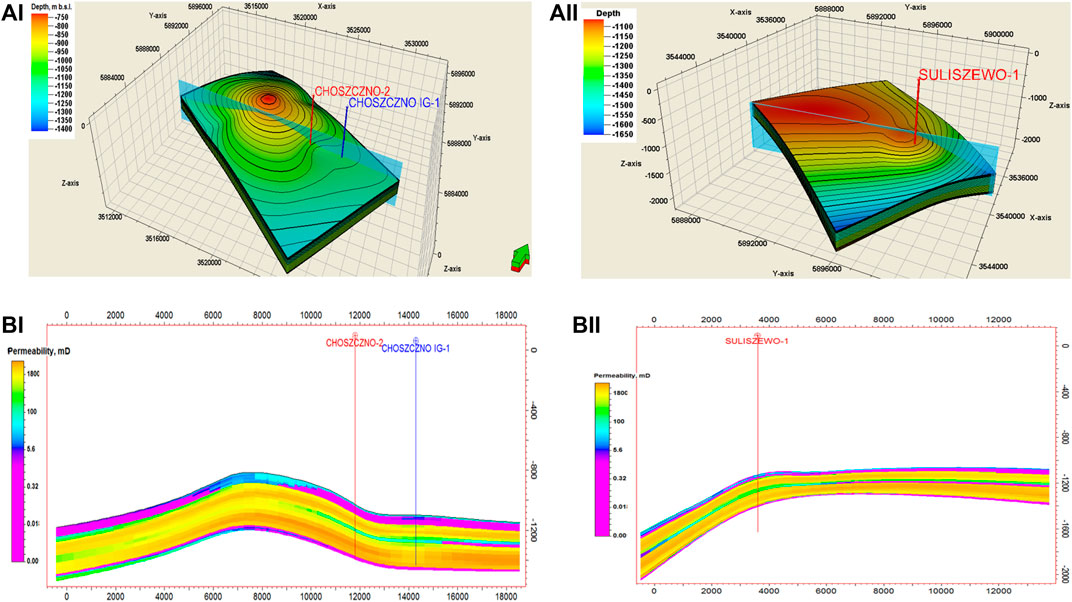
FIGURE 3. (A) Location of the injection well in the (I) Choszczno and (II) Suliszewo structure; (B) cross-section through the structure in the area of the Choszczno-2 and Suliszewo injection wells, respectively.
3 Results and Discussion
3.1 Simulation Results for Model of Suliszewo Structure – Scenario 1
In the course of CO2 injection simulations for Scenario no. 1, a constant daily injection rate of about 1,449 667 sm3/d was maintained in the Suliszewo model, which corresponds to a total quantity of injected CO2 equal to 25 Mt of CO2. The pressure at the bottom of the injection well drops sharply after the injection is completed; and in the further stage of the simulation, it reaches the original pressure. The bottom pressure in the injection well changes by about 3.5 bar, while the average pressure in the injection zone changes by about 4 bar (Figure 4).
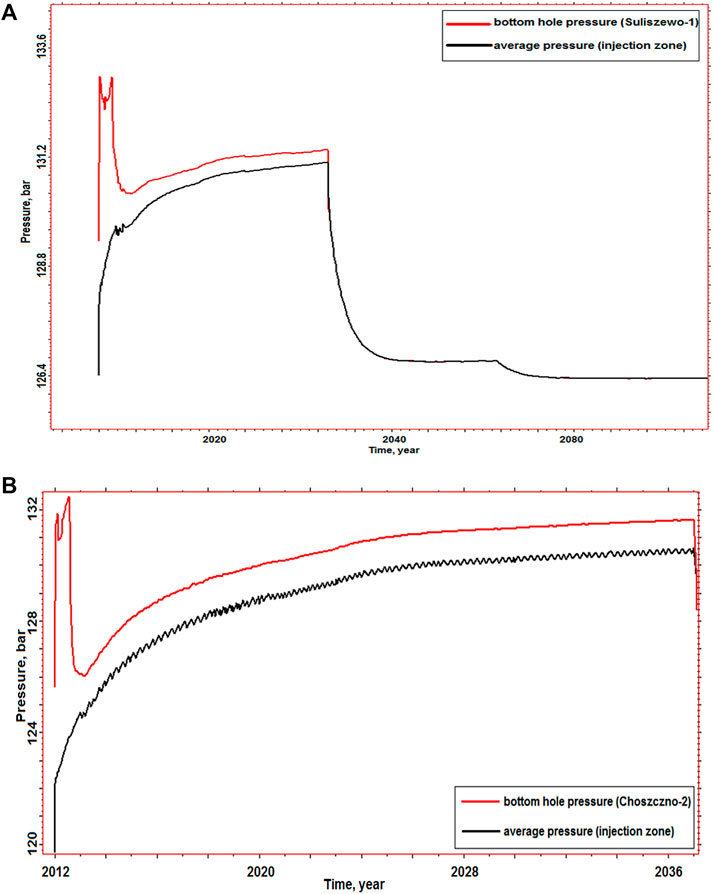
FIGURE 4. Bottomhole pressure in the (A) Suliszewo-1 and (B) Choszczno-2 well and average formation pressure in the injection zone.
The pressure increase in the collector roof layers is a maximum of about 5 bar after 25 years elapsed from the injection. In the following years, a pressure drop was observed in the upper parts of the structure due to the dissolution of CO2 in brine and its further migration in the collector roof layers. As a result of long-term simulations carried out for a further 1,000 years after the completion of the injection, it was found that after about 70 years the pressure in the roof is close to the original pressure before the start of the injection. In the initial phase of the simulation, the injected carbon dioxide accumulates in the region of the injection hole. Due to the differences in properties of individual layers of the model, as well as due to buoyancy forces and reservoir pressure gradient, a concentration of free CO2 is observed in the upper layers of the collector. With time, there is a slow movement of carbon dioxide along the collector roof in the S-E direction. The distribution of the saturation of the structure with the carbon dioxide remaining in the residual state for particular time intervals of the simulation is presented on cross sections passing through the near-well zone (Figure 5).
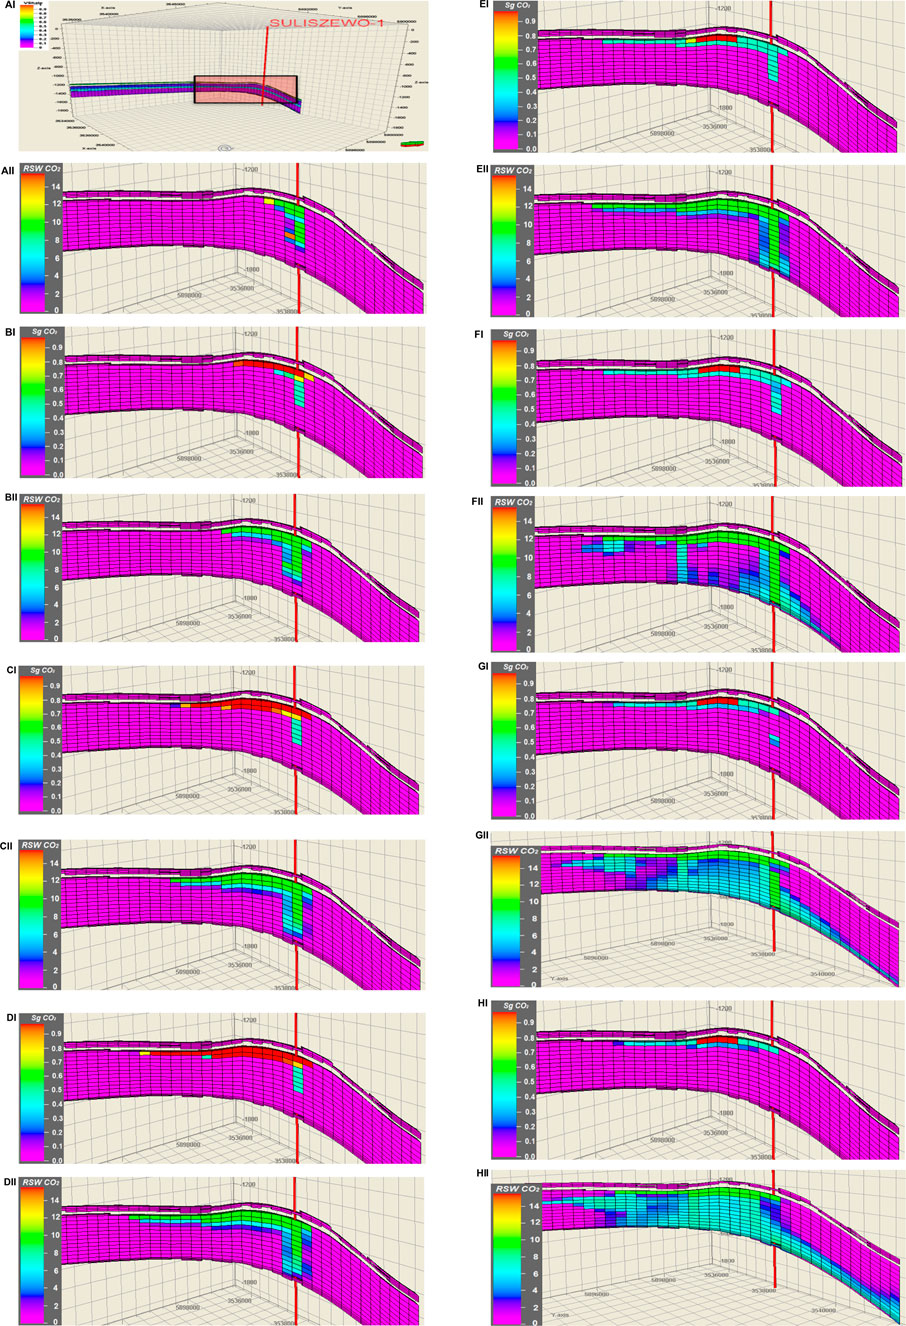
FIGURE 5. Determined section enlarged in the (I) distribution of free CO2 saturation in the structure and (II) structure saturation distribution of CO2 dissolved in brine (RSWCO2-molar fraction) after (A) 5, (B) 15, (C) 20, (D) 25, (E) 50, (f) 200, (G) 500 and (H) 1,000 years from the start of injection.
During the process of gravitational migration of CO2 towards the local top of the structure, the dissolution of carbon dioxide in brine takes place. The longer the gas migration time, the greater is the possibility that the CO2 will dissolve and remain in the pore spaces of the rocks. The distribution of dissolved CO2 in the analysed structure is presented by molar fractions for individual simulation time intervals (Figure 5). In the following Figures, a slow reduction process of the free phase of CO2 can be observed due to the fact that CO2 dissolves in brine and falls towards the lower layers of the collector. The brine convection phenomenon occurs due to the changes in its density caused by CO2 dissolution.
3.2 Simulation Results for Model of Suliszewo Structure—Scenario 2
The results of CO2 injection simulations for Scenario no. 2 in the Suliszewo model show a constant daily injection rate of about 2,899 334 sm3/d, which corresponds to a total amount of injected CO2 equal to 50 Mt. Similarly as in the case of Scenario no. 1, the pressure at the bottom of the injection well drops sharply after the injection is completed; in the further stage of the simulation it tends to reach the original pressure. The bottom pressure in the injection well changes by about 4 bar, while the change in average pressure in the injection zone is about 7 bar (Figure 6). The pressure increase in the collector roof layers is a maximum of about 9.5 bar after 25 years of the injection process. However, after the injection has been completed, the roof pressure decreases and only about 1.5 bar increase of the original roof pressure of the structure was already observed about 10 years after the injection had finished.
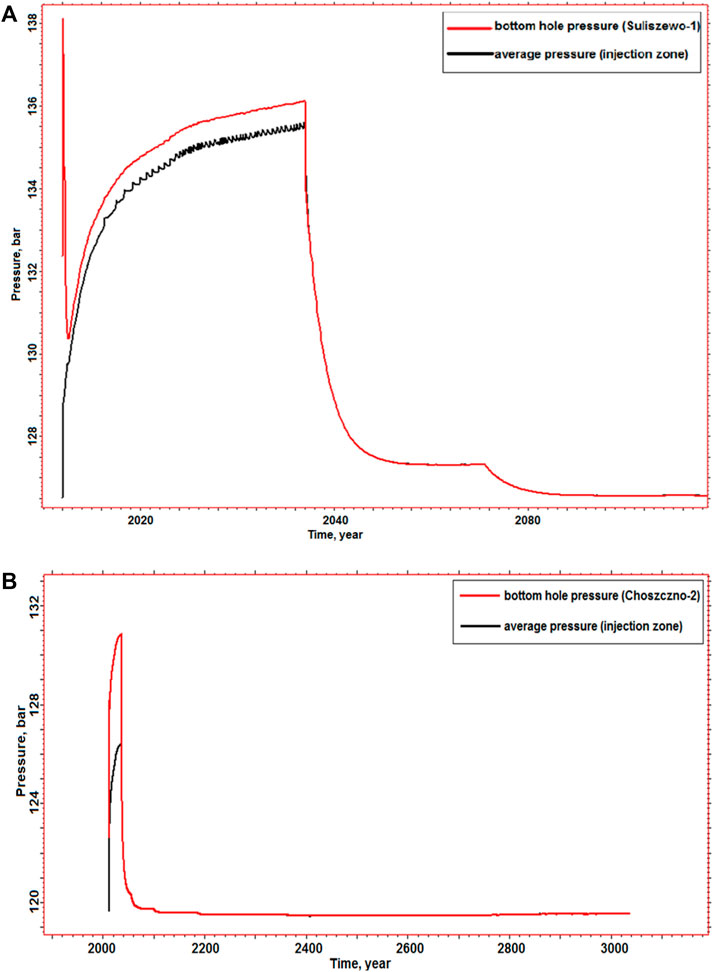
FIGURE 6. Bottom pressure in the (A) Suliszewo-1 and (B) Choszczno-2 wells, respectively and average formation pressure in the injection zone during and after injection.
In this injection scenario (2 Mt CO2/year), the formation and gradual development of free CO2 zones around the injection well takes place. It is also noticeable that CO2 moves towards the collector roof layers and further towards the local top of the structure due to the prevailing buoyancy forces. In addition, the phenomenon of CO2 dissolution in brine occurs here. The Figures below (Figure 7) show the changes in saturation of free CO2 (Figures on the right) and dissolved CO2 (Figures on the left) for the same time intervals. It is evident that the brine containing dissolved CO2 spreads over a much larger area compared to the residual CO2 zone.
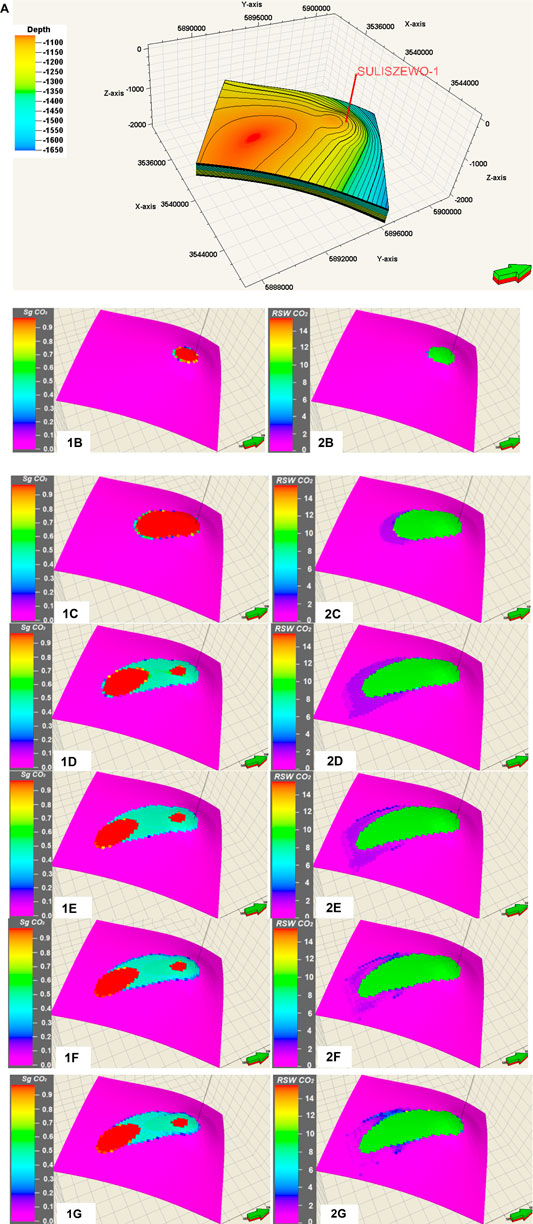
FIGURE 7. Determined section enlarged in the following Figures (A), the distribution of free CO2 saturation (1) and CO2 dissolved in brine RSWCO2-molar fraction (2) in the roof layer of the Pliensbachian collector after (B) 5, (C) 25 years of injection and after (D) 50, (E) 200, (F) 500, (G) 1,000 years after the completion of injection.
Figure 8 shows the dissolution rate of the injected carbon dioxide in brine for two simulation scenarios. The course of the CO2 dissolution process in brine largely depends on the effective contact area between carbon dioxide and brine.
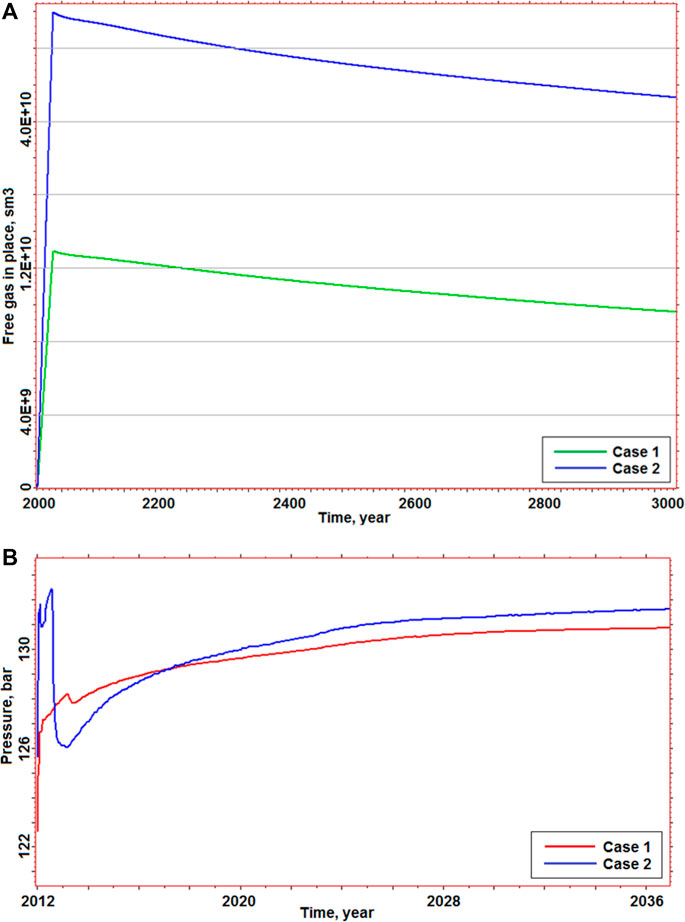
FIGURE 8. Comparison of changes in the quantity of free CO2 over time in the structure for Scenarios no. 1 and no. 2 in the (A) Suliszewo and (B) Choszczno-2 structures.
3.3 Simulation Results for Model of Choszczno Structure—Scenario 1
During CO2 injection simulations for Scenario no. 1 in the Choszczno model, a constant daily injection rate of about 1,449,667 sm3/d (1 Mt CO2/year) was maintained. The pressure increase in the sealing roof layers (resulting from the properties and partial penetration of CO2) was about 5 bar after 25 years of injection. Subsequently, a pressure drop was observed in the tops of the structure resulting from the dissolution of CO2 in brine. Long-term simulations carried out for a further 1,000 years after the injection has finished showed that when only about 100 years elapsed, the bottom pressure at the top of the structure was merely about 1.5 bar higher than the original pressure before the start of carbon dioxide injection. The bottom pressure in the injection well changes by about 6 bar, whereas the average pressure in the injection zone by about 5 bar (Figure 6).
In the case of the simulation of CO2 injection into the Choszczno structure, similar behaviour of the injected carbon dioxide was observed, i.e., the gravitational migration of CO2 towards the local top of the structure and simultaneous dissolution of carbon dioxide in brine. However, as mentioned before, the sealing layers in some upper areas of the discussed structure have lower values of clay mineral content (42–60%) than in the rest of the model (above 70%). The permeability of the sealing layers in the upper part of the structure is also high and ranges from 12 to 61 mD. After the simulation, it was found that partial carbon dioxide permeation into the cells of the sealing layers connected to the Pliensbachian collector layers took place. The distribution of CO2 free saturation in the structure after 25 years of injection is shown in the vertical section (Figure 9). In the next Figure, a slow reduction process of the free CO2 phase can be observed due to the fact that the CO2 dissolves in brine and falls towards the lower layers of the collector. The distribution of the saturation of the CO2 dissolved in brine after 25 years of injection is shown in the vertical section by molar fraction (Figure 9). In addition, the distribution of the saturation of the carbon dioxide injected in the Pliensbachian collector roof layer (Figure 10) and in the roof layer of the reservoir sealing - Toarcian (Figure 10) was illustrated.
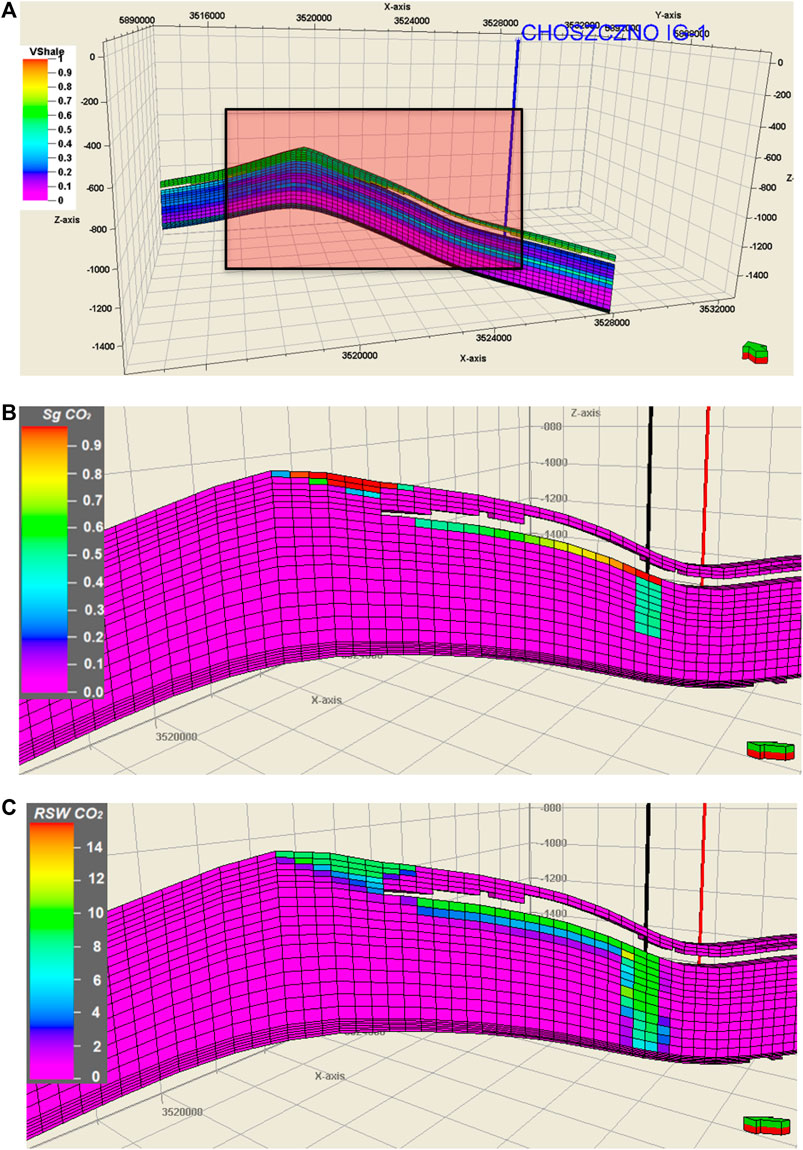
FIGURE 9. The determined fragment of the section enlarged in the following Figures (A), the distribution of free CO2 saturation in the structure (B) and the distribution of CO2 saturation dissolved in brine (c) after 25 years of injection.
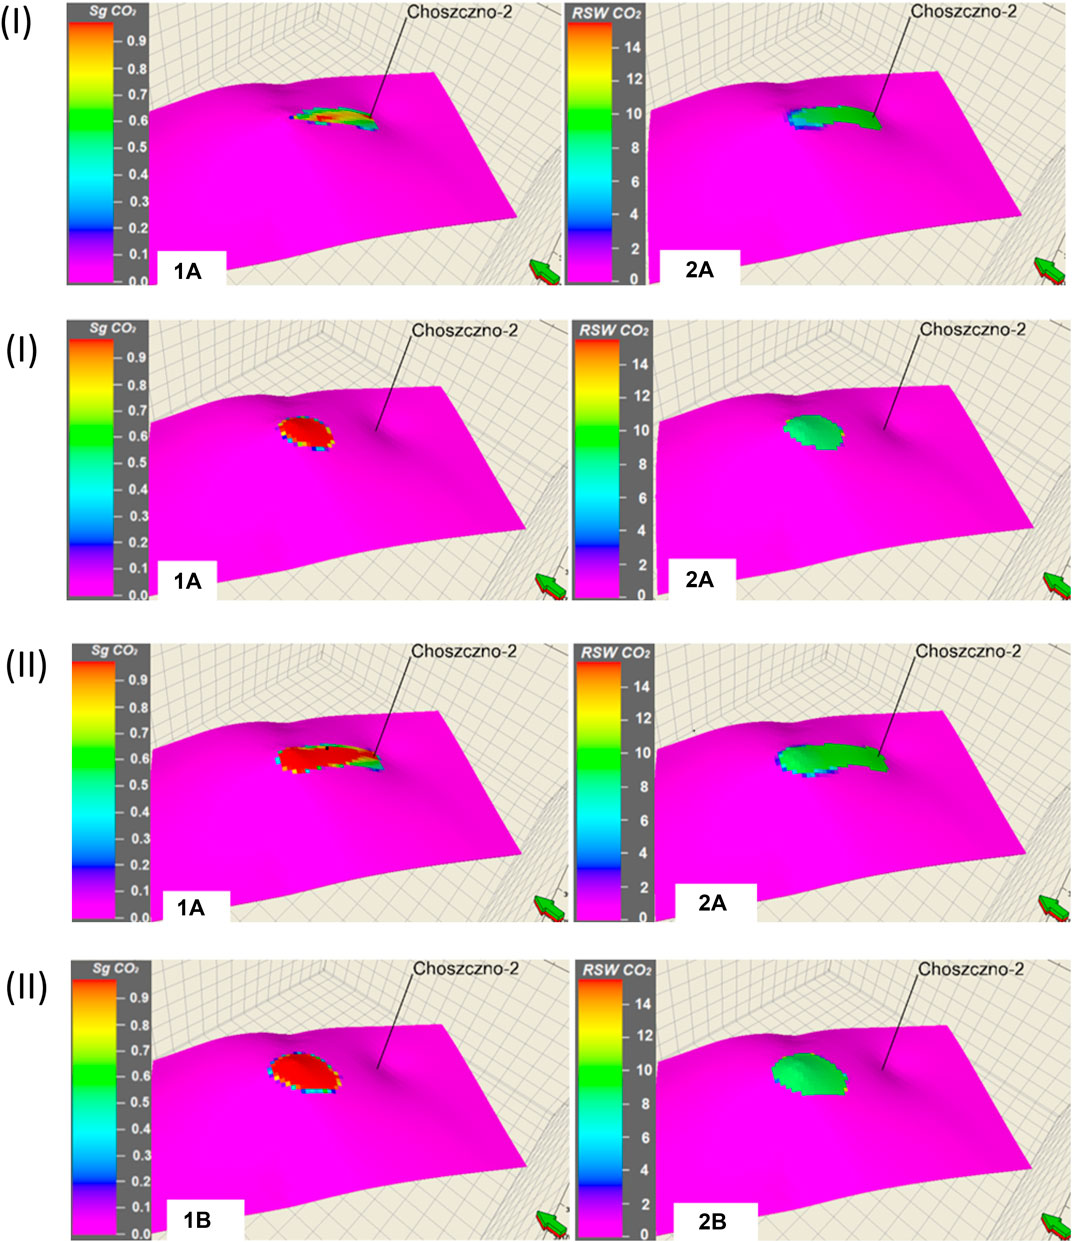
FIGURE 10. Distribution of saturated free CO2 (1) and dissolved CO2 (2) in the (I) Pliensbachian collector roof layer and (II) (A) and in the sealing roof layer (B) in the sealing roof layer of the Toarcian after 25 years of injection.
3.4 Simulation Results for Model of Choszczno Structure—Scenario 2
During simulations of CO2 injection for Scenario no. 2, a constant daily injection rate of about 2,899 334 sm3/d (2 Mt CO2/year) was maintained in the Choszczno model. The bottom pressure in the injection well changes by about 7 bar, while the average pressure in the injection zone—by about 9 bar (Figure 4).
Figure 8 shows the comparison of the above-mentioned pressure values for the two injection scenarios. The pressure increase in the sealing roof layers was about 12 bar after 25 years of injection. In comparison, the increase in the same pressure for Scenario no. 1 (injection with a capacity of 1 Mt CO2/year) was about 5 bar.
In the case of the simulation of the CO2 injection process with the output of 2 Mt CO2/year, the rate of carbon dioxide spreading is higher and the size of the area saturated with CO2 is larger as compared to the results of the simulation of injection with the output of 1 Mt CO2/year. In a similar way as for Scenario no. 1, the results of the simulations according to Scenario no. 2 for Choszczno structure are presented in Figures 10, 11.
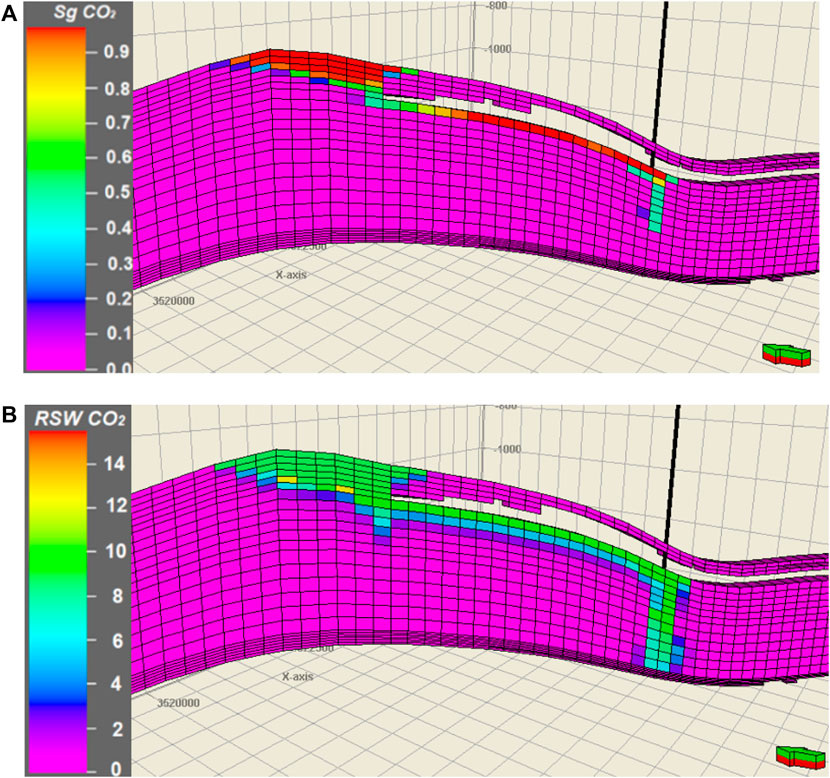
FIGURE 11. Distribution of free CO2 saturation in the structure (A) and CO2 dissolved in brine (B) after 25 years of injection.
4 Conclusion
In this paper, multiple simulations of geological storage of carbon dioxide in brine aquifers of the Choszczno-Suliszewo structure were performed according to the assumed injection scenarios diversified in terms of efficiency. Based on the obtained results of numerical calculations, the changes in pressures characteristic for the sequestration process were analyzed and the spatial distribution of free CO2 saturation in the structure as well as carbon dioxide dissolved in brine were presented in a graphic form.
During the modelling of the CO2 sequestration process in aquifers of the Lower Jurassic in the Suliszewo model, the assumed CO2 injection capacities were achieved for both injection scenarios. As a result of the injection, the pressure rise in the roof part of the collector ranged from 0.5 to 1.0 MPa depending on the injection scenario. The observed increase of pressures does not seem to pose any threat to the tightness of the Suliszewo structure. No changes in pressure in the roof of the reservoir sealing layers were observed in this area.
After carrying out simulations in the Choszczno model, the process of displacement of the injected CO2 from the collector layers to the layers constituting the reservoir seal was observed. This phenomenon takes place in the upper parts of the Choszczno structure; the locally occurring inferior parameters of seal layers in this region are the main reason for the occurrence of the phenomenon.
An increase in pressure in the roof part of the collector ranging from 0.5 to 1.0 MPa and an additional increase in pressure in the insulating layer of the Toarcian ranging from 0.5 to 1.2 MPa were observed.
In the simulations developed, the formation and gradual development of free CO2 zones around the injection wells was observed. Another observation was that CO2 moves towards the collector roof layers and further towards the local top of the structure due to the prevailing buoyancy forces. During the process of the gravitational migration of CO2 towards the local top of the structure, the phenomenon of the dissolution of carbon dioxide in brine takes place. The longer the gas migration time, the greater is the possibility that CO2 will dissolve and remain in the pore spaces of the rocks.
A slow reduction of the free phase of CO2 was observed due to the fact that CO2 dissolves in brine and falls towards the lower layers of the collector. The brine convection phenomenon occurs due to the changes in its density caused by CO2 dissolution.
The brine containing the dissolved CO2 spreads over a much larger area compared to the residual CO2 zone. The course of CO2 dissolution in brine largely depends on the effective contact area of carbon dioxide with brine.
The sequestration process was found to be highly effective due to the dissolution of CO2 in brine and the resulting convective movement of the brine enriched with carbon dioxide. This results in an increase in the sequestration capacity of the structure and permanent long-term trapping of the injected carbon dioxide.
Based on the reservoir parameters of the analyzed structures and the results of numerical simulations carried out, it was found that the Lower Jurassic sandstone formations in the areas in question show very good conditions for the effective underground storage of carbon dioxide.
The simulations performed and the analysis of their results allow to conclude that the CO2 storage capacity of the analyzed structures significantly exceeds the quantities of the injected CO2 assumed in the simulations.
It should be noted, however, that there are 19 wells situated up to 30 km from the potential reservoirs in Choszczno and Suliszewo which are relatively easy migration paths for the injected CO2. Therefore, works preceding the sequestration of carbon dioxide should take into account a detailed study of their technical condition and a possible method of subsequent decommissioning of some wells.
The chemical reaction of CO2 dissolved in groundwater with groundwater salt solution and rock mineral composition may affect the permeability of CO2 in the rock formation and in consequence adversely affect the safety of storage. The evaluation of the safety of storage in terms of rock properties are not considered by the authors of this work. Additionally, the results of numerical modeling should be verified after obtaining experimental data of some parameters; for example, the solubility of CO2 in aqueous solutions of salts. A detailed analysis of the uncertainty of rock properties in the models, the uncertainty of numerical simulation results and sensitivity analysis of model parameters are planned in the framework of additional future work using “Uncertainty and Optimization” module of Petrel software.
Data Availability Statement
The raw data supporting the conclusion of this article will be made available by the authors, without undue reservation.
Author Contributions
Conceptualization, TU, JC, MM, and AS; methodology, TU, JC, MM and AS; formal analysis, TU and JC; investigation, TU; writing—original draft preparation, TU, MM, and JC visualization, TU; supervision, AS.
Funding
This work was supported by Narodowy Fundusz Ochrony Środowiska i Gospodarki Wodnej, Poland, Grant Number 408/2008/15u-07/FG-GO-Tx/D.
Conflict of Interest
The authors declare that the research was conducted in the absence of any commercial or financial relationships that could be construed as a potential conflict of interest.
Publisher’s Note
All claims expressed in this article are solely those of the authors and do not necessarily represent those of their affiliated organizations, or those of the publisher, the editors and the reviewers. Any product that may be evaluated in this article, or claim that may be made by its manufacturer, is not guaranteed or endorsed by the publisher.
Footnotes
2https://ccsnorway.com/report-developing-longship-key-lessons-learned.
References
Ajayi, T., Gomes, J. S., and Bera, A. (2019). A Review of CO2 Storage in Geological Formations Emphasizing Modeling, Monitoring and Capacity Estimation Approaches. Pet. Sci. 16, 1028–1063. doi:10.1007/s12182-019-0340-8
Aminu, M. D., Nabavi, S. A., Rochelle, C. A., and Manovic, V. (2017). A Review of Developments in Carbon Dioxide Storage. Appl. Energ. 208, 1389–1419. doi:10.1016/j.apenergy.2017.09.015
Bachu, S., Melnik, A., and Bistran, R. (2014). Approach to Evaluating the CO2 Storage Capacity in Devonian Deep Saline Aquifers for Emissions from Oil Sands Operations in the Athabasca Area, Canada. Energ. Proced. 63, 5093–5102. doi:10.1016/j.egypro.2014.11.539
Balashov, V. N., Guthrie, G. D., Hakala, J. A., Lopano, C. L., Rimstidt, J. D., and Brantley, S. L. (2013). Predictive Modeling of CO2 Sequestration in Deep saline sandstone Reservoirs: Impacts of Geochemical Kinetics. Appl. Geochem. 30, 41–56. doi:10.1016/j.apgeochem.2012.08.016
Balat, H., and Öz, C. (2007). Technical and Economic Aspects of Carbon Capture an Storage - A Review. Energy Exploration & Exploitation 25 (5), 357–392. doi:10.1260/014459807783528883
Belhaj, H., and Bera, A. (2017). A Brief Review of Mechanisms for Carbon Dioxide Sequestration into Aquifer Reservoirs. Ijpe 3 (1), 49–66. doi:10.1504/IJPE.2017.088996
Bromek, T., Chećko, J., and Jureczka, J. (2009). “Wstępna Ocena Możliwości Lokalizacji Składowisk CO2 W Warstwach Solankowych W Rejonie GZW (Initial Assessment of the Possibility of Locating CO2 Storage Sites in saline Aquifers in the USCB, Materials Science conference.),” in Mat. II Konf.: Geologia, Hydrogeologia I Geofizyka W Rozwiązywaniu Problemów Współczesnego Górnictwa I Energetyki. Prace Naukowe GIG. Górnictwo I Środowisko, 55–63. Kwartalnik Nr 4/2009, (In Polish). Katowice: Główny Instytut Górnictwa.
Buscheck, T. A., Sun, Y., Chen, M., Hao, Y., Wolery, T. J., Bourcier, W. L., et al. (2012). Active CO2 Reservoir Management for Carbon Storage: Analysis of Operational Strategies to Relieve Pressure Buildup and Improve Injectivity. Int. J. Greenhouse Gas Control. 6, 230–245. doi:10.1016/j.ijggc.2011.11.007
Carter, R. D., and Tracy, G. W. (1960). An Improved Method for Calculating Water Influx. Trans. AIME. 219, 415–417. doi:10.2118/1626-g
Chang, Y. B., Coats, B. K., and Nolen, J. S. (1996). “A Compositional Model for CO2 Floods Including CO2 Solubility in Water. SPE 35164,” in Proc. Permian Basin Oil and Gas Recovery Conference, Midland, Texas.
Chećko, J., Urych, T., Magdziarczyk, M., and Smolinski, A. (2020). Research on the Processes of Injecting CO2 into Coal Seams with CH4 Recovery Using Horizontal Wells. Energies 13, 416.
Corey, A. T. (1954). The Interrelation between Gas and Oil Relative Permeabilities. Producers Monthly 19 (1), 38-41.
Dadlez, R. (1979). “Tektonika Kompleksu Cechsztyńsko-Mezozoicznego,” in Budowa Niecki Szczecińskiej I Bloku Gorzowa Pod Red. M. Jaskowiak-Schoeneichowej. Pr. Inst. Geol.. Warszawa: Państwowy Instytut Geologiczny, 96, 108–121.
Delshad, M., Kong, X., Tavakoli, R., Hosseini, S. A., and Wheeler, M. F. (2013). Modeling and Simulation of Carbon Sequestration at Cranfield Incorporating New Physical Models. Int. J. Greenhouse Gas Control. 18, 463–473. doi:10.1016/j.ijggc.2013.03.019
Doughty, C., and Pruess, K. (2004). Modeling Supercritical Carbon Dioxide Injection in Heterogeneous Porous Media. Vadose Zone J. 3, 837–847. doi:10.2113/3.3.837
Dziewińska, L., and Tarkowski, R. (2012). Budowa Geologiczna Struktury Choszczna (Niecka Szczecińska) W Świetle Interpretacji Sekcji Efektywnych Współczynników Odbicia Dla Potrzeb Podziemnego Składowania CO. Gospodarka Surowcami Mineralnymi – Mineral. Resour. Manage. 28 (1), 173–184.
Eigestad, G. T., Dahle, H. K., Hellevang, B., Riis, F., Johansen, W. T., and Øian, E. (2009). Geological Modeling and Simulation of CO2 Injection in the Johansen Formation. Comput. Geosci. 13, 435–450. doi:10.1007/s10596-009-9153-y
Farajzadeh, R., Zitha, P. L. J., and Bruining, J. (2009). Enhanced Mass Transfer of CO2 into Water: experiment and Modeling. Ind. Eng. Chem. Res. 48 (13), 6423–6431. doi:10.1021/ie801521u
Ghomian, Y., Pope, G. A., and Sepehrnoori, K. (2008). Reservoir Simulation of CO2 Sequestration Pilot in Frio Brine Formation, USA Gulf Coast. Energy 33, 1055–1067. doi:10.1016/j.energy.2008.02.011
Godec, M., Kuuskraa, V., Van Leeuwen, T., Stephen Melzer, L., and Wildgust, N. (2011). CO2 Storage in Depleted Oil fields: The Worldwide Potential for Carbon Dioxide Enhanced Oil Recovery. Energ. Proced. 4, 2162–2169. doi:10.1016/j.egypro.2011.02.102
Goldberg, D. S., Takahashi, T., and Slagle, A. L. (2008). Carbon Dioxide Sequestration in Deep-Sea basalt. Proc. Natl. Acad. SciencesMatter al 105 (29), 9920–9925. doi:10.1073/pnas.0804397105
Gysi, A. P., and Stefánsson, A. (2012). CO2-water-basalt Interaction. Low Temperature Experiments and Implications for CO2 Sequestration into Basalts. Geochimica et Cosmochimica Acta 81, 129–152. doi:10.1016/j.gca.2011.12.012
Han, W. S., Kim, K.-Y., Esser, R. P., Park, E., and McPherson, B. J. (2011). Sensitivity Study of Simulation Parameters Controlling CO2 Trapping Mechanisms in saline Formations. Transp Porous Med. 90 (3), 807–829. doi:10.1007/s11242-011-9817-7
Hassanpouryouzband, A., Joonaki, E., Edlmann, K., and Haszeldine, R. S. (2021). Offshore Geological Storage of Hydrogen: Is This Our Best Option to Achieve Net-Zero. ACS Energ. Lett. 6 (6), 2181–2186. doi:10.1021/acsenergylett.1c00845
Heddle, G., Herzog, H., and Klett, M. (2003). The Economics of CO2 Storage. Cambridge, Massachusetts: Massachusetts Institute of Technology, Laboratory for Energy and the Environment.
International Energy Agency (IEA) (2021). About CCUS. Paris. https://www.iea.org/reports/about-ccus.
International Energy Agency (IEA) (2020). World Energy Model. Paris: IEA. https://www.iea.org/reports/world-energy-model.
IEAGHG (2017). CCS Deployment in the Context of Regional Developments in Meeting Long-Term Climate Change Objectives. Cheltenham, UK: IEAGHG.
International Energy Agency (IEA) (2021). Net Zero by 2050 - A Roadmap for the Global Energy Sector. Paris. https://www.iea.org/reports/net-zero-by-2050.
Jadhawar, P., Yang, J., Chapoy, A., and Tohidi, B. (2021). Subsurface Carbon Dioxide Sequestration and Storage in Methane Hydrate Reservoirs Combined with Clean Methane Energy Recovery. Energy & Fuels 35 (2), 1567–1579. doi:10.1021/acs.energyfuels.0c02839
Jiang, X. (2011). A Review of Physical Modelling and Numerical Simulation of Long-Term Geological Storage of CO2. Appl. Energ. 88, 3557–3566. doi:10.1016/j.apenergy.2011.05.004
Juanes, R., Spiteri, E. J., Orr, F. M., and Blunt, M. J. (2006). Impact of Relative Permeability Hysteresis on Geological CO2storage. Water Resour. Res. 42 (12). doi:10.1029/2005WR004806
Jureczka, J., Chećko, J., Krieger, W., Kwarciński, J., and Urych, T. (2012). Perspektywy Geologicznej Sekwestracji CO2 W Połączeniu Z Odzyskiem Metanu Z Pokładów Węgla W Warunkach Górnośląskiego Zagłębia Węglowego (Prospects for Geological Storage of CO2 with Enhanced Coal Bed Methane Recovery in the Upper Silesian Coal Basin). Biuletyn Państwowego Instytutu Geologicznego. 448, 117–132. (In Polish).
Koteras, A., Chećko, J., Urych, T., Magdziarczyk, M., and Smolinski, A. (2020). An Assessment of the Formations and Structures Suitable for Safe CO2 Geological Storage in the Upper Silesia Coal Basin in Poland in the Context of the Regulation Relating to the CCS. Energies 13, 195. doi:10.3390/en13010195
Kumar, S., Foroozesh, J., Edlmann, K., Rezk, M. G., and Lim, C. Y. (2020). A Comprehensive Review of Value-Added CO2 Sequestration in Subsurface saline Aquifers. J. Nat. Gas Sci. Eng. 81, 103437. ISSN 1875-5100. doi:10.1016/j.jngse.2020.103437
Le Gallo, Y., Couillens, P., and Manai, T. (2002). “January. CO2 Sequestration in Depleted Oil or Gas Reservoirs,” in SPE International Conference on Health, Safety and Environment in Oil and Gas Exploration and Production. Kuala Lumpur, Malaysia: Society of Petroleum Engineers.
Leonenko, Y., and Keith, D. W. (2008). Reservoir Engineering to Accelerate the Dissolution of CO2 Stored in Aquifers. Environ. Sci. Technol. 42 (8), 2742–2747. doi:10.1021/es071578c
Li, Y., Ranjith, P. G., Perera, M. S. A., and Yu, Q. (2017). Residual Water Formation during the CO 2 Storage Process in Deep saline Aquifers and Factors Influencing it: A Review. J. CO2 Utilization 20, 253–262. doi:10.1016/j.jcou.2017.05.022
Lorentz, J., Bray, B. G., and Clark, C. R. J. (1964). Calculating Viscosity of Reservoir Fluids from Their Composition. J. Pet. Tech. 1171, 231.
Lubaś, J. (2007). Spotkanie Konsultacyjne W Sprawie Udziału Polski W Międzynarodowym Programie Sekwestracji CO2 (Consultation Meeting on Poland's Participation in the International CO2 Sequestration Program). Przegląd Geologiczny 55 (8), 647–649. (In Polish).
Luboń, K. (2021). Influence of Injection Well Location on CO2 Geological Storage Efficiency. Energies 14 (24), 8604. doi:10.3390/en14248604
Marek, S., Dziewińska, L., and Tarkowski, R. (2013). Możliwości Wykorzystania Antyklin Choszczna I Suliszewa Do Podziemnego Składowania CO2. Przegląd Górniczy 11, 76–89.
Marek, S., Tarkowski, R., and Dziewińska, L. (2010). Potencjalne Struktury Geologiczne Do Składowania CO2. [rozdział 3. W:] Potencjalne Struktury Geologiczne Do Składowania CO2 W Utworach Niżu Polskiego (Charakterystyka Oraz Ranking). Studia, Rozprawy, Monografie 164, 16–111.
Matter, J. M., Broecker, W. S., Gislason, S. R., Gunnlaugsson, E., Oelkers, E. H., Stute, M., et al. (2011). The CarbFix Pilot Project-Storing Carbon Dioxide in basalt. Energ. Proced. 4, 5579–5585. doi:10.1016/j.egypro.2011.02.546
Michna, M., and Papiernik, B. (2012). Analiza Elementów Ryzyka Geologicznego Rejonu Suliszewo-Radęcin W Kontekście Składowania CO2 — Analysis of Geological Risk Elements in the Suliszewo-Radęcin Area from the point of View of Carbon Dioxide Storage. Biuletyn Państwowego Instytutu Geologicznego, nr 448 (1), 81–86. Warszawa.
Møll Nilsen, H., Lie, K.-A., and Andersen, O. (2015). Analysis of CO2 Trapping Capacities and Long-Term Migration for Geological Formations in the Norwegian North Sea Using MRST-Co2lab. Comput. Geosciences 79, 15–26. doi:10.1016/j.cageo.2015.03.001
Nagy, S., and Siemek, J. (2009). “Bezpieczne Składowanie Ditlenku Węgla W Warstwach Wodonośnych I Złożach Gazu Ziemnego. (Safe Storage of Carbon Dioxide in saline Aquifers and Natural Gas Deposits, Materials Science Conference),” in Mat. II Konferencji Naukowo-Technicznej: Geologia, Hydrogeologia I Geofizyka W Rozwiązywaniu Problemów Współczesnego Górnictwa I Energetyki. Kroczyce-Podlesice: Główny Instytut Górnictwa. (In Polish).
Pini, R., Krevor, S. C. M., and Benson, S. M. (2012). Capillary Pressure and Heterogeneity for the CO2/water System in sandstone Rocks at Reservoir Conditions. Adv. Water Resour. 38, 48–59. doi:10.1016/j.advwatres.2011.12.007
Raza, A., Gholami, R., Rezaee, R., Bing, C. H., Nagarajan, R., and Hamid, M. A. (2018). CO2 Storage in Depleted Gas Reservoirs: A Study on the Effect of Residual Gas Saturation. Petroleum 4 (1), 95–107. doi:10.1016/j.petlm.2017.05.005
Riaz, A., and Cinar, Y. (2014). Carbon Dioxide Sequestration in saline Formations: Part I-Review of the Modeling of Solubility Trapping. J. Pet. Sci. Eng. 124, 367–380. doi:10.1016/j.petrol.2014.07.024
Rochelle, C. A., Czernichowski-Lauriol, I., and Milodowski, A. E. (2004). The Impact of Chemical Reactions on CO2 Storage in Geological Formations: a Brief Review. Geol. Soc. Lond. Spec. Publications 233 (1), 87–106. doi:10.1144/gsl.sp.2004.233.01.07
Rosenbauer, R. J., Koksalan, T., and Palandri, J. L. (2005). Experimental Investigation of CO2–brine–rock Interactions at Elevated Temperature and Pressure: Implications for CO2 Sequestration in Deep-saline Aquifers. Fuel Process. Technol. 86 (14-15), 1581–1597. doi:10.1016/j.fuproc.2005.01.011
Rosenbauer, R. J., and Thomas, B. (2010). “Carbon Dioxide (CO2) Sequestration in Deep saline Aquifers and Formations,” in Developments and Innovation in Carbon Dioxide (CO2) Capture and Storage Technology (Sawston, United Kingdom: Woodhead Publishing), 57–103. doi:10.1533/9781845699581.1.57
Schlumberger Information Solutions (2011). ECLIPSE Reservoir Engineering Software. New York, NY, USA: Schlumberger. version 2011.3.
Schlumberger Information Solutions (2010). Petrel Seismic-To-Simulation Software. New York, NY, USA: Schlumberger. version 2010.1.
Scholtz, P., Falus, G., Georgiev, G., Saftic, B., Goricnik, B., Hladik, V., et al. (2006). “Integration of CO2 Emission and Geological Storage Data from Eastern Europe – CASTOR WP1.2,” in Konferencja GHGT-8 [8th International Conference on Greenhouse Gas Control Technologies], Trondheim, Norway, 19-22 June 2006.
Shi, J. Q., Durucan, S., Shikaze, S. G., Sudicky, E. A., and Schwartz, F. W. (2005). CO2Storage in Deep Unminable Coal SeamsDensity-dependent Solute Transport in Discretely-Fractured Geologic media: Is Prediction Possible. Oil Gas Sci. Techn. - Rev. IFP 6034 (33), 547273–558291. doi:10.2516/ogst:2005037
Smoliński, A., Howaniec, N., Gąsior, R., Polański, J., and Magdziarczyk, M. (2021). Hydrogen Rich Gas Production through Co-gasification of Low Rank Coal, Flotation Concentrates and Municipal Refuse Derived Fuel. Energy 235, 121348. doi:10.1016/j.energy.2021.121348
Solik-Heliasz, E. (2011). Safety and Effectiveness of Carbon Dioxide Storage in Water-Bearing Aquifers of the Upper Silesian Coal Basin Region. Mineral. Resour. Manage. 27 (3), 141–149.
Solomon, S. (2007). Carbon Dioxide Storage: Geological Security and Environmental Issues–Case Study on the Sleipner Gas Field in Norway. Bellona report, 128.
Stopa, J., Zawisza, L., Wojnarowski, P., and Rychlicki, S. (2009). Potencjalne Możliwości Geologicznej Sekwestracji I Składowania Ditlenku Węgla W Polsce (Near-Term Storage Potential for Geological Carbon Sequestration and Storage in Poland). Mineral. Resour. Manage. 25 (1), 169–186.
Tarkowski, R. (2008). CO2 Storage Capacity of Geological Structures Located within Polish Lowlands Mesozoic Formations. Mineral. Resour. Manage. 24 (4/1), 101–111.
Tarkowski, R., and Uliasz-Misiak, B. (2002). Możliwości Podziemnego Składowania CO2 W Polsce W Głębokich Strukturach Geologicznych (Ropo-, Gazo- I Wodonośnych), [Possibilities of Underground Storage of CO2 in Poland in Deep Geological Structures (Oil-, Gas- and Water-Bearing)]. Przegląd Górniczy. 12, 25–29. (In Polish).
Thakur, I. S., Kumar, M., Varjani, S. J., Wu, Y., Gnansounou, E., and Ravindran, S. (2018). Sequestration and Utilization of Carbon Dioxide by Chemical and Biological Methods for Biofuels and Biomaterials by Chemoautotrophs: Opportunities and Challenges. Bioresour. Techn. 256, 478–490. doi:10.1016/j.biortech.2018.02.03910.1016/j.biortech.2018.02.039
Tokarski, S., Magdziarczyk, M., and Smoliński, A. (2021). Risk Management Scenarios for Investment Program Delays in the Polish Power Industry. Energies 14 (16), 5210. doi:10.3390/en14165210
Uliasz-Misiak, B. (2007). Polish Hydrocarbon Deposits Usable for Underground CO2 Storage. Mineral. Resour. Manage. 23 (4), 111–120.
Urych, T., and Lutyński, M. (2019). “The Concept of Geothermal Energy Production from Abandoned Coal Mine Converted into CO2 Reservoir,” in SGEM 2019: 19th International multidisciplinary scientific GeoConference: science and technologies in geology, exploration and mining, Albena - Bułgaria, 28 June–7 July 2019 19, 641–648. conference proceedings. doi:10.5593/sgem2019/1.3
Urych, T., and Smoliński, A. (2019). Numerical Modeling of CO2 Migration in Saline Aquifers of Selected Areas in the Upper Silesian Coal Basin in Poland. Energies 12, 3093. doi:10.3390/en12163093
Van Bergen, F., Winthaegen, P., Pagnier, H., Krzystolik, P., Jura, B., Skiba, J., et al. (2009). Assessment of CO2 Storage Performance of the Enhanced Coalbed Methane Pilot Site in Kaniow. Energ. Proced. 1 (1), 3407–3414. doi:10.1016/j.egypro.2009.02.130
Van der Meer, B. (2005). Carbon Dioxide Storage in Natural Gas Reservoir. Oil Gas Sci. Techn. - Rev. IFP 60 (3), 527–536. doi:10.2516/ogst:2005035
Van Genuchten, M. T. (1980). A Closed-form Equation for Predicting the Hydraulic Conductivity of Unsaturated Soils. Soil Sci. Soc. America J. 44, 892–898. doi:10.2136/sssaj1980.03615995004400050002x
Vangkilde-Pedersen, T., Anthonsen, K. L., Smith, N., Kirk, K., Neele, F., Van Der Meer, B., et al. (2009). Assessing European Capacity for Geological Storage of Carbon Dioxide-The EU GeoCapacity Project. Energ. Proced. 1, 2663–2670. doi:10.1016/j.egypro.2009.02.034
Vishal, V. (2017). Recent Advances in Coal Seam Sequestration Research in India - Highlighting Multiphase CO2 Flow for Deep Seam Sequestration. Energ. Proced. 114, 5377–5380. doi:10.1016/j.egypro.2017.03.1664
Wójcicki, A. (2012). Postępy Realizacji Krajowego Programu „Rozpoznanie Formacji I Struktur Do Bezpiecznego Geologicznego Składowania CO2 Wraz Z Ich Programem Monitorowania (Progress in the Polish National Program: Assessment of Formations and Structures for Safe CO2 Geological Storage, Including Monitoring Plans). Biul. PIG. 442, 9–16. (In Polish).
Zhang, D., and Song, J. (2014). Mechanisms for Geological Carbon Sequestration. Proced. IUTAM 10, 319–327. doi:10.1016/j.piutam.2014.01.027
Keywords: CCS—carbon capture and sequestration, simulation—computers, geological storage, greenhouse gas emission, CO2 capture and sequestration
Citation: Urych T, Chećko J, Magdziarczyk M and Smoliński A (2022) Numerical Simulations of Carbon Dioxide Storage in Selected Geological Structures in North-Western Poland. Front. Energy Res. 10:827794. doi: 10.3389/fenrg.2022.827794
Received: 02 December 2021; Accepted: 17 January 2022;
Published: 18 February 2022.
Edited by:
Andreas Busch, Heriot-Watt University, United KingdomReviewed by:
Aliakbar Hassanpouryouzband, University of Edinburgh, United KingdomChuanxiao Cheng, Zhengzhou University of Light Industry, China
Copyright © 2022 Urych, Chećko, Magdziarczyk and Smoliński. This is an open-access article distributed under the terms of the Creative Commons Attribution License (CC BY). The use, distribution or reproduction in other forums is permitted, provided the original author(s) and the copyright owner(s) are credited and that the original publication in this journal is cited, in accordance with accepted academic practice. No use, distribution or reproduction is permitted which does not comply with these terms.
*Correspondence: Adam Smoliński, c21vbGluQGdpZy5rYXRvd2ljZS5wbA==
 Tomasz Urych
 Jarosław Chećko1
 Adam Smoliński
