 A. Romdhane
 B. Emmel
 S. Zonetti
 B. Dupuy
 K. Gawel3
- 1SINTEF Industry, Applied Geoscience Group, Trondheim, Norway
- 2SINTEF Digital, Applied Optics Group, Oslo, Norway
- 3SINTEF Industry, Drilling and Well Group, Trondheim, Norway
Carbon capture and storage (CCS) is an inevitable action to achieve CO2 emission reduction targets including becoming net-zero by 2050. Increased efforts are therefore required to identify suitable locations for large-scale CO2 storage. In addition to large aquifers, shut down oil and gas fields in the North Sea are logical candidates for offshore large-scale CO2 storage because of their proven storage capacity, reliable caprock integrity, established infrastructure, and public acceptance. However, in some cases, old and legacy wells are subject to high uncertainties in their integrity, and they can compromise CO2 containment in such reservoirs. On the Norwegian Continental Shelf (NCS), such wells are numerous even outside of oil and gas production areas, i.e., legacy wells affecting aquifers. Therefore, there is a clear need for reliable and cost-effective technologies for well integrity evaluation and remediation. This paper discusses a workflow for screening, monitoring, and remediation of legacy wells. In a first stage, the screening of the Horda Platform areas suggested the need for integrity investigation for the exploration well 32/4-1 T2, drilled into the Alpha structure of the Smeaheia fault block if CO2 is stored in the structure. Our initial well screening of drilling documentation indicates that the well is not suitable to be reused for CO2 injection and geophysical monitoring is recommended. In a second stage, a numerical representation of the well architecture is built including realistic geological setting. We evaluate the sensitivity of non-invasive low-frequency electromagnetic monitoring to corrosion levels in the casing. Numerical end-member simulations of assuming casing corrosion of different degrees by changing material conductivity are performed. Results comparing different corrosion scenarios with a base case (no corrosion) give an above noise signal at receiver locations enabling to separate the different cases. Comparison of the gained electrical fields at seafloor suggests that well casing corrosion monitoring should be possible. Finally, the electrochemical deposition potential of the Sognefjord Formation water is analyzed, revealing depositional potential for portlandite, which might be useful for cement remediation. We recommend such an analysis for all legacy wells penetrating candidate reservoirs for future CO2 or hydrogen storage.
1 Introduction
In December 2015, policymakers signed the Paris agreement declaring their ambition to keep the global warming below 2°C and pursue effort to limit the increase to 1.5°C. This objective remains the multilateral framework for tackling climate change followed by the EU and Norway, with a long-term strategy targeting zero net-greenhouse gas emissions by 2050. To become a “low emission society,” Norway follows a threefold strategy consisting of: (1) investing in renewable energy sources, (2) lowering fossil energy consumption, and (3) enabling large-scale carbon capture and storage (CCS). Since then, evaluating suitable CO2 storage locations has been of critical importance with many candidates suggested along the Norwegian continental shelf (e.g., Halland et al., 2014; Bergmo et al., 2017). Several studies also describe risk assessment of the entire storage project from pre-injection studies to post-closure phases, stressing the central role of measurement, monitoring, and verification programs to ensure both conformance and containment (e.g., Bourne et al., 2014; Pawar et al., 2015; Dupuy et al., 2021).
Together with geological faults, legacy wells are the main possible leakage paths with well integrity issues being the greatest challenge for storage projects (Bai et al., 2016). Moreover, the origin of most incidences during energy storage projects relate to the access to wells (Landinger et al., 2014). At present, wells are plugged and abandoned along the Norwegian Continental margin following the regulations issued in 2004 (NORSOK, D-010, 2004). Depending on the quality of the plugging and abandonment (P&A) job, old legacy wells can be more prone to gas leakage towards the seafloor. This relates mainly to well component degradation increase with time, and strong regulations on methods and materials were limited in the past (IEA Greenhouse Gas R&D Programme, 2009). Gasda et al. (2004) describe the most probable leakage pathways via abandoned wells including damages of the plug cement in the tubing or outside the well casing at interfaces between casing, cement, and the formation. King and King (2013) statistically analyze well issues in the Norwegian and United Kingdom North Sea and the Gulf of Mexico to conclude that the major causes of well integrity issues are leakage through tubing and cement and at interfaces between cement casing and rock formations. Several recent studies in North Sea (e.g., Vielstädte et al., 2015; Böttner et al., 2020) show that methane emissions from legacy wells are not negligible, suggesting that they must be carefully monitored.
In the future European green energy network, the NCS can play a crucial role for enabling large-scale offshore CO2 or H2 storage. In depleted gas and oil reservoirs, a monitoring strategy for abandoned wells is critical to mitigate the major risks for gas leakage (e.g., Alcalde et al., 2018; Williams et al., 2020). In saline aquifers, large-scale CO2 storage is more feasible and faster to implement in well-known and well-described areas, i.e., extensively explored and drilled areas. The major benefits with using such reservoirs for large-scale CO2 storage include the following: (1) they are well characterized, (2) the reservoir pressure is low due to production, reducing injection pressure buildup-associated risks, (3) infrastructure like wells and pipelines is already in place, and (4) there might be a business value creation through hydrocarbon production (CO2 enhanced oil recovery). The NCS comprises more than 8,000 offshore wells, with more than 6,500 wells in the North Sea alone (Böttner et al., 2020). There is consequently a crucial need for localization, evaluation, characterization, monitoring, and remediation of legacy wells to make large-scale CO2 storage possible. In addition to non-invasive monitoring, cost-effective tools to repair cement damage will be key aspects to de-risk environmental pollution and future subsurface energy storage.
In this work, we will introduce a conceptual desktop workflow guiding the reader from a first evaluation of well integrity, a numerical representation of the well elements, geophysical monitoring, and possible detection of well casing corrosion and finally propose a method to remediate damaged cement. We will demonstrate this on the example of well 32/4-1 T2.
2 Geology, Reservoir, and Caprock Characteristics Along Well 32/4-1 T2
Well 32/4-1 T2 was drilled in 1996 on the Horda Platform in the Northern North Sea, about 5 km east of the Troll oil and gas field. The well is within the Alpha structure of the Smeaheia fault block (Figure 1). The Smeaheia structure is evaluated as a potential location for CO2 storage (Gassnova, 2016) with many recent studies focusing on the structural, reservoir, and caprock characterization of the area (e.g., Dupuy et al., 2018; Mulrooney et al., 2020; Rahman et al., 2020; Fawad et al., 2021; Wu et al., 2021). Published work also studied the interplay between CO2 storage and pressure development in connection with the production of the nearby Troll oil and gas field and possible CO2 migration pathways towards the eastern structural boundaries of the Smeaheia fault block (e.g., Erichsen et al., 2012; Kaufmann and Gasda, 2018; Lothe et al., 2018; Nazarin et al., 2018).
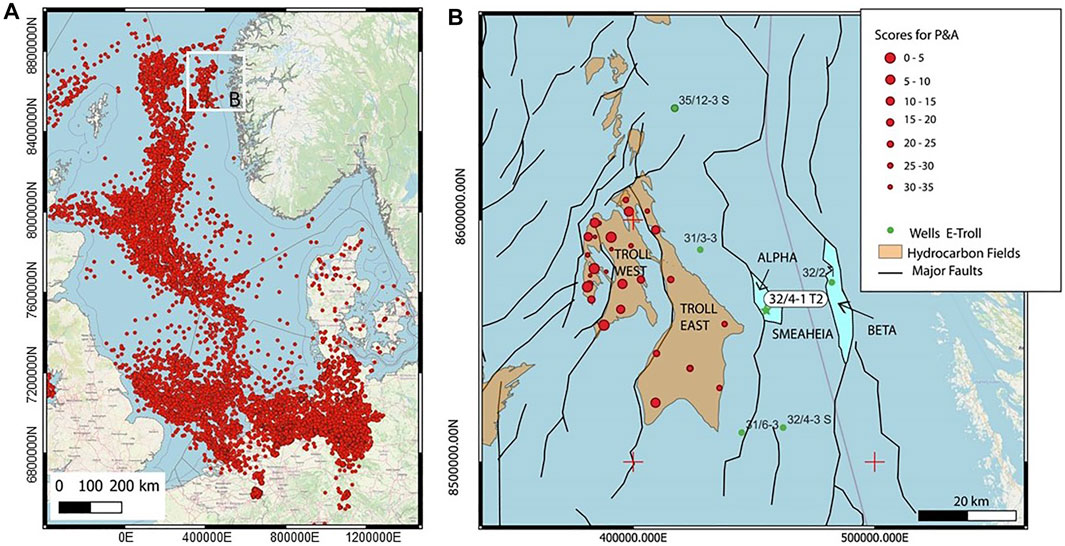
FIGURE 1. (A) Map of the North Sea with well locations. White box indicates the working area. (B) Map of the working area (offshore SW Norway) with well integrity screening results for P&A (red dots) from the Troll oil and gas field (Emmel and Dupuy, 2021). The maps are in a WGS 1984 pseudo mercado projection and are produced using QGIS (QGIS.org, 2022). Major faults are shown, and the location of well 32/4-1 T2 within the alpha structure is highlighted and marked with a green star.
The main reservoir and caprocks on the Norwegian continental shelf were deposited during the Jurassic (Johannesen and Nøttvedt, 2008) when continental rifting between Laurentian and Baltic shield occurred. The eastern continental hinterland of Norway was eroded and delivered the detrital material sourced into a sedimentary basin with low subsidence rates. Within this sedimentation environment, three siliciclastic coastal to shallow marine delta formations developed offshore SW Norway (Stewart et al., 1995; Dreyer et al., 2005; Patruno et al., 2015). These are the Krossfjord (Upper Middle Jurassic, Bathonian), Fensfjord (Upper Middle Jurassic, Callovian), and Sognefjord (Upper Jurassic, Oxfordian to Kimmeridge) formations. All are target reservoirs for CO2 storage in the Smeaheia fault block (Figures 1, 2).
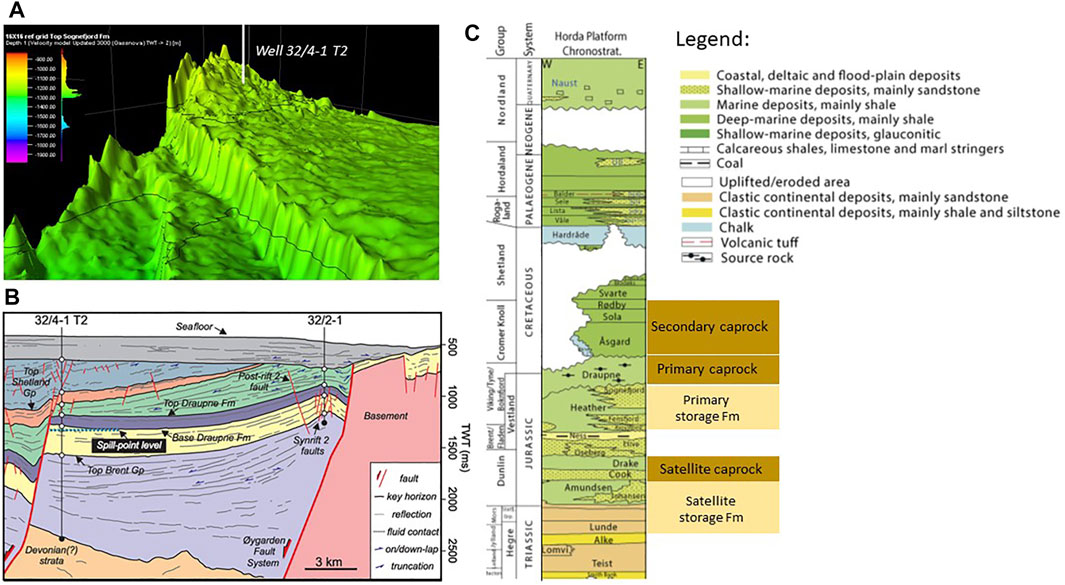
FIGURE 2. (A) Top Sognefjord Formation showing the location of well 31/4-1 T2 (white line) within the Alpha structure. The vertical exaggeration is 20× (B) Interpreted seismic profile with location of well 31/4-1 T2 (from Wu et al., 2021). (C) Stratigraphy at the Horda Platform and indication of primary and secondary caprock and storage units (from Mulrooney et al., 2020 and references therein).
In well 31–2/1 T2, these formations are located between a depth of approximately 1,645 m and 1,238 m (Figure 3). The Krossfjord Formation (thickness: from 47 m) consists of light gray-brown, medium to coarse-grained, well-sorted, occasionally calcite cemented, sandstones. In the lower part, the formation is slightly argillaceous and carbonaceous with minor shale intercalations (Vollset and Dore, 1984). The Fensfjord Formation (thickness: 229 m) is made up of gray-brown, fine to medium, well-sorted sandstones with porosities between 15% and 35% (Johnsen et al., 1995). The Sognefjord Formation (thickness: 68 m) consists of gray-brown, medium to coarse-grained, well-sorted sands and sandstone intercalations (Vollset and Dore, 1984). In the neighboring Troll Field, individual sand bodies have permeabilities ranging from 1 to 20 D. Conventional porosity measurements from the Sognefjord Formation in the target well 32/4-1 T2 range between 17.5% and 36.4%. Density, sonic, and density neutron porosity well log interpretation for all reservoir units range between 8% and 51% (Kinn et al., 1998).
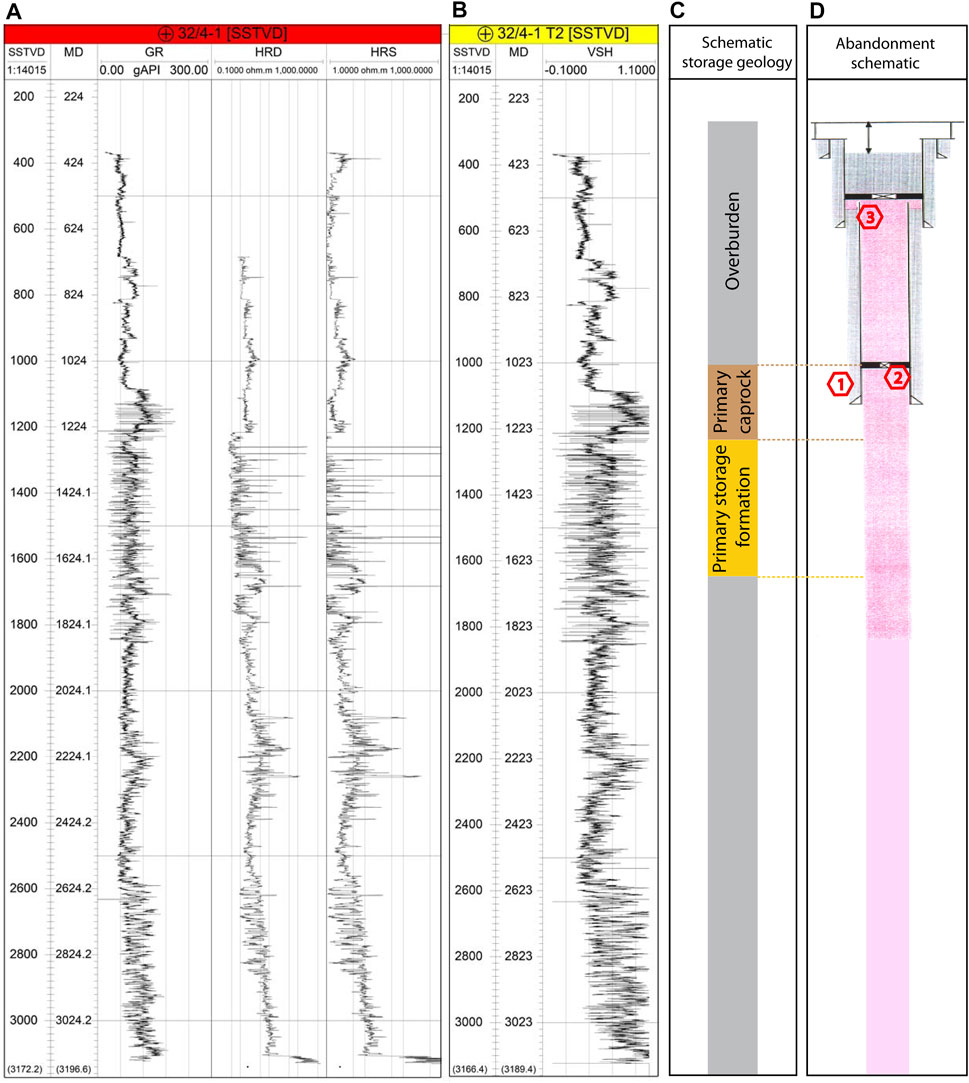
FIGURE 3. Well 32/4-1 T2. (A,B) Available well log data (gamma ray = GR, deep resistivity = HRD, shallow resistivity = HRS, and shale content = VSH), (C) a schematic description of the storage unit, and (D) abandonment schematic for well 32/4-1 T2. Well log data are used to parameterize the geomodel. In (C), the Krossfjord, Fensfjord, and Sognefjord formations and the interlayering Heather Formation relate to the target CO2 storage reservoir unit. The caprock consists of the top of the Heather Formation and Draupne Formation. In the abandonment plan (D), the gray shaded areas are volumes filled with cement, black thin lines indicate well casing, thick black lines are retainers, and the purple areas indicate drilling mud left in the open hole. Only one plug is installed, and primary and secondary reservoir plugs are missing. Major risks for CO2 leaking into the overburden are indicated by red numbers; 1: cement degradation; 2: mechanical plug and casing corrosion; 3: casing corrosion and cement degradation.
The primary caprock (Figure 2C) is the Upper Jurassic/Lower Cretaceous syn-rift Draupne Formation (Figure 1). It consists of dark gray-brownish to black, carbonaceous, homogeneous marine claystones deposited as hemipelagic and pelagic suspension fall-out. In well 32/4-1 T2, the formation occurs at a depth between 1,216 m and 1,109 m with a thickness of 107 m (Figure 2). Based on seven wells analyzed in the Troll/Smeaheia area, Erichsen et al. (2012) report porosities ranging from 9% to 18% and permeabilities varying from 0.001 mD to nD scale (6–70 nD). Several secondary caprock units are discussed in the Cromer Knoll group (Mulrooney et al., 2020) including, in some areas, the siltstones of the Heather Formation (Lothe et al., 2018).
The target CO2 storage reservoir is the Alpha structure (Figures 1, 2). Figure 2A shows the three-way closure of the Alpha structure at 1.2 km depth. The Vette Fault Zone manifests the western border of the structure (Figures 1A, 2).
3 Data and Methods
The data of exploration well 32/4-1 T2 was released by the end of 1998. It can be downloaded from the factpages of the Norwegian Petroleum Directorate (https://factpages.npd.no/) and SINTEFs CO2 storage data share platform (https://co2datashare.org/dataset/smeaheia-dataset). The details of the well geometry are given in Table 1.
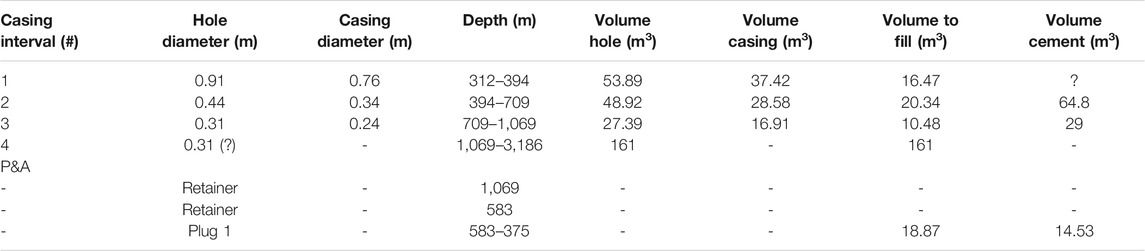
TABLE 1. Dimensions of well architecture and amounts of used cement obtained from https://factpages.npd.no/en/wellbore/PageView/Exploration/All/2918, well completion report (Kinn et al., 1998), and Erichsen et al. (2012). The volumes of the hole/casing/to fill are calculated for the different casing intervals assuming volumes for ideal cylinder. Only one cement plug is installed (Figure 3). During abandonment, the casing intervals 1 and 2 are cut at 338 m and interval 3 is cut at 622 m.
3.1 Screening and Evaluation of Well Integrity
The well integrity evaluation is based on the methods described in Pawar and van der Valk (2020) and Emmel and Dupuy (2021). Pawar and van der Valk (2020) developed the decision-tree based software REX-CO2 to evaluate the re-use of wells for CO2 storage. The output is based on answers to 55 questions subdivided into five main topics: (1) Out of zone injection; (2) Structural integrity; (3) Well integrity primary barrier; (4) Well integrity secondary barrier; and (5) Material compatibility. The evaluation of the answers results in a recommendation for severe, moderate, minor required remediation or critical information missing.
The second approach uses the concept of the well screening suggested by Emmel and Dupuy (2021), which consists in analyzing the documentation of a drilling operator towards the authorities. Twelve criteria are evaluated to provide a final score, with more focus on volumetric relationships for all cement jobs. The final score helps to search and define monitoring cases for legacy wells.
3.2 Numerical Gridding of Well 32/4-1 T2
The hole and casing dimensions, the well log data, and the lithological observations of well 32/4-1 T2 (Table 1; Figure 3) are used to build a numerical model for electromagnetic (EM) modeling. The simulations are performed with the COMSOL Multiphysics® software. The cylindrical well elements, radially layered to accommodate different wellbore and casing sizes, are enclosed in a large cylindrical domain with a radius larger than 500 m. The whole geometry is also layered, following the geometrical changes in the well elements, with the inclusion of a water layer and an air layer at the top (Figure 4A). Furthermore, the modeling domain is surrounded by absorbing boundary conditions to simulate infinitely large systems and avoid the generation of unwanted reflections due to the use of a limited bounded simulation domain. Taking advantage of field symmetry, simulations of radial and tangential polarizations allow to reduce the computational requirements by half. The model is meshed using a triangular mesh on the seafloor surface (Figure 4C), with element size adapted to provide sufficient local refinements in the proximity of the well, surrounded by a mapped mesh on the corresponding absorbing boundary. The resulting surface mesh is then swept along the vertical direction (Figure 4C).
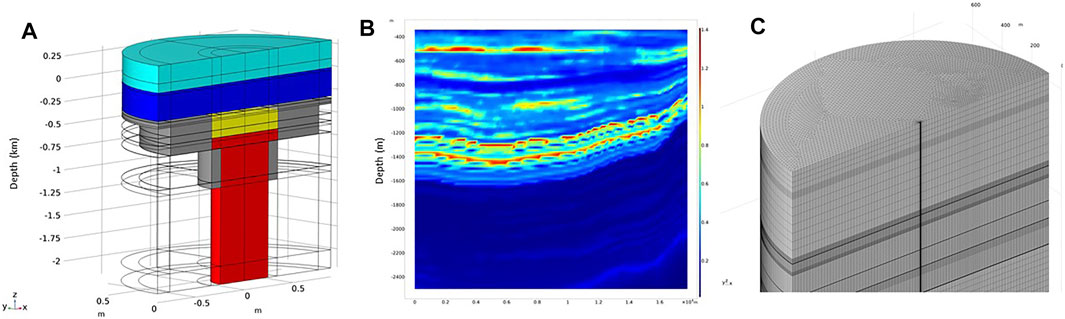
FIGURE 4. (A) Zoom in the well structure including air (cyan), water (blue), cement (gray), plugs (yellow), and the well borehole (red). The horizontal axis is not to scale. (B) Background (formation) resistivity model (in
3.3 Controlled-Source Electromagnetic Modeling
Our strategy consists in evaluating whether the controlled source electromagnetic (CSEM) monitoring method can be used to detect potential integrity issues due to casing corrosion. Being able to evaluate well elements (retainer and casing) integrity through time can be crucial for containment verification. Early leakage detection can also be very important for the implementation of simple and cost-effective remediation actions.
CSEM is a geophysical technique aiming mainly at mapping the electrical resistivity/conductivity of the subsurface. The utility of marine 3D CSEM in hydrocarbon exploration is firmly established (Constable, 2010) and the potential of the method in many other applications including CO2 storage and environmental monitoring is an active field of research. EM modeling is based on the Maxwell equations describing the relation between electrical and magnetic fields and their behavior with varying subsurface properties (conductivity, electrical permittivity, and permeability), and resulting from the combination of Faraday’s law, Ampere’s law, and Ohm’s law with Gauss laws. Solving Maxwell equations can be performed in frequency or time domain using, e.g., finite element, finite difference, or finite volume techniques (Streich, 2009).
In our study, we use the COMSOL software based on the finite element method (FEM) for 2.5D EM modeling in the frequency-space domain. The governing equation can be written as:
Where E is the electrical field (V/m), σ is the medium electrical conductivity (S/m),
3.4 Electrochemical Enhanced Mineral Deposition
The applied electrochemically enhanced mineral precipitation method (adapted from Edvardsen et al., 2021) comprises four working steps: (1) numerical modeling to understand the potential of hydrogen (pH) dependencies of the formation water, (2) preparation of a synthetic formation water, (3) applying an electrical field to the formation water, and (4) analysis of the precipitated mineral phases. To predict the impact of pH changes close to the electrodes on the local saturation status of the Sognefjord formation water at reservoir conditions, we used the software PHREEQC with the phreeqc.dat thermodynamic data file (Parkhurst and Appelo, 2013). This data file covers the temperature–pressure range from <200°C to <1 kbar (Lu et al., 2022). PHREEQC is a general-purpose geochemical software based on the law of mass action. The value of interest is the saturation index (SI)., which is defined as the ratio between the ion activity product in non-equilibrium and the thermodynamic solubility product. The solution is oversaturated if the SI is larger than 0 and the specific mineral phase might precipitate. The solution is undersaturated with a specific phase if SI is less than 0 and the ions necessary to build mineral phases stay in solution (e.g., Metoki et al., 2016).
1) The chemical composition of the Sognefjord formation water is obtained from two water samples taken at depths between 1,247 m and 1,367 m (Kinn et al., 1998). By mixing the salts listed in Table 2 with deionized water for at least 1 h, we produced a simplified synthetic Sognefjord formation water. The simplification relies on neglecting Ba2+ and Sr2+ components in order to comply with laboratory safety regulations.
2) To enhance electrochemical deposition, we applied a potential between two graphite electrodes immersed in 200 ml of the synthetic Sognefjord formation water. To avoid corrosion of the anode associated with the release of iron, we choose graphite, which is stable under anodic polarization, as electrode material. The graphite tubes (length, 3 cm; outer diameter, 1 cm; inner diameter of hole, 4 mm) were wrapped with an insulating tape to have a better control of electrode surface area in contact with the formation water (half size of the tube, 1.5 cm). Cathode and anode were placed with a distance of ca. 4 cm, and the potential was set to 5 V. Experiments were conducted at 22.6°C and the electrodes were polarized for 30 min with a GW Laboratory DC Power Supply (model GPS-3030). After the exposure, the electrodes were flushed with deionized water to remove excess of brine and prevent excessive crystallization of the remaining salt during the drying process. The weight of the graphite tubes was measured before and after the experiment with a Mettler AT250 precision weight.
3) Mineralogical composition of the deposit on the carbon surface is determined by powder x-ray diffraction (XRD) method. The instrument used to perform XRD is the Bruker D8 Advance (with DAVINCI design) at Material and Chemistry Department, NTNU.
TABLE 2. Ionic composition of real and synthetic Sognefjord formation water (fw) used for the laboratory and PHREEQC models. Salts (NaCl: 43.95 g; MgCl2·6H2O: 6.13 g; KCl: 19.92 g CaCl2·2H2O: 15.63 g; BrCl3: 0.44 g, LiCl: 0.03 g) were mixed with deionized water to make up a total of 1 L solution. Ba2+ and Sr− were not used in the laboratory for safety reasons. The composition of the “real” Sognefjord formation water (fw) is from Kinn et al. (1998). The conductivity of the synthetic formation water is 111.3 mS/cm and a resistivity of 898.47 Ohm m.
The mineral deposit was scratched from the carbon surface, dried, and ground gently into silt-sized particles. A Si-cavity sample holder was used to scan the sample between 2 and 55° (2θ) using a Cu-Kα source (giving x-rays of wavelength 1.54 Å) and LYNXEYE_XE (1D mode) detector for 45 min of exposure time. The XRD pattern was analyzed using the DIFFRAC. EVA v.5.2 software. Only crystalline phases were identified from the XRD pattern.
4 Results
4.1 Well Integrity Evaluation
The well integrity evaluation is based on the available well completion report (Kinn et al., 1998) and is supported by integrating secondary information given in Erichsen et al. (2012). For all cement jobs, ordinary Portland G cement is used, and the casing material is carbon steel plus elastomers with grades X-52, D95HC and N-80.
4.1.1 REX-CO2 Tool
The detailed answers to the questions (and reasons) from the REX-CO2 tool (Pawar and van der Valk, 2020) are given in Supplementary Table S1. In general, many answers (unknown) reflect the limited knowledge about the status of the well, and the limited available documentation of the well geometry. The well status given by the Norwegian Petroleum Directorate is P&A, meaning “the well is plugged and abandoned, and cannot be re-entered for further use. The wellhead is removed or else made unavailable for further well operations.” The REX-CO2 tool (Pawar and van der Valk, 2020) requires test intervals in the last 12 months; thus, all questions regarding recent inspections and re-using of well equipment are answered with “No.” In total, 47 questions are answered and evaluated (Supplementary Table S1), resulting in the recommendation “severe remediation required” for all subcategories (Figure 5A).
FIGURE 5. Results of 32/4-1 T2 well screening and evaluation. (A) The screenshots from the REX-CO2 tool (Pawar and van der Valk, 2020) show the final evaluation and a recommendation for severe remediation. (B) The screening method from Emmel and Dupuy (2021) results in a final score of seven (sc_total), suggesting a more detailed inspection of data from well 31/2-4.
4.1.2 Initial Screening Results
The evaluation scheme from Emmel and Dupuy (2021) based on twelve individual scores results in a total score, sc_total, of seven (Figure 5B). The status of the well is classified by the Norwegian Petroleum Directorate (NPD) as P&A resulting in a sc_status score of 3. The sc_entryYear score is 1 because the well was drilled in 1996, 4 years after the first well barrier schematics were introduced by the Norwegian oil and gas industry. According to NPD, the plugging was not reported to the authorities resulting in a score of 0 for both sc_pluggged_da and sc_plugged_ab. In the well completion report (Kinn et al., 1998), most of the required information is given including the well abandonment schematic. However, some details are missing, e.g., the used volumes of cement for the first casing interval and the detailed results of the leak-off test, resulting in a sc_report score of 2. For the casing interval 1, Kinn et al. (1998) reports that “200% excess cement was used”, but for intervals 2 and 3, no detailed cement volumes are given. The top of the casing cement of interval 1 was tagged 2–3 m below the sea level, indicating that enough cement was used. Cement tagging is only reported for casing interval 1 resulting in a sc_cem_job of 3 and a sc_cs_ver of 1. A sc_plug_job score of −5 is given because only an environmental plug is in place but reported cement volumes are not sufficient to build the anticipated plug length of 208 m. The absence of an abandonment and a reservoir plug are noticed. It is fair to mention that during the drilling of the exploration well, neither oil nor gas was found in the Sognefjord, Fensfjord, and Krossfjord formations and thus those formations were not classified as reservoir formations. However, for the purpose of CO2 storage, a reservoir plug is mandatory. The score for plug length is 1 because two necessary plugs are missing, and the environmental plug has a sufficient thickness (>100 m). Tests for the quality of the environmental plug and milling of the casing are not reported, resulting in a score of 0 for sc_pl_ver and sc_mill. There are no secondary indications for leakage along the well path, but tests are not performed (sc_ind_leak =1).
4.2 Geophysical Modeling
The digital model of the well 31/2-4 T2 is populated with conductivity and relative permittivity properties considered to be independent from the frequency of EM radiation (Table 3). The formation properties are assumed isotropic, but vary with depth and along the symmetry plane in Figure 4. We considered realistic rock formation resistivities (Figure 4B) based on baseline geophysical characterization performed at Smeaheia (Gehrmann et al., 2021). The modeling domain has a diameter of 1.3 km and is 2 km deep.
TABLE 3. Properties of conductivity and relative electrical permittivity of the main elements of the well.
A transmitter antenna is implemented as a perfect dipole of arbitrary length that can be placed anywhere in the simulation domain with any orientation. A 40-m-long horizontal dipole emitter located 30 m below the sea surface at a radial distance of 300 m from the wellbore is considered with a frequency corresponding to 4 Hz.
Six different model realizations reflect varying corrosion levels in the well casing. The sensitivity of the recorded signals is then compared to a reference case. The reference case is a model representing an intact well without corroded steel casing (i.e., with a constant conductivity of 4·106 S/m). In our case, the severity of corrosion is reflected in a locally reduced conductivity that can result in a breakage in the most severe case. To assess the effect of corrosion on the electrical field at the surface, we consider changes of conductivities from 4 × 10⁵ S/m down to 4 S/m with one order of magnitude conductivity decrease in each case. These changes are implemented along a 10-m-long section of the casing located at 150 m depth. In each simulated case, we compute the resulting electrical and magnetic fields in the simulation domain and analyze the numerical solution at the seafloor.
Figure 6A shows the resulting horizontal component of the electrical field at the seafloor for the reference case. The low-frequency current applied to the transmitter is producing a current propagating along the well, mainly along the steel casing, and generating surface electrical fields that can be recorded at the seafloor. Figure 6B displays a vertical cross-section, crossing the well elements, and shows the strong current propagating along steel casing until 1,200 m deep.
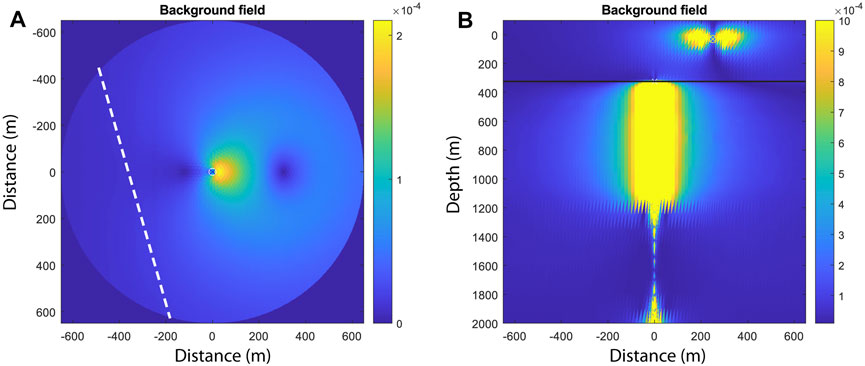
FIGURE 6. (A) Amplitude of the x horizontal component of the modeled electrical field [A/m] at the seafloor for the reference case (conductivity = 4 × 10⁶ S/m). The plot represents a horizontal cross-section at the seafloor, i.e., the horizontal and vertical axis correspond to x- and y-axis, respectively. (B) Amplitude of the x horizontal component of the modeled electrical field [A/m] along the plane corresponding to y = 0 (vertical cross-section). The black line corresponds to the seafloor.
Figure 7 shows the derivative of the field with respect to the conductivity change between two consecutives cases (corresponding to one order of magnitude variation in conductivity in our case) for the horizontal cross-section at the seafloor. It relates to the sensitivity between two consecutive models where casing is corroded incrementally following:
where
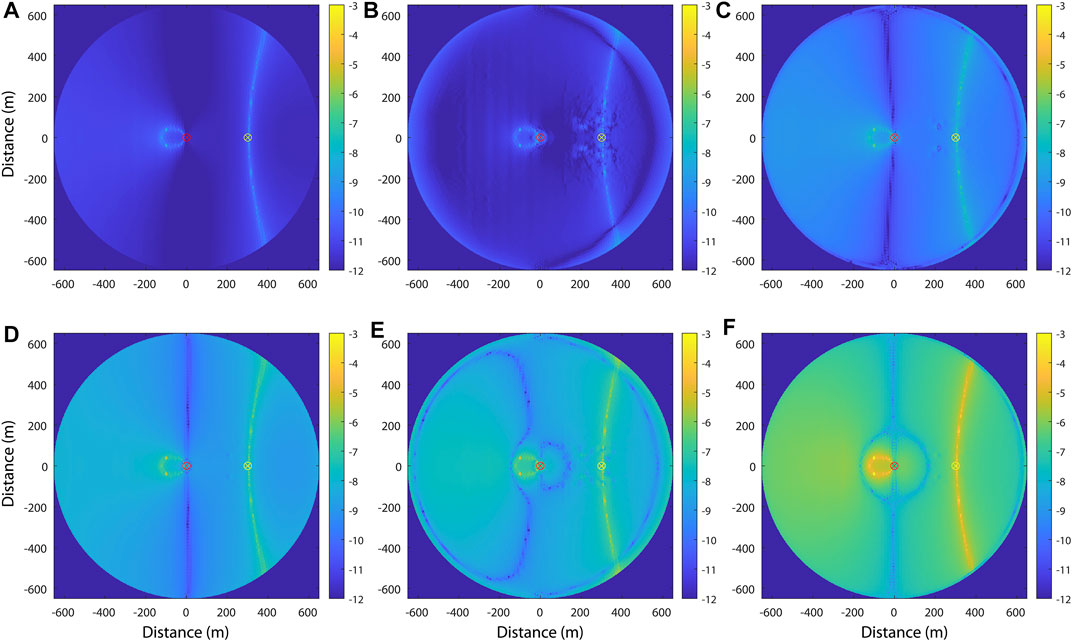
FIGURE 7. Absolute value of the derivative of the electrical field (x-component) with respect to conductivity change for different corrosion levels. The plots correspond to the result at the seafloor. Horizontal and vertical axis correspond to x- and y-axis, respectively. The well is at the center of the plots, while the source is located at y = 0 m and x = 300 m, marked with a yellow dot. The plots are derived using Eq. 2 with conductivity levels of 4 × 10⁵ S/m (A), 4 × 10⁴ S/m (B), 4 × 10³ S/m (C), 4 × 10² S/m (D), 4 S/m (E), and 40 S/m (F), respectively. All the plots are using logarithmic scale.
In these cross-sections at the seafloor, we see that the differences are increasing with the level of corrosion (conductivity from 4 × 10⁶ S/m to 4 S/m). Cases with one and two orders of magnitude conductivity differences (Figures 7A,B, conductivity = 4 × 10⁵ S/m and 4 × 10⁴ S/m, respectively) are showing similar results, i.e., a relative difference in the order of 10–8 V/S around the source and at the opposite side of the well. The arc pattern on the right side of the plots is related to the source signature. In Figure 7C (conductivity = 4 × 10³ S/m), the observed patterns are similar than with less corrosion, but the amplitudes are stronger (in the order of 10–6 V/S). When we reach stronger corrosion (conductivity = 4 × 10² S/m), patterns are changing in addition to the amplitude, and we observe changes along a perpendicular line with respect to the source/well alignment in Figure 7D. In Figures 7E,F (conductivity = 40 S/m and 4 S/m, respectively), the derived differences are in the order of 10–3 with lobes and concentric circles around the well.
We consider an arbitrary 2D cross-section (white dashed line in Figure 6A) and display the corresponding electrical field for the background case and for the cases with varying corrosion levels. The results displayed in Figure 8A highlight that the fields are overlapping almost perfectly and that the differences are very small compared to the reference field. Figure 8B shows the same results along the cutline plotted in a different way. To better highlight the sensitivity of the derived electric field to conductivity changes, we consider the derivative of the field with respect to the conductivity change between two consecutives cases (corresponding to one order of magnitude variation in conductivity in our case). The results clearly highlight the increased sensitivity of the measured amplitude of the electrical field to the varying level of corrosion. Similar results are observed for the y horizontal component.
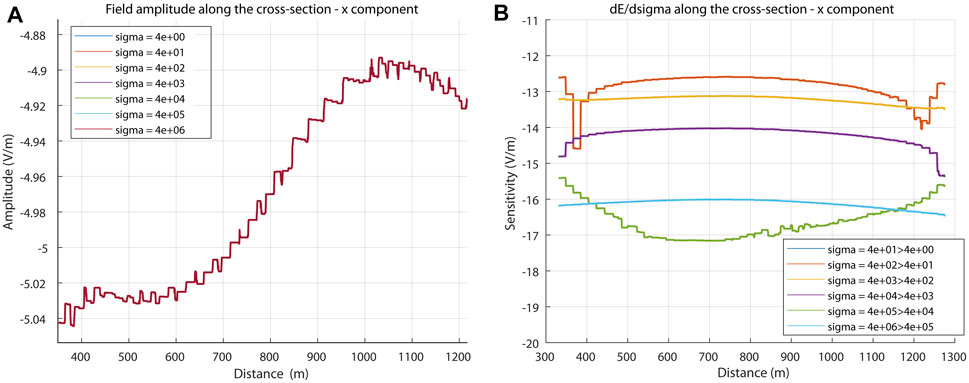
FIGURE 8. (A) Electrical field amplitude (x-component) along the cross-section (white dashed line in Figure 6A) for the different corrosion levels shown in Figure 7. (B) Derivative of the electrical field (x-component) with respect to conductivity change along the cutline for different corrosion levels. h =10 m corresponds to the corroded section and sigma corresponds to the conductivity of corroded casing. Logarithmic scale is used for the vertical axis.
4.3 Electrochemical Enhanced Mineral Deposition
Three different laboratory setups are tested to simulate different conditions related to different cathode and anode proportions and possible brine mixing in the reservoir. In the experiments (Exp) 1 and 2, we used a graphite rod with a diameter of 2.8 mm as anode and a graphite tube with a diameter of 1.0 cm as cathode. In Exp 3, the same tube size is used for both cathode and anode (Figure 9). Exp 1 and Exp 2 also correspond to cases where the formation water is stirred and not stirred, respectively. During all experiments, the formation water near the cathode changes from clear to a milky colored solution. Hydrogen and oxygen gas are produced at the cathode and anode, respectively, due to the following reactions:
A white layer is deposited on the cathode surfaces, leading to weight increase of the cathodic graphite tubes (Figures 9B–D). The formation water temperature increased slightly by 0.2°C and average pH of the formation water increased significantly from 6.15 to 8.2 (Table 4).
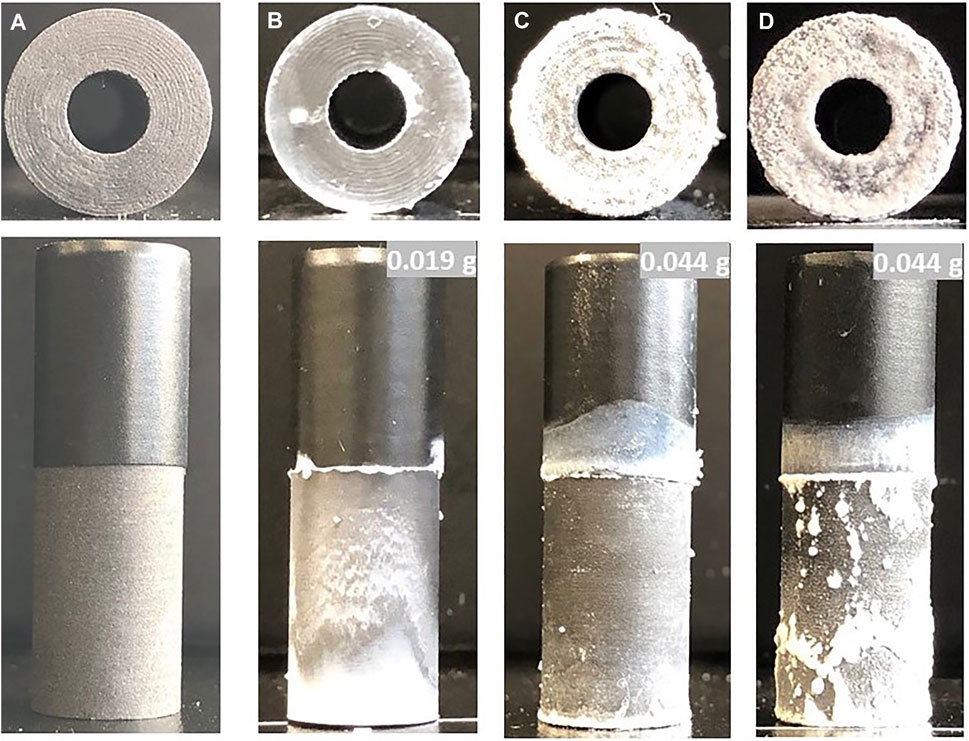
FIGURE 9. Photos of cathodic graphite tubes before (A) and after (B–D) exposing them for 30 min of polarization (5 V) to synthetic Sognefjord formation water at room temperature (22.3°C). The cathode graphite tubes B (solution was stirred) and C (solution was not stirred) are covered with white layers of minerals. In both experiments, the anode was a graphite tube with a diameter of 2.8 mm. In (D), we used the same graphite tube as anode. The graphite tube has a diameter of 1 cm and a length of 3 cm. The numbers shown in the top right corner indicate the weight increase in grams after the experiment.
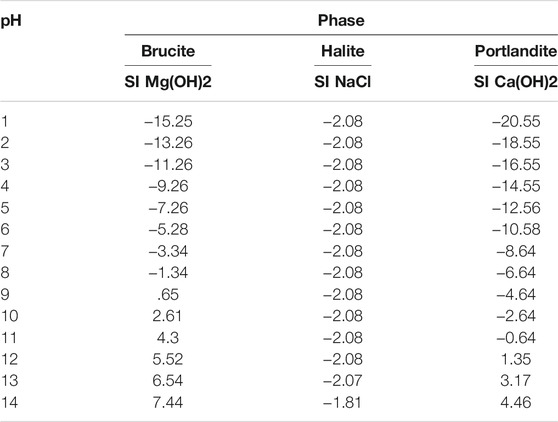
TABLE 4. PHREEQC modeling results showing the SI for different mineral phases. The pH of the Sognefjord formation water was changed from 1 to 14 at a temperature of 50°C and a pressure of 130 atm.
Electrochemical deposition is enhanced by local pH changes close to the cathode electrode (the graphite tube in our cases). During water electrolysis, the pH close to the cathode becomes alkaline due to the generation of hydroxide ions and reduction of hydrogen. The pH change in the formation water shifts the equilibrium towards an unstable state while pH-sensitive mineral phases precipitate at high pH values. The PHREEQC modeling results of the SI give indications about the expected mineral depositions at reservoir conditions. In the Sognefjord formation, water brucite, Mg(OH)2, and portlandite Ca(OH)2 are expected to precipitate at pH values higher than 9 and >12, respectively (Table 4). Using XRD spectrum interpretation of the precipitated phases at the cathode (Figure 7D) portlandite, minor traces of calcite are identified but brucite is absent (Figure 10).
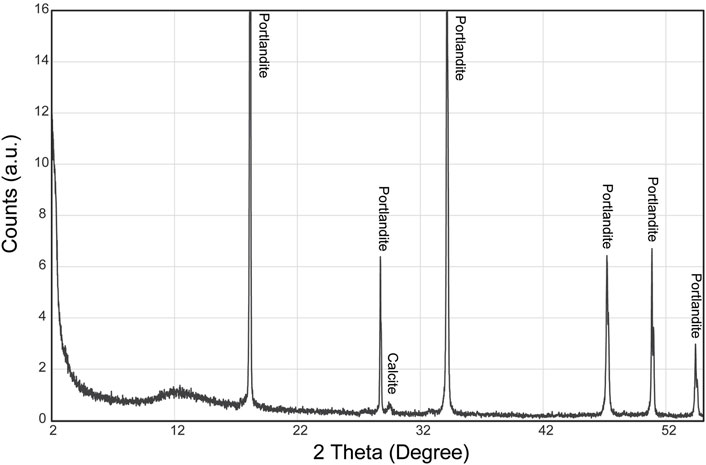
FIGURE 10. XRD pattern of the precipitate. Portlandite is identified as a major phase present in the precipitate and only a small peak from calcite is present at 29.5°.
5 Discussion
Offshore geological storage of CO2 and energy (e.g., in form of hydrogen) are essential to provide sustainable growth with net-zero emissions in the second half of the century (e.g., Anwar et al., 2018; Hassanpouryouzband et al., 2021). Thereby, integrity of new drilled, old wells and the monitoring of integrity will be a key technical component for successful implementation of such storage sites (IEA Greenhouse Gas R&D Programme, 2009).
The decommissioning of gas and oil platforms and the P&A of legacy wells are costly operations for energy companies trying to perform them in a cost-effective way following the prevailing national regulations. These regulations vary significantly between countries and through time (IEA Greenhouse Gas R&D Programme, 2009; Samand, 2017; Osundare et al., 2018). With the evolving need for CO2 and energy storage, new challenges arise for P&A of legacy wells. Most existing legacy wells were not designed, completed, and/or abandoned considering future storage purposes. CO2 or CO2 mixed with reservoir brine are corrosive fluids, and chemical degradation of casing steel and well cement can occur. For example, if the Sognefjord formation water is saturated with CO2, the pH value might change from 6.15 (measured at laboratory conditions) to approximately 3.3 (modeled with PHREEQC).
Mechanical cement degradation, which alters the porosity and permeability, and corrosion of the casing steel can create pathways along the cement/casing boundary and potentially allow fluids to enter the inner casing areas (Gasda et al., 2004; IEA Greenhouse Gas R&D Programme, 2009). Thus, several aspects must be critically evaluated including, e.g., storage in reservoirs not classified as inflow layers, changes of geochemical and pressure conditions in the subsurface due to injection of CO2 or other gases, and mechanical damage of old wells due to tectonic or micro-tectonic activities during their lifetime.
Major leakage risks defined by Gasda et al. (2004) and well 31/4-2 T2-specific ones described in the sections before mainly relate to damages of the casing cement, corrosion of the mechanical retainer located at a depth of 1,069 m, and corrosion of the well casing. The well evaluation using the REX-CO2 tool requires “severe remediation” for all subcategories, and low well screening results clearly indicate that well 31/4-2 T2 is not suitable to be re-used as a CO2 injection well and that further monitoring is required. This agrees with the risk analysis in Erichsen et al. (2012). They identified well 32/4-1 T2 as a major risk for CO2 storage, because it was not plugged in a satisfactory way. Figure 3D shows the abandonment schematic for well 32/4-1 T2 with only one 208-m-thick cemented plug installed in the uppermost part of the well. The purple area represents a hole that is filled with a KCl/polymer drilling mud. Such P&A is not in agreement with the NORSOK D-10 standard (2004), which requires cement plugs at all possible inflow layers. Assuming CO2 is stored in the Alpha structure, the well is a potential leaking path for the stored CO2. Possible CO2 leaking pathways are indicated by numbers in Figure 3D. The long-term safety of a potential storage unit in the Alpha structure is therefore associated with high uncertainties of the integrity of the mechanical retainer (at 1,069 m depth, pressure tested to 130 bar), the well casing (possible corrosion), and the outer casing cement quality on top of the reservoir unit (1,137–1,069 m) due to cement degradation. Dynamic reservoir models and measured pore pressure at well location 32/4-3S (south of the Alpha structure at depth of 1,100–1,500 m) suggest pressures varying between 90 and 145 bar (Lothe et al., 2021). The following leakage scenario is reasonable: the mechanical retainer corrodes and cannot withstand the reservoir pressure after injection of CO2, and the CO2 migrates along the well path to a depth of 583 m. If the well cement is partly degraded or generally of low quality, no barrier can prevent CO2 from migrating to surface conditions. Thus, we will focus the discussion on detection of casing corrosion and possible remediation of cement damages.
5.1 Well Cement
For all cement filling jobs, ordinary Portland G cement was used (Erichsen et al., 2012). For casing interval 1, cement volumes are not reported but the returning cement was tagged. For the casing intervals 2 and 3, the cement quantities are sufficient to fill the volume between the drilled hole and the casing. However, for none of the intervals was a cement bonding log performed. Thus, the initial cement/casing bonding is not verified. To test the cement debonding with the casing or the formation, we run simulations for cement integrity prediction using the REX-CO2 tool (Pawar and van der Valk, 2020). As input parameters, we used a CO2 injection temperature of 15°C, a caprock depth of 709 m (maximum depth casing interval 2), and 1,216 m (maximum depth casing interval 3), an average cement stiffness with normal cohesion, and a low shrinkage rate of 0.2%. The results indicate that the major debonding risk is between cement and casing associated with the development of 30–80 µm micro-annuli (Figure 11). In general, all changes in downhole conditions, e.g., pressure, temperature, and vertical and horizontal stress changes can harm the well integrity if the cement is not flexible enough to react to these changes. In a long-term perspective, such changes can be imposed by tectonic movements or local seismic events or by fluid flow related to pressure changes caused by man-made changes in the underground hydrological conditions. In the case of CO2 storage, the fate of wellbore cement exposed to a CO2-rich phase (aqueous, gas, and liquid) is essential, especially in well 31/4-1 T2 where a hole filled with drilling mud in the depth interval 1,069–3,186 m would provide an excellent migration path to shallower vertical depths for the injected CO2. In such a scenario, CO2 would be in contact with Portland G cement outside the well casing at a depth of 1,069 m and, if the mechanical retainers are corroded, with plug cement at 583 m. In general, class G cement is very vulnerable to chemical degradation and may lose its durability once exposed to CO2 (Tiong et al., 2019). Wellbore cement with high pozzolan content (e.g., 65 vol%) is rapidly altered by CO2 and H2S (Zhang et al., 2013). Thus, intervention methods to remediate cement damages are desirable.
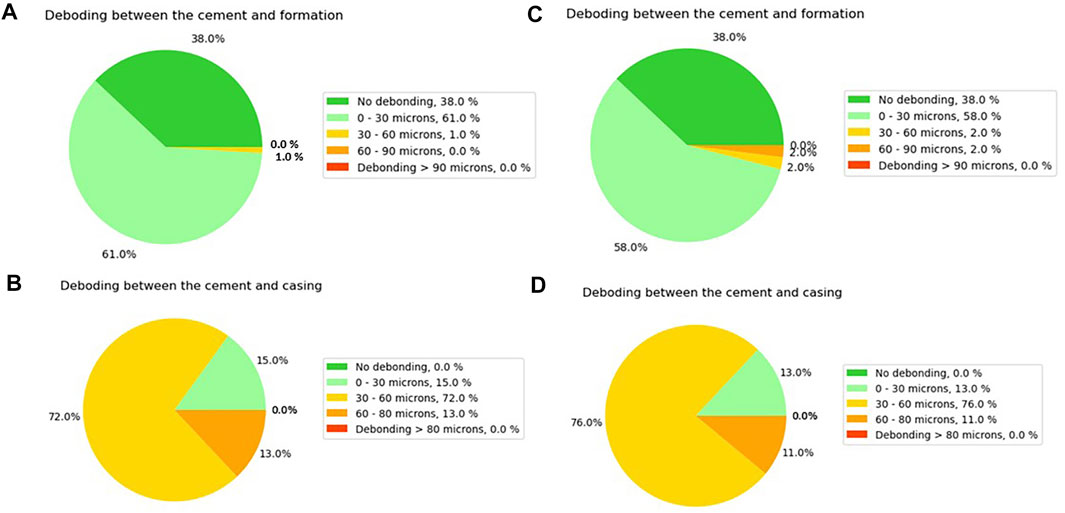
FIGURE 11. Results of cement integrity prediction for (A) debonding between the cement and the formation and (B) debonding between the cement and casing for a depth of 709 m. (C) Debonding between the cement and the formation and (D) debonding between the cement and casing for a depth of 1,206 m.
5.2 Cement Remediation Using Electrochemical Enhanced Mineral Deposition
In all three laboratory experiments, mineral phases precipitate on the cathode surface (Figures 7B–D). XRD results identify portlandite as deposited mineral phase (Figure 10), and numerical modeling shows that the formation water is over-saturated with the portlandite and brucite phase at pH values higher than 9 and 12 (at reservoir conditions). Alkaline conditions for the formation water are induced in the vicinity of electrode during cathodic polarization due to production of hydroxide ions; see Eq. 2 (e.g., Sheng et al., 2020). Thereby, the pH values might follow the strength of the electrical field (Saulis et al., 2005). The main reactions describing the phase changes are related to the electrochemical splitting of water and reaction of Ca2+ (Eq. 5) and Mg2+ (Eq. 6) at the cathode (high pH values):
Brucite was modeled as oversaturated at pH > 9 (Table 4) but was not indicated by XRD from the cathode precipitate (Figure 10). This could relate to the relative low amount of Mg+ ions relative to Ca2+ (Table 2) or the current density values favoring portlandite precipitation over brucite (Zeppenfeld, 2011). However, the deposition of brucite at reservoir conditions cannot be excluded.
Cathodic polarization of conductive surfaces in contact with formation water can lead to enhanced precipitation of minerals like, e.g., calcium carbonate enhanced at high pH conditions (Edvardsen et al., 2020). Our laboratory and geochemical modeling results suggest the same observations with the Sognefjord formation water. It would be useful if the electrodeposition method could be utilized for well cement remediation to fill micro-structures and gaps related to debonding along the casing/cement interface in well 32/4-1 T2. The experiments showed a thin portlandite sheath deposited around the graphite tubes, and this might also happen around a steel casing where it is in contact with formation water. Utilization of electrochemical deposition is highly dependent on the formation fluid. The brine needs to contain pH sensitive scaling ions like, e.g., Ca2+, Mg2+, and carbonate and sulfate ions, which are common ions present in most North Sea formation waters (Warren et al., 1994). Although encouraging, our lab-scale results are not sufficient to evaluate the applicability of the method for P&A in a real case. It is likely that gas evolution and communication between the electrodes may limit applicability of the method. A field scale experiment would be the next step for this work.
5.3 Corrosion of Well Casing and Detection
Corrosion is a primary reason leading to failures of various industry facilities, and it has been identified as one of the primary mechanisms causing failures of oil/gas transmission pipelines in soil (Yang et al., 2017). Conventional well casing integrity evaluation using logging tools typically reports corrosion in large sections where the casing is exposed to acidic injected or produced fluids (e.g., with brine, CO2, or H2S). In the context of CO2 storage, many laboratory studies confirmed the severity of corrosion issues when the casing is exposed to CO2 (IEA Greenhouse Gas R&D Programme, 2009), mainly involving the corrosion of iron metals under the influence of dissolved hydrogen ions. As mentioned above, the Sognefjord formation water will obtain a pH change from 6.15 to 3.3 when saturated with CO2, and steel corrosion might increase with decreasing pH (e.g., Sk et al., 2017). If acidic water migrates through the well path to the upper levels below the cement plug, it could cause severe corrosion in the well casing. The presented modeling results (Figure 7) suggest that there is a potential in using surface electromagnetic measurements to screen offshore P&A wells and infer information about casing integrity. The observed sensitivity to corrosion levels is above the numerical noise (Figure 8). It is however important to further evaluate this sensitivity versus the location and the extent of the corroded sections. The main limitation of the CSEM monitoring technique is related to penetration depth, which is strongly related to source frequency. One solution to get better penetration is to use the casing as an antenna, i.e., inject the current directly in the casing. It is however difficult to implement when wellheads are cut. In a real application geological uncertainty, unknown depths of well integrity issues will add to the existing challenges for quantifying corrosion levels with non-invasive monitoring technologies corrosion.
5.4 Other Geophysical Monitoring Techniques
Seismic surveys are expected to be an additional tool for reservoir monitoring integrity. Shallow seismic surveys can help identify well deformation (e.g., due to subsidence or heave of seafloor). Guided waves might also propagate deeper in the formations and give valuable information on the cement quality and potential damages (Sidler et al., 2014; Wehner et al., 2021). To ease the implementation of recording seismic data, distributed acoustic sensing using optical fibers left in place when the well is P&A’ed might be a solution for future wells to be P&A. It will help efficiently monitor the integrity of cement and cement plugs all the way to the reservoir in a cost-efficient way.
5.5 Other P&A Remediation Techniques
The discussed P&A method using electrochemical enhanced mineral deposition is still in the experimental phase but the laboratory and modeling experiments shown indicate practicability. Traditionally, the wells are mechanically sealed by placing new cement plugs, but recently, new approaches are explored to replace this expensive procedure, for example, customized resin-based sealing solutions (Behaire et al., 2015), heat-induced melting of the well bore and bonding with the surrounding rocks (https://www.interwell.com/plug-abandonment/category538.html), electro-osmosis to enhance shale barrier (Skomedalen et al., 2021), and carbonate precipitation through microbial activities (e.g., Zhu and Dittrich, 2016).
6 Conclusion
In this study, we presented a desktop workflow combining well integrity assessment, numerical modeling, and lab experiments to both assess the need for non-invasive geophysical monitoring and gauge the potential of an in situ cement remediation solution. The proposed well screening methodology aims at quickly identifying problematic wells for future CO2 or H2 storage projects requiring detailed assessment of their integrity. Well integrity non-invasive-based geophysical monitoring holds promise for cost-effective casing integrity description. For the Smeaheia CO2 storage case study, we show that a monitoring strategy is needed for well 32/4-2 T2 and that low-frequency electromagnetic geophysical monitoring can be used to monitor potential well casing corrosion. Our analysis of potential in situ cement remediation solution suggests that the Sognefjord formation water contains enough scaling ions to produce electrochemical-enhanced deposition. The obtained results suggest the need for a detailed field study to prove the applicability of the methods for P&A.
Data Availability Statement
The raw data supporting the conclusion of this article will be made available by the authors, without undue reservation.
Author Contributions
AR contributed to the EM modeling, interpretation, writing, and editing of the manuscript. BE conceptualized and performed the well screen method, did the laboratory experiments for the electrochemical enhanced mineral deposition and interpretation, and contributed to the writing of the manuscript. SZ performed the COMSOL modeling work. BD contributed to the conceptualization the CSEM modeling and to the writing and editing. LE, BE, and KG established the electrochemical enhanced deposition laboratory setup and contributed to the writing of the manuscript. MB performed the XRD analysis and interpretation.
Funding
This work is performed with support from the Research Council of Norway (TOPHOLE project Petromaks2-KPN 295132 and Well fossilization for P&A 285568) and the NCCS Centre (NFR project number 257579/E20). Additional support was obtained from the partners in the NCCS Centre, performed under the Norwegian research program Centres for Environment-friendly Energy Research (FME).
Conflict of Interest
AR, BE, and BD were employed by SINTEF Industry, Applied Geoscience Group. SZ was employed by SINTEF Digital, Applied Optics Group. KG, LE, and MB were employed by SINTEF Industry, Drilling and Well Group.
Publisher’s Note
All claims expressed in this article are solely those of the authors and do not necessarily represent those of their affiliated organizations, or those of the publisher, the editors, and the reviewers. Any product that may be evaluated in this article, or claim that may be made by its manufacturer, is not guaranteed or endorsed by the publisher.
Acknowledgments
We acknowledge our industry and academic partners, NTNU, LLNL, and Aker Solutions for fruitful discussions during the project meetings. The authors acknowledge the following partners: Aker Carbon Capture, Allton, Ansaldo Energia, Baker Hughes, CoorsTek Membrane Sciences, Fortum Oslo Varme, Gassco, KROHNE, Larvik Shipping, Lundin Norway, Norcem, Norwegian Oil and Gas, Quad Geometrics, Stratum Reservoir, Total, Vår Energi, and Wintershall DEA. We thank three colleagues for the helpful reviews.
Supplementary Material
The Supplementary Material for this article can be found online at: https://www.frontiersin.org/articles/10.3389/fenrg.2022.826100/full#supplementary-material
References
Alcalde, J., Flude, S., Wilkinson, M., Johnson, G., Edlmann, K., Bond, C. E., et al. (2018). Estimating Geological CO2 Storage Security to Deliver on Climate Mitigation. Nat. Commun. 9, 2201. doi:10.1038/s41467-018-04423-1
Anwar, M. N., Fayyaz, A., Sohail, N. F., Khokhar, M. F., Baqar, M., Khan, W. D., et al. (2018). CO2 Capture and Storage: A Way Forward for Sustainable Environment. J. Environ. Manage. 226, 131–144. doi:10.1016/j.jenvman.2018.08.009
Bai, M., Zhang, Z., and Fu, X. (2016). A Review on Well Integrity Issues for CO 2 Geological Storage and Enhanced Gas Recovery. Renew. Sustain. Energ. Rev. 59, 920–926. doi:10.1016/j.rser.2016.01.043
Beharie, C., Sean, F., and Øvestad, K. H. (2015). “Resin: An Alternative Barrier Solution Material,” in Paper presented at the SPE Bergen One Day Seminar, Bergen, Norway, April 2015 (Society of Petroleum Engineers). doi:10.2118/173852-ms
Bergmo, P. E. S., Emmel, B. U., Anthonsen, K. L., Aagaard, P., Mortensen, G. M., and Sundal, A. (2017). Quality Ranking of the Best CO2 Storage Aquifers in the Nordic Countries. Energ. Proced. 114, 4374–4381. doi:10.1016/j.egypro.2017.03.1589
Böttner, C., Haeckel, M., Schmidt, M., Berndt, C., Vielstädte, L., Kutsch, J. A., et al. (2020). Greenhouse Gas Emissions from marine Decommissioned Hydrocarbon wells: Leakage Detection, Monitoring and Mitigation Strategies. Int. J. Greenhouse Gas Control. 100, 103119. doi:10.1016/j.ijggc.2020.103119
Bourne, S., Crouch, S., and Smith, M. (2014). A Risk-Based Framework for Measurement, Monitoring and Verification of the Quest CCS Project, Alberta, Canada. Int. J. Greenhouse Gas Control. 26, 109–126. doi:10.1016/j.ijggc.2014.04.026
Constable, S. (2010). Ten Years of marine CSEM for Hydrocarbon Exploration. Geophysics 75 (5), 75A67–75A81. doi:10.1190/1.3483451
Dreyer, T., Whitaker, M., Dexter, J., Flesche, H., and Larsen, E. (2005). From Spit System to Tide-Dominated delta: Integrated Reservoir Model of the Upper Jurassic Sognefjord Formation on the Troll West Field. Pet. Geology. Conf. Ser. 6, 423–448. doi:10.1144/0060423
Dupuy, B., Romdhane, A., Eliasson, P., and Yan, H. (2021). Combined Geophysical and Rock Physics Workflow for Quantitative CO2 Monitoring. Int. J. Greenhouse Gas Control. 106, 103217. doi:10.1016/j.ijggc.2020.103217
Dupuy, B., Torres, V., Romdhane, A., and Ghaderi, A. (2018). “Norwegian Large-Scale CO2 Storage Project (Smeaheia): Baseline Geophysical Models,” in 14th Greenhouse Gas Control Technologies Conference Melbourne 21-26 October 2018 (GHGT-14), 21-26 October 2018. Available at SSRN: https://ssrn.com/abstract=3366399 October 20, 2018).
Edvardsen, L., Emmel, B., Buhiyan, M. H., Gawel, K., and Torsæter, M. (2021). “Electrochemically Enhanced Deposition of Minerals from Syenthetic Reservoir Brine,” in Proceedings TCCS-11 Trondheim conference on CO2 Capture, Transport and Storage, June 22–23, 2021 (SINTEF Academic Press), 218–223.
Edvardsen, L., Gawel, K., Wenner, S., Gawel, B., and Torsæter, M. (2020). Electrochemical Enhancement and Inhibition of Calcium Carbonate Deposition. J. Environ. Chem. Eng. 8 (5), 104239. doi:10.1016/j.jece.2020.104239
Emmel, B., and Dupuy, B. (2021). Dataset of Plugging and Abandonment Status from Exploration wells Drilled within the Troll Gas and Oil Field in the Norwegian North Sea. Data in Brief 37, 107165. doi:10.1016/j.dib.2021.107165
Erichsen, E., Rørvik, K-L., Haaberg, K., and Keaney, G. (2012). Troll Kystnær Subsurface Status Report. Porsgrunn, Norway: GASSNOVA, 120.
Fawad, M., Rahman, M. J., and Mondol, N. H. (2021). Seismic Reservoir Characterization of Potential CO2 Storage Reservoir Sandstones in Smeaheia Area, Northern North Sea. J. Pet. Sci. Eng. 205, 108812. doi:10.1016/j.petrol.2021.108812
Gasda, S. E., Bachu, S., and Celia, M. A. (2004). Spatial Characterization of the Location of Potentially Leaky wells Penetrating a Deep saline Aquifer in a Mature Sedimentary basin. Env Geol. 46, 707–720. doi:10.1007/s00254-004-1073-5
Gassnova, (2016). Feasibility Study for Full-Scale CCS in Norway. Technical report. Gassnova: Ministry of Petroleum and Energy, Norway.
Gehrmann, R., Romdhane, A., Park, J., and Eliasson, P. (2021). “CSEM for CO2 Storage–Feasibility Study at Smeaheia to Optimise Acquisition,” in TCCS–11. CO2 Capture, Transport and Storage. Trondheim 22nd–23rd June 2021. Short Papers from the 11th International Trondheim CCS Conference, Trondheim, Norway, June 21-23, 2021 (SINTEF Academic Press).
Halland, E. K., Mujezinovic, J., and Riis, F. (2014). CO2 Storage Atlas Norwegian Continental Shelf. Stavanger, Norway: Elsevier, 163.
Hassanpouryouzband, A., Joonaki, E., Edlmann, K., and Haszeldine, R. S. (2021). Offshore Geological Storage of Hydrogen: Is This Our Best Option to Achieve Net-Zero? ACS Energ. Lett. 6, 2181–2186. doi:10.1021/acsenergylett.1c00845
IEA Greenhouse Gas R&D Programme (IEA GHG) (2009). Long Term Integrity of CO2 Storage – Well Abandonment”, 2009/08. Cheltenham: IEA Environmental Projects Ltd.
Johannesen, E., and Nøttvedt, A. (2008). Norway Encircled in Coastal plains and Deltas. The Making of a Land: Geology of Norway. Trondheim: Norsk Geologisk Forening, 356–383.
Johnsen, J. R., Rutledal, H., and Nilsen, D. E. (1995). “Jurassic Reservoirs; Field Examples from the Oseberg and Troll Fields: Horda Platform Area,” in Petroleum Exploration and Exploitation in Norway. Editor S. Hanslien (Amsterdam, Netherlands: NPF Special Publication), 199–234. doi:10.1016/s0928-8937(06)80043-3
King, G. E., and King, D. E. (2013). Environmental Risk Arising from Well-Construction Failure-Differences between Barrier and Well Failure, and Estimates of Failure Frequency across Common Well Types, Locations, and Well Age. SPE Prod. Operations 28 (04), 323–344. doi:10.2118/166142-pa
Kinn, S., Foldøy, P., Pettersen, K., Ramstad, F., Rasmussen, H., Hansen, T. H., et al. (1998). PL 205 Licence Group Well 32/4-1. Final Well Report. Available at: https://factpages.npd.no/pbl/wellbore_documents/2918_32_4_1_COMPLETION_REPORT_AND_COMPLETION_LOG.pdf (Accessed on: October 30, 2021).
Landinger, H., Bünger, U., Raksha, T., Weindorf, W., Simon, J., Correas, L., et al. (2014). Update of Benchmarking of Large Scale Hydrogen Underground Storage with Competing Options. Hyunder Rep. (2), 74.
Lothe, A. E., Bergmo, P. E. S., Emmel, B. U., and Eliasson, P. (2018). “Effects of Uncertainties in Fault Interpretations on Pressure Depletion and CO2 Storage Injection at Horda Platform, Offshore Norway,” in GHGT-14 conference proceedings, 21-26 October 2018 (SSRN). Available at SSRN:https://ssrn.com/abstract=3366363 (Accessed on: October 30, 2021).
Lothe, A. E., Bergmo, P. E. S., Emmel, B. U., and Grimstad, A-A. (2021). “How to Evaluate and Quantify Safe CO2 Storage? Workflow Demonstration on the Smeaheia Area, Offshore Norway,” in GHGT-15 conference proceedings, 15-18 March 2021 (SSRN). Available at SSRN:https://ssrn.com/abstract=3811556 (Accessed on: October 30, 2021).
Lu, P., Zhang, G., Apps, J., and Zhu, C. (2022). Comparison of Thermodynamic Data Files for PHREEQC. Earth-Science Rev. 225, 103888. doi:10.1016/j.earscirev.2021.103888
Metoki, N., Sadman, K., Shull, K., Eliaz, N., and Mandler, D. (2016). Electro-Assisted Deposition of Calcium Phosphate on Self-Assembled Monolayers. Electrochimica Acta 206, 400–408. doi:10.1016/j.electacta.2016.04.143
Mulrooney, M. J., Osmond, J. L., Skurtveit, E., Faleide, J. I., and Braathen, A. (2020). Structural Analysis of the Smeaheia Fault Block, a Potential CO2 Storage Site, Northern Horda Platform, North Sea. Mar. Pet. Geology. 121, 104598. doi:10.1016/j.marpetgeo.2020.104598
Nazarian, B., Thorsen, R., and Ringrose, P. (2018). “Storing CO2 in a Reservoir under Continuous Pressure Depletion; a Simulation Study,” in 14th Greenhouse Gas Control Technologies Conference Melbourne 21-26 October 2018 (GHGT-14), 21-26 October 2018 (SSRN). Available at SSRN:https://ssrn.com/abstract=3365822 (Accessed on: October 30, 2021).
NORSOK, D-010 (2004). Well Integrity in Drilling and Well Operations, NORSKO Standard D-10 (Rev. 3), Standards Norway. Lysaker, Norway. Available at https://www.standard.no/pagefiles/1315/d-010r3.pdf (Accessed on: October 30, 2021).
Osundare, O. S., Teodoriu, C., Falcone, G., and Ichim, A. (2018). “Estimation of Plugging and Abandonment Costs Based on Different EU Regulations with Application to Geothermal wells,” in Presented at 43rd Workshop on Geothermal Reservoir Engineering, Stanford, California, 12-14 February (Stanford University).
Parkhurst, D. L., and Appelo, C. (2013). Description of Input and Examples for PHREEQC Version 3: a Computer Program for Speciation, Batch-Reaction, One-Dimensional Transport, and Inverse Geochemical Calculations. US Geol. Surv. doi:10.3133/tm6a43
Patruno, S., Hampson, G. J., Jackson, C. A. L., and Dreyer, T. (2015). Clinoform Geometry, Geomorphology, Facies Character and Stratigraphic Architecture of a Sand‐rich Subaqueous delta: Jurassic Sognefjord Formation, Offshore Norway. Sedimentology 62, 350–388. doi:10.1111/sed.12153
Pawar, R. J., Bromhal, G. S., Carey, J. W., Foxall, W., Korre, A., Ringrose, P. S., et al. (2015). Recent Advances in Risk Assessment and Risk Management of Geologic CO2 Storage. Int. J. Greenhouse Gas Control. 40, 292–311. doi:10.1016/j.ijggc.2015.06.014
Pawar, R., and van der Valk, K. 2020. Summary Report of Well Assessment Tool Framework – Deliverable D2. REX-CO2 report, 21pp.
QGIS.org (2022). QGIS Geographic Information System. QGIS Association. Available at: http://www.qgis.org (Accessed on: January 1, 2022)
Rahman, M. J., Fawad, M., and Mondol, N. H. (2020). Organic-rich Shale Caprock Properties of Potential CO2 Storage Sites in the Northern North Sea, Offshore Norway. Mar. Pet. Geology. 122, 104665. doi:10.1016/j.marpetgeo.2020.104665
R. Kaufmann, and S. E. Gasada (Editors) (2018). “Large-scale CO2 Storage in Smeaheia,”. FME SUCCESS synthesis report, 41.
Samand, N. N. (2017). A Historical Development of P&A Requirements on the NCS and its Effects on Permanently Plugged and Abandoned wells.MSc Thesis University of Stavanger, 98.
Saulis, G., Lapė, R., Pranevičiūtė, R., and Mickevičius, D. (2005). Changes of the Solution pH Due to Exposure by High-Voltage Electric Pulses. Bioelectrochemistry 67 (1), 101–108. doi:10.1016/j.bioelechem.2005.03.001
Sheng, K., Ge, H., Huang, X., Zhang, Y., Song, Y., Ge, F., et al. (2020). Formation and Inhibition of Calcium Carbonate Crystals under Cathodic Polarization Conditions. Crystals 10 (4), 275. doi:10.3390/cryst10040275
Sidler, R., Carcione, J. M., and Holliger, K. (2014). A Pseudospectral Method for the Simulation of 3-D Ultrasonic and Seismic Waves in Heterogeneous Poroelastic Borehole Environments. Geophys. J. Int. 196 (2), 1134–1151. doi:10.1093/gji/ggt447
Sk, M. H., Abdullah, A. M., Ko, M., Ingham, B., Laycock, N., Arul, R., et al. (2017). Local Supersaturation and the Growth of Protective Scales during CO2 Corrosion of Steel: Effect of pH and Solution Flow. Corrosion Sci. 126, 26–36. doi:10.1016/j.corsci.2017.05.026
Skomedalen, E., Park, J., Soldal, M., Smith, H., and Mokkelbost, S. (2021). Electro-osmosis to Enhance Shale Barrier. ARMA, 1329–1340.
Stewart, D. J., Schwander, M., and Bolle, L. (1995). Jurassic Depositional Systems of the Horda Platform, Norwegian north Sea: Practical Consequences of Applying Sequence Stratigraphic Models. Norwegian Pet. Soc. Spec. Publications 5, 291–323. doi:10.1016/s0928-8937(06)80073-1
Streich, R. (2009). 3D Finite-Difference Frequency-Domain Modeling of Controlled-Source Electromagnetic Data: Direct Solution and Optimization for High Accuracy. Geophysics 74 (5), F95–F105. doi:10.1190/1.3196241
Tiong, M., Gholami, R., and Rahman, M. E. (2019). Cement Degradation in CO2 Storage Sites: a Review on Potential Applications of Nanomaterials. J. Petrol. Explor Prod. Technol. 9, 329–340. doi:10.1007/s13202-018-0490-z
Vielstädte, L., Karstens, J., Haeckel, M., Schmidt, M., Linke, P., Reimann, S., et al. (2015). Quantification of Methane Emissions at Abandoned Gas wells in the Central North Sea. Mar. Pet. Geology. 68, 848–860. doi:10.1016/j.marpetgeo.2015.07.030
Vollset, J., and Doré, A. G. (1984). A Revised Triassic and Jurassic Lithostratigraphic Nomenclature for the Norwegian North Sea. NPD-Bulletin No. 3, 53.
Warren, E. A., Smalley, C. P., and Howarth, R. J. (1994). Part 4: Compositional Variations of North Sea Formation Waters. Geol. Soc. Lond. Mem. 15, 119–208. doi:10.1144/gsl.mem.1994.015.01.05
Wehner, D., Borges, F., and Landrø, M. (2021). Tube-wave Monitoring as a Method to Detect Shear Modulus Changes Around Boreholes: A Case Study. Geophysics 86 (3), B193–B207. doi:10.1190/geo2020-0294.1
Williams, J. P., Regehr, A., and Kang, M. (2020). Methane Emissions from Abandoned Oil and Gas Wells in Canada and the United States. Environ. Sci. Technol. 55 (1), 563–570. doi:10.1021/acs.est.0c04265
Wu, L., Thorsen, R., Ottesen, S., Meneguolo, R., Hartvedt, K., Ringrose, P., et al. (2021). Significance of Fault Seal in Assessing CO2 Storage Capacity and Containment Risks - an Example from the Horda Platform, Northern North Sea. Pet. Geosci. 27, petgeo2020–102. doi:10.1144/petgeo2020-102-
Yang, Y., Khan, F., Thodi, P., and Abbassi, R. (2016). Corrosion Induced Failure Analysis of Subsea Pipelines. Reliability Engineering & System Safety 159, 214–222. doi:10.1016/j.ress.2016.11.014
Zeppenfeld, K. (2011). Electrochemical Removal of Calcium and Magnesium Ions from Aqueous Solutions. Desalination 277, 99–105. doi:10.1016/j.desal.2011.04.005
Zhang, L. W., Dzombak, D. A., Nakles, D. V., Hawthorne, S. B., Miller, D. J., Kutchko, B. G., et al. (2013). Characterization of Pozzolan-Amended Wellbore Cement Exposed to CO2 and H2S Gas Mixtures under Geologic Carbon Storage Conditions. Int. J. Greenhouse Gas Control. 19, 358–368. doi:10.1016/j.ijggc.2013.09.004
Keywords: CO2 storage, plugging and abandonment, geophysical monitoring, numerical modeling, geochemistry
Citation: Romdhane A, Emmel B, Zonetti S, Dupuy B, Gawel K, Edvardsen L and Bhuiyan MH (2022) Screening, Monitoring, and Remediation of Legacy Wells to Improve Reservoir Integrity for Large-Scale CO2 Storage—An Example From the Smeaheia Structure in the Northern North Sea. Front. Energy Res. 10:826100. doi: 10.3389/fenrg.2022.826100
Received: 30 November 2021; Accepted: 17 January 2022;
Published: 16 March 2022.
Edited by:
Greeshma Gadikota, Cornell University, United StatesReviewed by:
Sohaib Mohammed, Cornell University, United StatesAliakbar Hassanpouryouzband, University of Edinburgh, United Kingdom
Quin Miller, Pacific Northwest National Laboratory (DOE), United States
Copyright © 2022 Romdhane, Emmel, Zonetti, Dupuy, Gawel, Edvardsen and Bhuiyan. This is an open-access article distributed under the terms of the Creative Commons Attribution License (CC BY). The use, distribution or reproduction in other forums is permitted, provided the original author(s) and the copyright owner(s) are credited and that the original publication in this journal is cited, in accordance with accepted academic practice. No use, distribution or reproduction is permitted which does not comply with these terms.
*Correspondence: B. Emmel, YmVuamFtaW51ZG8uZW1tZWxAc2ludGVmLm5v